
- Market Size (2026)
- USD 74.7 Bn
- Forecast (2036)
- USD 269.6 Bn
- CAGR (2026 to 2036)
- 13.7%
How big is the OLED Market in 2026?
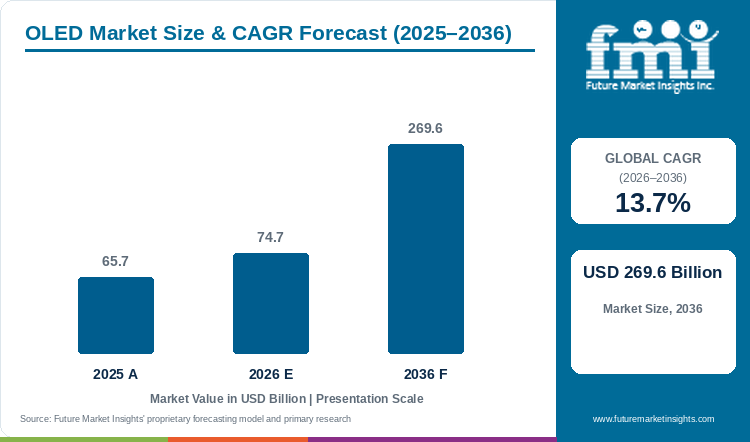
The global OLED market is estimated at USD 74.70 billion in 2026, compared with USD 65.7 billion in 2025, and is forecast to reach USD 269.58 billion by 2036, expanding at a CAGR of 13.7% from 2026 to 2036.
Demand for OLED displays is being supported by laptop manufacturers seeking higher screen brightness and longer panel operating life. The display segment accounts for 82.6% of the market by product type in 2026, while AMOLED contributes 67.3% by drive technology and consumer electronics holds 76.4% by end use. Growth in premium notebook applications is reflected in recent advances in tandem OLED technology. In July 2026, Samsung Display began full-scale supply of laptop panels supporting the VESA DisplayHDR True Black 1400 certification. The panels achieve peak brightness of up to 1,600 nits, more than 40% higher than conventional single-stack OLED panels, while offering more than twice the operating lifespan under typical laptop brightness conditions. Lenovo's Yoga Pro 9i Aura Edition received the certification in July, with ASUS, Dell Technologies and MSI expected to introduce compatible products. Manufacturers are also expanding production capacity to serve the growing notebook display market. In June 2026, BOE announced the start of mass production at its Gen 8.6 AMOLED facility in Chengdu, China. The company delivered its first 14-inch 2.8K OLED notebook panels and held a customer delivery ceremony attended by more than 10 device manufacturers. The development expands commercial supply options for laptop brands introducing higher-performance OLED displays..
Key Market Trends & Insights
- LG Display's 2025 annual report says it plans to expand its television and OLED gaming-monitor lineup through strategic customers. This gives panel suppliers an additional gaming specification to address alongside household television programmes.
- AUO's wearable range includes Memory-in-Pixel technology for professional outdoor uses, alongside AMOLED. OLED suppliers therefore face a competing offer when visibility and battery use dominate a wearable specification.
- LG Electronics USA introduced a 65-inch OLED Pro monitor in April 2026 with integrated 12G-SDI and studio calibration features. Professional-video workflows create a specification-led display opportunity beyond mainstream household televisions.
Regional Highlights
- In Europe, electronic-display energy labels disclose both standard- and high-dynamic-range consumption. Suppliers serving televisions and monitors have to consider the finished device's energy performance alongside peak brightness.
- In East Asia, BOE says it now has four AMOLED production lines across the Sichuan-Chongqing region. The regional cluster brings several production programmes into one manufacturing area, making local supply-chain support relevant to customers evaluating new panel sources.
Table 1: OLED Market Size and Forecast in USD billion and CAGR percentage, 2025 to 2036
| Market size and forecast | Value |
|---|---|
| Market size in 2025 | USD 65.7 billion |
| Estimated market size in 2026 | USD 74.70 billion |
| Projected market size by 2036 | USD 269.58 billion |
| CAGR from 2026 to 2036 | 13.7% |
| Added revenue from 2026 to 2036 | USD 194.88 billion |
| Market size forecast for 2035 | USD 237.1 billion |
Source: Future Market Insights, OLED Market Report, 2026 to 2036.
Analyst Perspective
“An OLED panel wins volume when a device maker can meet brightness, life and cost targets at manufacturing yield. A striking laptop launch is evidence of a design, not of broad adoption across every screen size.”
- Sudip Saha, Co-founder, FMI
How is the OLED Market segmented?
- By Product Type: Display segment and Lighting.
- By Drive Technology: AMOLED, PMOLED and Other Drive Configurations.
- By Mechanical Format: Rigid OLED and Flexible OLED.
- By Optical Property: Transparent OLED and Opaque OLED.
- By End Use: Consumer electronics segment, Automotive, and Healthcare and Industrial.
- By Region: North America, Latin America, Western Europe, Eastern Europe, East Asia, South Asia and Pacific, and Middle East and Africa.
Drive technology identifies how an OLED is controlled; mechanical format describes whether the substrate is rigid or flexible; optical property distinguishes a see-through panel from an opaque panel. These characteristics are recorded separately, so a flexible transparent AMOLED product retains each relevant characteristic.
Why does the display segment lead by product type?
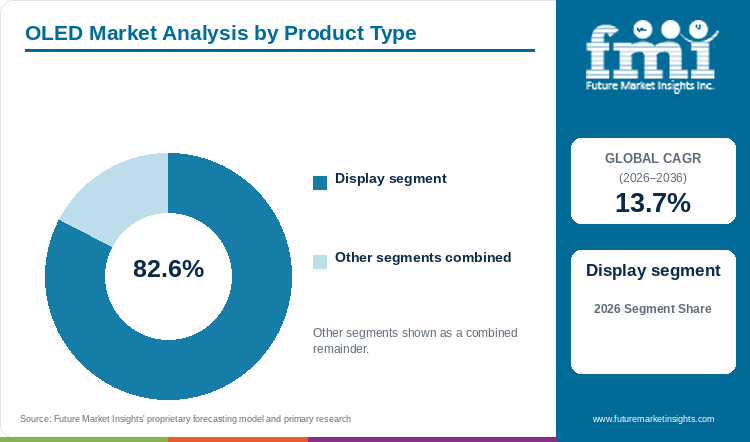
The display segment accounts for 82.6% of the market by product type in 2026.
FMI finds that the category benefits from several purchasing cycles rather than relying on a single device. Samsung Display supplies laptop panels, LG Display reports OLED production for television customers, and AUO offers AMOLED wearable displays. These are separate applications with different screen sizes and operating conditions. Their breadth gives display suppliers more routes to revenue than a single premium launch would suggest.
The buying decision remains tied to the finished product. A notebook customer may need power and lifetime performance under sustained use; a wearable customer also has to match a compact form. FMI therefore sees the lead of displays as a consequence of multiple qualified device programmes. It does not imply that a panel designed for one of those programmes can be substituted directly into another.
Table 2: OLED Market Leading Product Type Share, 2026
| Leading Share | 2026 market share |
|---|---|
| Display segment | 82.6% |
| All Other Segments Combined Share | 17.4% |
Source: Future Market Insights, OLED Market Report, 2026 to 2036.
Why is AMOLED the largest drive technology?
AMOLED accounts for 67.3% of the market by drive technology in 2026.
Individual pixel control supports the image requirements of high-resolution device programmes. Samsung Display explains that AMOLED uses thin-film transistors to control individual pixels, while passive-matrix OLED addresses lines in sequence. BOE's June 2026 announcement identifies AMOLED production for its Chengdu line, and AUO's circular AMOLED offer serves wearables. FMI finds that this reach across computing and compact devices supports the active-matrix category's position.
A supplier still has to qualify the panel for its intended device. Samsung Display's rollable notebook announcement describes a different construction task from AUO's circular wearable offer. FMI finds that a technology label alone cannot establish production yield or customer acceptance. Buyers have to identify the actual format and operating requirements behind that label before comparing an offer.
Table 3: OLED Market Leading Drive Technology Share, 2026
| Leading Share | 2026 market share |
|---|---|
| AMOLED | 67.3% |
| All Other Segments Combined Share | 32.7% |
Source: Future Market Insights, OLED Market Report, 2026 to 2036.
What supports the consumer electronics segment as the leading end use?
The consumer electronics segment accounts for 76.4% of the market by end use in 2026.
FMI finds that manufacturers can use OLED performance to differentiate several products sold to households and individual users. Apple's May 2024 iPad Pro introduced tandem OLED in both screen sizes, and Samsung Display's 2026 laptop offer adds another premium computing programme. These examples explain the route to demand: a device brand selects a panel to meet a particular product specification and then orders against the programme.
The adoption decision still competes with other display technologies and the cost of the complete device. Samsung's India television lineup includes OLED alongside several alternatives. FMI reads this as evidence of choice within a brand's range rather than an automatic conversion of all screen sales to OLED. The category leads because it spans several established device uses, while automotive and industrial programmes have different qualification conditions.
Table 4: OLED Market Leading End Use Share, 2026
| Leading Share | 2026 market share |
|---|---|
| Consumer electronics segment | 76.4% |
| All Other Segments Combined Share | 23.6% |
Source: Future Market Insights, OLED Market Report, 2026 to 2036.
What are the key drivers restraints and opportunities?
FMI expects demand to grow through device specifications and additional applications. Brightness, lifetime and the price of the finished device determine how far each programme can expand.
Driver
Panel performance can make OLED suitable for another premium computing programme. Samsung Display says its tandem structure shares the light-emission load between two layers and improves lifetime at typical laptop brightness. FMI finds that longer usable life addresses a practical concern for a device maker evaluating higher-brightness panels, rather than adding brightness as an isolated specification.
Restraint
A moving display introduces a qualification task beyond the image itself. Samsung Display's January 2025 rollable-panel announcement describes a Lenovo notebook design that expands the screen. FMI's reading is that the customer must validate the display within the complete mechanism and intended usage. One announced design therefore provides evidence of a programme, rather than proof of adoption across the notebook market.
Opportunity
Suppliers can win additional business in professional reference displays where calibration and video connectivity determine suitability. LG Electronics USA's April 2026 OLED Pro launch targets broadcast and virtual-production work. The opportunity is the workflow's need for a controlled display, rather than a general assumption that every professional buyer will replace its monitor with OLED.
How do display rules and quality requirements affect purchasing?
For products within scope, EU electronic-display rules cover minimum energy performance and product information, with specific exclusions and partial requirements. FMI finds that a panel maker has to work with the device customer on the applicable finished-product category. Brightness certification does not substitute for the device's energy information, and rules for televisions cannot be applied without checking the treatment of a smaller or specialist display.
What limits reliable OLED operation and supply?
Brightness and operating life have to be considered together. Samsung Display explains that organic-material efficiency and stability affect both, and that tandem layers can reduce the load on each emissive layer. FMI expects qualification to test the intended operating conditions. A quoted peak-brightness result cannot by itself show performance under every screen pattern or establish a supplier's volume yield.
Where can OLED suppliers win additional business?
Wearables offer an application in which shape and power use matter alongside image quality. AUO markets a thin circular AMOLED display for this use. FMI finds that matching the customer's enclosure and usage requirements can secure a programme that a standard rectangular panel does not address. Suppliers still have to demonstrate the complete product's suitability; the existence of a circular offer does not measure the size of wearable demand.
OLED Market by Country (2026 to 2036)
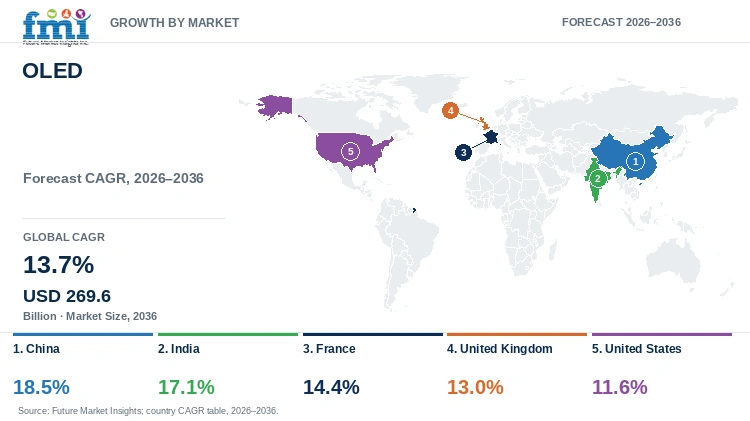
Table 5: OLED Market Country CAGR Comparison, 2026 to 2036
| Country | CAGR |
|---|---|
| China | 18.5% |
| India | 17.1% |
| France | 14.4% |
| United Kingdom | 13.0% |
| United States | 11.6% |
Source: Future Market Insights, OLED Market Report, 2026 to 2036.
What supports OLED demand in China?
BOE's Chengdu line gives Chinese OLED suppliers a route into notebook programmes beyond their small-screen phone business. The company announced mass production and customer deliveries from its Gen 8.6 AMOLED line on 17 June 2026; the first delivered notebook panel identifies the application behind that capacity. For a device maker, this is another panel source to evaluate against the brightness, operating life and production requirements of a computing product. An investment proposal alone would not offer the same starting point for qualification.
China's 18.5% CAGR from 2026 to 2036, the highest in FMI's country outlook, depends on turning such programmes into accepted panels and repeat orders. A new line does not immediately establish the cost or yield of an established plant. Nor does it show that every Chinese display factory makes OLED. The local commercial case combines panel production with access to additional screen-size markets, so the customer has to compare the intended notebook panel rather than rely on a supplier's phone-panel record.
Samsung Display's tandem laptop supply addresses the same premium-computing opportunity. That competition makes the device specification decisive: Chinese capacity still has to win a customer's acceptance at the required performance and delivery conditions. The 18.5% outlook covers the Chinese OLED market rather than BOE alone. Successful qualification across domestic and export device programmes is what can convert the broader production base into market revenue.
What supports OLED adoption in India?
Samsung India's May 2026 television launch placed OLED alongside several competing screen technologies. That range makes the local buying decision clear: a household chooses a complete device and price point, rather than purchasing OLED technology in isolation. Panel suppliers have to support the brand's selected brightness, size and operating requirements while the device maker determines the final offer. The launch establishes an Indian consumer route for OLED, but does not disclose OLED-only sales or establish a domestic panel-fabrication base.
Device sales and assembly programmes are therefore the starting point for India's 17.1% CAGR from 2026 to 2036 in FMI's forecast. Growth rests on adoption of suitable products and the supply chain serving them. The presence of alternative display constructions in the same brand's range keeps value important: a panel has to earn its place in a device that the customer is willing to buy.
The distinction between device demand and fabrication is especially important when reading policy announcements. India's Cabinet approved a GaN-based Mini/Micro-LED display facility at Dholera in May 2026. This is a different technology and cannot be counted as an approved OLED factory.
An OLED-fabrication proposal would need its own evidence of approval and operation before adding operating capacity. Suppliers can develop relationships through device programmes already on offer while keeping proposed investment separate from panels being produced. The forecast consequently allows for consumer adoption without assuming that every display announcement becomes local OLED supply.
How do product requirements shape the OLED market in France?
A television sold in France has to make its durability visible alongside its picture. The durability index introduced in January 2025 adds reliability to the information already provided on repairability. For an OLED supplier, that makes operating life and support for the device programme commercially relevant before the customer compares a showroom image. The index does not favour OLED automatically; competing display technologies can also meet a brand's durability requirements.
Energy information adds another part of the comparison. EU electronic-display rules apply to the finished products within their scope. A device maker needs a panel suited to the expected operating conditions and the information required for the complete product. Brightness, power and life therefore have to be assessed together. A strong image alone may be insufficient if the panel offer does not fit the product's service requirements or the brand's intended position.
FMI's forecast of 14.4% CAGR for France from 2026 to 2036 reflects adoption within suitable television, monitor and computing programmes under these purchasing conditions. It is not a forecast for the durability index, and a high index score does not force a buyer to choose OLED. Suppliers need to demonstrate advantages in the intended use and support the associated product information. Keeping a panel's specifications separate from claims about the whole television helps the buyer make that comparison. The local opportunity is to qualify for a durable, efficient device programme and retain that specification through its production cycle.
What drives OLED purchasing in the United Kingdom?
Ofcom's Media Nations 2026 still identifies broadcaster content as the majority of video watched in UK homes, alongside continued growth in streaming and video-sharing. These viewing habits give device makers a use case to serve, but a streaming subscription does not itself create a panel order. The evidence describes content consumption rather than OLED ownership. A buyer replacing a screen must still choose a television, monitor or notebook at an acceptable complete-device price.
OLED suppliers reach that buyer through a product programme with a realistic route to purchase. FMI expects the UK OLED market to expand at a 13.0% CAGR from 2026 to 2036 as the technology gains a place in suitable replacement and device offers. The commercial comparison remains the finished screen's performance and price. More viewing services cannot substitute for a device that customers actually choose, and demand does not require an assumed UK panel-fabrication base.
The UK's energy-information framework also covers electronic displays, including televisions. This adds a visible purchasing comparison beyond a premium image specification. Suppliers need to establish which device category the customer intends to sell and provide the information relevant to it. Considering operating performance and energy information together connects a panel's advantages to the local buying decision. It also keeps the 13.0% outlook grounded in adoption across actual programmes, rather than treating all UK screen use as OLED demand.
What supports OLED demand in the United States?
A professional video customer buys a display for a workflow rather than for its panel label. LG Electronics USA introduced a 65-inch OLED Pro monitor for broadcast, virtual production and high-end audiovisual work in April 2026. Those customers need calibration and connectivity suited to their work. Their qualification differs from that of a household television buyer, giving OLED suppliers a specialist US route to an order.
Consumer computing provides another route. Apple's May 2024 iPad Pro introduced tandem OLED in both screen sizes. This identifies a US device brand selecting the technology for a defined product; it does not establish where the panels were fabricated. The brand's brightness and power requirements set what a supplier has to demonstrate within the complete device.
Together, consumer-device adoption and specialist display work support FMI's 11.6% CAGR forecast for the United States from 2026 to 2036. A launch needs to become a qualified production programme before it sustains panel revenue. The customer requires acceptable performance under intended use and a supply arrangement that fits its production plan, rather than publicity around a new format.
Success in a professional reference monitor does not prove acceptance in a high-volume consumer device, or the reverse. Suppliers have to distinguish the two when planning sales and capacity. That distinction ties the forecast to programme execution and the specifications of the US device customer.
Who are the notable companies in the OLED Market?
Samsung Display, LG Display, BOE and AUO serve different parts of the OLED panel market. Samsung Display's documented offer includes tandem laptop panels, LG Display reports OLED television production, BOE has brought its Chengdu Gen 8.6 AMOLED line into mass production, and AUO offers circular AMOLED displays for wearables. These positions create different routes to a device maker's specification.
FMI finds that the large notebook and television programmes reward the ability to qualify a panel and deliver it consistently. The relevant comparison is the intended screen and operating requirement, rather than a supplier's total revenue across unrelated display technologies. LG Display's annual report illustrates this distinction: a change in its LCD television business affected television revenue while OLED production increased.
For a wearable buyer, AUO's circular format addresses a different enclosure and usage requirement. A supplier can therefore hold a useful position without competing for the same large-panel orders. FMI's view is that panel architecture, organic materials, application development and customer qualification together shape the supplier offer. The verified activities in this report establish those roles; they do not provide numerical company market shares or prove equal operating yields.
Key Developments in the OLED Market
- On 20 July 2026, Samsung Display announced full-scale supply of tandem laptop OLED panels supporting the VESA DisplayHDR True Black 1400 tier. A Lenovo notebook had received certification; other named customers' products were expected subsequently.
- On 17 June 2026, BOE announced the mass-production launch and customer deliveries from its Gen 8.6 AMOLED line in Chengdu, including a 14-inch 2.8K notebook display.
Key Players in the OLED Market
- Samsung Display
- LG Display
- BOE
- AUO
OLED Market Report Scope
Table 6: Report Scope for the OLED Market, 2026 to 2036
| Coverage field | Report scope |
|---|---|
| Market definition | OLED displays and lighting products covered by FMI's market-value outlook. |
| Market boundaries | Excludes the full selling value of smartphones, televisions and other finished devices containing a panel. |
| Quantitative units | USD billion for value and percentage for shares and CAGRs. |
| Reference and forecast period | 2025 reference value, 2026 base year, and forecast from 2026 to 2036; 2035 reference forecast is retained. |
| Product coverage | Display segment and Lighting. |
| Drive technology coverage | AMOLED, PMOLED and Other Drive Configurations; separate from substrate flexibility and transparency. |
| Mechanical format coverage | Rigid OLED and Flexible OLED, classified by the panel substrate. |
| Optical property coverage | Transparent OLED and Opaque OLED, classified by the panel's see-through capability. |
| End use coverage | Consumer electronics segment, Automotive, and Healthcare and Industrial. |
| Geographic coverage | Seven global regions with nested country coverage; detailed forecast profiles cover China, India, France, United Kingdom and United States. |
Source: Future Market Insights, OLED Market Report, 2026 to 2036.
OLED Market Research Methodology
The assessment retains FMI's market-value series, segment shares and country forecasts. Secondary review compares company production and product announcements with official display requirements and local device-market evidence. Manufacturer technical explanations distinguish drive technology, substrate format and optical property. Announced projects, operating supply and finished-product launches are treated separately. Supplier positions are checked against the documented panel offer. No new primary interviews or independent factory-yield measurements were conducted for this assessment.
OLED Market by Segments
OLED Market segmented by Product Type:
- Display segment
- Lighting
OLED Market segmented by Drive Technology:
- AMOLED
- PMOLED
- Other Drive Configurations
OLED Market segmented by Mechanical Format:
- Rigid OLED
- Flexible OLED
OLED Market segmented by Optical Property:
- Transparent OLED
- Opaque OLED
OLED Market segmented by End Use:
- Consumer electronics segment
- Automotive
- Healthcare and Industrial
OLED Market by Region
- North America
- United States
- Canada
- Latin America
- Brazil
- Mexico
- Argentina
- Chile
- Western Europe
- Germany
- France
- United Kingdom
- Italy
- Spain
- Benelux
- Nordics
- Eastern Europe
- Poland
- Czech Republic
- Romania
- Hungary
- East Asia
- China
- Japan
- South Korea
- Taiwan
- South Asia and Pacific
- India
- Singapore
- Other ASEAN countries
- Australia and New Zealand
- Middle East and Africa
- GCC Countries
- South Africa
- Türkiye
- Israel
Research Sources and Bibliography
- [1] Samsung Display. Samsung Display Sets a New Brightness Standard for Premium Laptops with VESA DisplayHDR True Black 1400 Tandem OLED. 20 July 2026.
- [2] LG Display. 2025 Annual Report, Form 6-K. Published March 2026; television business discussion.
- [3] Samsung Display. Samsung Display to Begin Mass Production of World's First Rollable OLED for Laptops. January 2025.
- [4] European Commission. Electronic Displays: Ecodesign and Energy Labelling. Official product-requirements page, accessed 31 October 2026.
- [5] BOE. BOE Launches China's First Gen 8.6 AMOLED Production Line, Ushering in a New Era for High-End Displays. 17 June 2026.
- [6] Government of India, Press Information Bureau. Cabinet Approves Two More Semiconductor Manufacturing Units with Cumulative Investment of More Than Rs. 3,900 Crore. 5 May 2026.
- [7] Samsung Newsroom India. Samsung Brings 2026 Vision AI TV Lineup in India. 26 May 2026.
- [8] French Ministry for Ecological Transition. Indice de durabilité. Official product-information page, accessed 31 October 2026.
- [9] Ofcom. Media Nations 2026. 29 July 2026.
- [10] UK Government. Regulations: Energy Information. Official guidance, accessed 31 October 2026.
- [11] Apple. Apple Unveils New iPad Pro with M4 Chip and Apple Pencil Pro. 7 May 2024.
- [12] LG Electronics USA. LG Electronics USA Debuts Next-Gen OLED Pro Monitor for Broadcast, Virtual Production and AV Workflows. 15 April 2026.
- [13] AUO. Wearable Device Display Products. Official product page, accessed 31 October 2026.
- [14] Samsung Display. About the Types of OLED (translated title; Korean technical page). Technical explanation of passive- and active-matrix driving, accessed 31 October 2026.
- [15] Universal Display Corporation. Flexible OLEDs (FOLEDs). Technical explanation of rigid and flexible substrates, accessed 31 October 2026.
- [16] Universal Display Corporation. Transparent OLEDs (TOLEDs). Technical explanation of optically transparent contacts and active-matrix configurations, accessed 31 October 2026.
Table of Content
- Key Takeaways
- Market Size and CAGR
- Top Growth Driver
- Fastest Growing Segment
- Leading Region
- Key Companies
- Emerging Opportunities
- Executive Summary
- Global Market Outlook
- Demand-side Trends
- Supply-side Trends
- Technology Roadmap Analysis
- Analysis and Recommendations
- Analyst Perspective (What is happening? Why now? What should investors know?)
- Key Questions Answered
- How large is the market?
- What is the CAGR?
- What are key trends?
- Which region dominates?
- Who are the leaders?
Read More...
- Market Overview
- Market Coverage / Taxonomy
- Market Definition / Scope / Limitations
- Research Methodology
- Chapter Orientation
- Analytical Lens and Working Hypotheses
- Market Structure, Signals, and Trend Drivers
- Benchmarking and Cross-market Comparability
- Market Sizing, Forecasting, and Opportunity Mapping
- Research Design and Evidence Framework
- Desk Research Programme (Secondary Evidence)
- Expert Input and Fieldwork (Primary Evidence)
- Tooling, Models, and Reference Databases
- Data Engineering and Model Build
- Quality Assurance and Audit Trail
- Market Background
- Market Dynamics (Drivers, Restraints, Opportunity, Trends)
- Scenario Forecast (Optimistic, Likely, Conservative)
- Impact Analysis
- AI Impact
- Sustainability Impact
- Regulatory Impact
- Technology Impact
- Consumer / Buyer Analysis
- Purchase Drivers
- Adoption Barriers
- Buyer Journey
- Opportunity Map Analysis
- Product Life Cycle Analysis
- Supply Chain Analysis
- Investment Feasibility Matrix
- Value Chain Analysis
- PESTLE and Porter's Analysis
- Regulatory Landscape
- Regional Parent Market Outlook
- Production and Consumption Statistics
- Import and Export Statistics
- Global Market Analysis and Forecast, 2021 to 2036
- Historical Market Size Value (USD Billion) Analysis, 2021 to 2025
- Current and Future Market Size Value (USD Billion) Projections, 2026 to 2036
- Y-o-Y Growth Trend Analysis
- Absolute $ Opportunity Analysis
- Global Market Pricing Analysis, 2021 to 2036
- Global Market Analysis and Forecast, By Product Type, 2021 to 2036
- Introduction / Key Findings
- Historical Market Size Value (USD Billion) Analysis By Product Type, 2021 to 2025
- Current and Future Market Size Value (USD Billion) Analysis and Forecast By Product Type, 2026 to 2036
- Display segment
- Lighting
- Y-o-Y Growth Trend Analysis By Product Type, 2021 to 2025
- Absolute $ Opportunity Analysis By Product Type, 2026 to 2036
- Global Market Analysis and Forecast, By Drive Technology, 2021 to 2036
- Introduction / Key Findings
- Historical Market Size Value (USD Billion) Analysis By Drive Technology, 2021 to 2025
- Current and Future Market Size Value (USD Billion) Analysis and Forecast By Drive Technology, 2026 to 2036
- AMOLED
- PMOLED
- Other Drive Configurations
- Y-o-Y Growth Trend Analysis By Drive Technology, 2021 to 2025
- Absolute $ Opportunity Analysis By Drive Technology, 2026 to 2036
- Global Market Analysis and Forecast, By Mechanical Format, 2021 to 2036
- Introduction / Key Findings
- Historical Market Size Value (USD Billion) Analysis By Mechanical Format, 2021 to 2025
- Current and Future Market Size Value (USD Billion) Analysis and Forecast By Mechanical Format, 2026 to 2036
- Rigid OLED
- Flexible OLED
- Y-o-Y Growth Trend Analysis By Mechanical Format, 2021 to 2025
- Absolute $ Opportunity Analysis By Mechanical Format, 2026 to 2036
- Global Market Analysis and Forecast, By Optical Property, 2021 to 2036
- Introduction / Key Findings
- Historical Market Size Value (USD Billion) Analysis By Optical Property, 2021 to 2025
- Current and Future Market Size Value (USD Billion) Analysis and Forecast By Optical Property, 2026 to 2036
- Transparent OLED
- Opaque OLED
- Y-o-Y Growth Trend Analysis By Optical Property, 2021 to 2025
- Absolute $ Opportunity Analysis By Optical Property, 2026 to 2036
- Global Market Analysis and Forecast, By End Use, 2021 to 2036
- Introduction / Key Findings
- Historical Market Size Value (USD Billion) Analysis By End Use, 2021 to 2025
- Current and Future Market Size Value (USD Billion) Analysis and Forecast By End Use, 2026 to 2036
- Consumer electronics segment
- Automotive
- Healthcare and Industrial
- Y-o-Y Growth Trend Analysis By End Use, 2021 to 2025
- Absolute $ Opportunity Analysis By End Use, 2026 to 2036
- Global Market Analysis and Forecast, By Region, 2021 to 2036
- Introduction
- Historical Market Size Value (USD Billion) Analysis By Region, 2021 to 2025
- Current Market Size Value (USD Billion) Analysis and Forecast By Region, 2026 to 2036
- North America
- Latin America
- Western Europe
- Eastern Europe
- East Asia
- South Asia and Pacific
- Middle East and Africa
- Market Attractiveness Analysis By Region
- North America Market Analysis and Forecast, By Country, 2021 to 2036
- Historical Market Size Value (USD Billion) Trend Analysis By Market Taxonomy, 2021 to 2025
- Market Size Value (USD Billion) Forecast By Market Taxonomy, 2026 to 2036
- By Country
- United States
- Canada
- By Product Type
- By Drive Technology
- By Mechanical Format
- By Optical Property
- By End Use
- By Country
- Market Attractiveness Analysis
- By Country
- By Product Type
- By Drive Technology
- By Mechanical Format
- By Optical Property
- By End Use
- Key Takeaways
- Latin America Market Analysis and Forecast, By Country
- Historical Market Size Value (USD Billion) Trend Analysis By Market Taxonomy, 2021 to 2025
- Market Size Value (USD Billion) Forecast By Market Taxonomy, 2026 to 2036
- By Country
- Brazil
- Mexico
- Argentina
- Chile
- By Product Type
- By Drive Technology
- By Mechanical Format
- By Optical Property
- By End Use
- By Country
- Market Attractiveness Analysis
- By Country
- By Product Type
- By Drive Technology
- By Mechanical Format
- By Optical Property
- By End Use
- Key Takeaways
- Western Europe Market Analysis and Forecast, By Country
- Historical Market Size Value (USD Billion) Trend Analysis By Market Taxonomy, 2021 to 2025
- Market Size Value (USD Billion) Forecast By Market Taxonomy, 2026 to 2036
- By Country
- Germany
- France
- United Kingdom
- Italy
- Spain
- Benelux
- Nordics
- By Product Type
- By Drive Technology
- By Mechanical Format
- By Optical Property
- By End Use
- By Country
- Market Attractiveness Analysis
- By Country
- By Product Type
- By Drive Technology
- By Mechanical Format
- By Optical Property
- By End Use
- Key Takeaways
- Eastern Europe Market Analysis and Forecast, By Country
- Historical Market Size Value (USD Billion) Trend Analysis By Market Taxonomy, 2021 to 2025
- Market Size Value (USD Billion) Forecast By Market Taxonomy, 2026 to 2036
- By Country
- Poland
- Czech Republic
- Romania
- Hungary
- By Product Type
- By Drive Technology
- By Mechanical Format
- By Optical Property
- By End Use
- By Country
- Market Attractiveness Analysis
- By Country
- By Product Type
- By Drive Technology
- By Mechanical Format
- By Optical Property
- By End Use
- Key Takeaways
- East Asia Market Analysis and Forecast, By Country
- Historical Market Size Value (USD Billion) Trend Analysis By Market Taxonomy, 2021 to 2025
- Market Size Value (USD Billion) Forecast By Market Taxonomy, 2026 to 2036
- By Country
- China
- Japan
- South Korea
- Taiwan
- By Product Type
- By Drive Technology
- By Mechanical Format
- By Optical Property
- By End Use
- By Country
- Market Attractiveness Analysis
- By Country
- By Product Type
- By Drive Technology
- By Mechanical Format
- By Optical Property
- By End Use
- Key Takeaways
- South Asia and Pacific Market Analysis and Forecast, By Country
- Historical Market Size Value (USD Billion) Trend Analysis By Market Taxonomy, 2021 to 2025
- Market Size Value (USD Billion) Forecast By Market Taxonomy, 2026 to 2036
- By Country
- India
- Singapore
- Other ASEAN countries
- Australia and New Zealand
- By Product Type
- By Drive Technology
- By Mechanical Format
- By Optical Property
- By End Use
- By Country
- Market Attractiveness Analysis
- By Country
- By Product Type
- By Drive Technology
- By Mechanical Format
- By Optical Property
- By End Use
- Key Takeaways
- Middle East and Africa Market Analysis and Forecast, By Country
- Historical Market Size Value (USD Billion) Trend Analysis By Market Taxonomy, 2021 to 2025
- Market Size Value (USD Billion) Forecast By Market Taxonomy, 2026 to 2036
- By Country
- GCC Countries
- South Africa
- Türkiye
- Israel
- By Product Type
- By Drive Technology
- By Mechanical Format
- By Optical Property
- By End Use
- By Country
- Market Attractiveness Analysis
- By Country
- By Product Type
- By Drive Technology
- By Mechanical Format
- By Optical Property
- By End Use
- Key Takeaways
- Key Countries Market Analysis
- United States
- Pricing Analysis
- Market Share Analysis, 2025
- By Product Type
- By Drive Technology
- By Mechanical Format
- By Optical Property
- By End Use
- Canada
- Pricing Analysis
- Market Share Analysis, 2025
- By Product Type
- By Drive Technology
- By Mechanical Format
- By Optical Property
- By End Use
- Mexico
- Pricing Analysis
- Market Share Analysis, 2025
- By Product Type
- By Drive Technology
- By Mechanical Format
- By Optical Property
- By End Use
- Brazil
- Pricing Analysis
- Market Share Analysis, 2025
- By Product Type
- By Drive Technology
- By Mechanical Format
- By Optical Property
- By End Use
- Chile
- Pricing Analysis
- Market Share Analysis, 2025
- By Product Type
- By Drive Technology
- By Mechanical Format
- By Optical Property
- By End Use
- Germany
- Pricing Analysis
- Market Share Analysis, 2025
- By Product Type
- By Drive Technology
- By Mechanical Format
- By Optical Property
- By End Use
- United Kingdom
- Pricing Analysis
- Market Share Analysis, 2025
- By Product Type
- By Drive Technology
- By Mechanical Format
- By Optical Property
- By End Use
- Italy
- Pricing Analysis
- Market Share Analysis, 2025
- By Product Type
- By Drive Technology
- By Mechanical Format
- By Optical Property
- By End Use
- Spain
- Pricing Analysis
- Market Share Analysis, 2025
- By Product Type
- By Drive Technology
- By Mechanical Format
- By Optical Property
- By End Use
- France
- Pricing Analysis
- Market Share Analysis, 2025
- By Product Type
- By Drive Technology
- By Mechanical Format
- By Optical Property
- By End Use
- India
- Pricing Analysis
- Market Share Analysis, 2025
- By Product Type
- By Drive Technology
- By Mechanical Format
- By Optical Property
- By End Use
- Australia and New Zealand
- Pricing Analysis
- Market Share Analysis, 2025
- By Product Type
- By Drive Technology
- By Mechanical Format
- By Optical Property
- By End Use
- China
- Pricing Analysis
- Market Share Analysis, 2025
- By Product Type
- By Drive Technology
- By Mechanical Format
- By Optical Property
- By End Use
- Japan
- Pricing Analysis
- Market Share Analysis, 2025
- By Product Type
- By Drive Technology
- By Mechanical Format
- By Optical Property
- By End Use
- South Korea
- Pricing Analysis
- Market Share Analysis, 2025
- By Product Type
- By Drive Technology
- By Mechanical Format
- By Optical Property
- By End Use
- Poland
- Pricing Analysis
- Market Share Analysis, 2025
- By Product Type
- By Drive Technology
- By Mechanical Format
- By Optical Property
- By End Use
- Hungary
- Pricing Analysis
- Market Share Analysis, 2025
- By Product Type
- By Drive Technology
- By Mechanical Format
- By Optical Property
- By End Use
- Türkiye
- Pricing Analysis
- Market Share Analysis, 2025
- By Product Type
- By Drive Technology
- By Mechanical Format
- By Optical Property
- By End Use
- South Africa
- Pricing Analysis
- Market Share Analysis, 2025
- By Product Type
- By Drive Technology
- By Mechanical Format
- By Optical Property
- By End Use
- United States
- Market Structure Analysis
- Competition Dashboard
- Competition Benchmarking
- Market Share Analysis of Top Players
- By Regional
- By Product Type
- By Drive Technology
- By Mechanical Format
- By Optical Property
- By End Use
- Emerging Startups
- Innovation Benchmarking
- Competition Analysis
- Competition Deep Dive
- Samsung Display
- Overview
- Product Portfolio
- Profitability by Market Segments
- Sales Footprint
- Strategy Overview
- Marketing Strategy
- Product Strategy
- Channel Strategy
- LG Display
- BOE
- AUO
- Samsung Display
- Case Studies
- Success Stories
- Recent Developments
- Competition Deep Dive
- Assumptions & Acronyms Used
List of Tables
- Table 1: Global Market Value (USD Billion) Forecast by Region, 2021 to 2036
- Table 2: Global Market Value (USD Billion) Forecast by Product Type, 2021 to 2036
- Table 3: Global Market Value (USD Billion) Forecast by Drive Technology, 2021 to 2036
- Table 4: Global Market Value (USD Billion) Forecast by Mechanical Format, 2021 to 2036
- Table 5: Global Market Value (USD Billion) Forecast by Optical Property, 2021 to 2036
- Table 6: Global Market Value (USD Billion) Forecast by End Use, 2021 to 2036
- Table 7: North America Market Value (USD Billion) Forecast by Country, 2021 to 2036
- Table 8: North America Market Value (USD Billion) Forecast by Product Type, 2021 to 2036
- Table 9: North America Market Value (USD Billion) Forecast by Drive Technology, 2021 to 2036
- Table 10: North America Market Value (USD Billion) Forecast by Mechanical Format, 2021 to 2036
- Table 11: North America Market Value (USD Billion) Forecast by Optical Property, 2021 to 2036
- Table 12: North America Market Value (USD Billion) Forecast by End Use, 2021 to 2036
- Table 13: Latin America Market Value (USD Billion) Forecast by Country, 2021 to 2036
- Table 14: Latin America Market Value (USD Billion) Forecast by Product Type, 2021 to 2036
- Table 15: Latin America Market Value (USD Billion) Forecast by Drive Technology, 2021 to 2036
- Table 16: Latin America Market Value (USD Billion) Forecast by Mechanical Format, 2021 to 2036
- Table 17: Latin America Market Value (USD Billion) Forecast by Optical Property, 2021 to 2036
- Table 18: Latin America Market Value (USD Billion) Forecast by End Use, 2021 to 2036
- Table 19: Western Europe Market Value (USD Billion) Forecast by Country, 2021 to 2036
- Table 20: Western Europe Market Value (USD Billion) Forecast by Product Type, 2021 to 2036
- Table 21: Western Europe Market Value (USD Billion) Forecast by Drive Technology, 2021 to 2036
- Table 22: Western Europe Market Value (USD Billion) Forecast by Mechanical Format, 2021 to 2036
- Table 23: Western Europe Market Value (USD Billion) Forecast by Optical Property, 2021 to 2036
- Table 24: Western Europe Market Value (USD Billion) Forecast by End Use, 2021 to 2036
- Table 25: Eastern Europe Market Value (USD Billion) Forecast by Country, 2021 to 2036
- Table 26: Eastern Europe Market Value (USD Billion) Forecast by Product Type, 2021 to 2036
- Table 27: Eastern Europe Market Value (USD Billion) Forecast by Drive Technology, 2021 to 2036
- Table 28: Eastern Europe Market Value (USD Billion) Forecast by Mechanical Format, 2021 to 2036
- Table 29: Eastern Europe Market Value (USD Billion) Forecast by Optical Property, 2021 to 2036
- Table 30: Eastern Europe Market Value (USD Billion) Forecast by End Use, 2021 to 2036
- Table 31: East Asia Market Value (USD Billion) Forecast by Country, 2021 to 2036
- Table 32: East Asia Market Value (USD Billion) Forecast by Product Type, 2021 to 2036
- Table 33: East Asia Market Value (USD Billion) Forecast by Drive Technology, 2021 to 2036
- Table 34: East Asia Market Value (USD Billion) Forecast by Mechanical Format, 2021 to 2036
- Table 35: East Asia Market Value (USD Billion) Forecast by Optical Property, 2021 to 2036
- Table 36: East Asia Market Value (USD Billion) Forecast by End Use, 2021 to 2036
- Table 37: South Asia and Pacific Market Value (USD Billion) Forecast by Country, 2021 to 2036
- Table 38: South Asia and Pacific Market Value (USD Billion) Forecast by Product Type, 2021 to 2036
- Table 39: South Asia and Pacific Market Value (USD Billion) Forecast by Drive Technology, 2021 to 2036
- Table 40: South Asia and Pacific Market Value (USD Billion) Forecast by Mechanical Format, 2021 to 2036
- Table 41: South Asia and Pacific Market Value (USD Billion) Forecast by Optical Property, 2021 to 2036
- Table 42: South Asia and Pacific Market Value (USD Billion) Forecast by End Use, 2021 to 2036
- Table 43: Middle East and Africa Market Value (USD Billion) Forecast by Country, 2021 to 2036
- Table 44: Middle East and Africa Market Value (USD Billion) Forecast by Product Type, 2021 to 2036
- Table 45: Middle East and Africa Market Value (USD Billion) Forecast by Drive Technology, 2021 to 2036
- Table 46: Middle East and Africa Market Value (USD Billion) Forecast by Mechanical Format, 2021 to 2036
- Table 47: Middle East and Africa Market Value (USD Billion) Forecast by Optical Property, 2021 to 2036
- Table 48: Middle East and Africa Market Value (USD Billion) Forecast by End Use, 2021 to 2036
List of Figures
- Figure 1: Global Market Pricing Analysis
- Figure 2: Global Market Value (USD Billion) Forecast 2021-2036
- Figure 3: Global Market Value Share and BPS Analysis by Product Type, 2026 and 2036
- Figure 4: Global Market Y-o-Y Growth Comparison by Product Type, 2026-2036
- Figure 5: Global Market Attractiveness Analysis by Product Type
- Figure 6: Global Market Value Share and BPS Analysis by Drive Technology, 2026 and 2036
- Figure 7: Global Market Y-o-Y Growth Comparison by Drive Technology, 2026-2036
- Figure 8: Global Market Attractiveness Analysis by Drive Technology
- Figure 9: Global Market Value Share and BPS Analysis by Mechanical Format, 2026 and 2036
- Figure 10: Global Market Y-o-Y Growth Comparison by Mechanical Format, 2026-2036
- Figure 11: Global Market Attractiveness Analysis by Mechanical Format
- Figure 12: Global Market Value Share and BPS Analysis by Optical Property, 2026 and 2036
- Figure 13: Global Market Y-o-Y Growth Comparison by Optical Property, 2026-2036
- Figure 14: Global Market Attractiveness Analysis by Optical Property
- Figure 15: Global Market Value Share and BPS Analysis by End Use, 2026 and 2036
- Figure 16: Global Market Y-o-Y Growth Comparison by End Use, 2026-2036
- Figure 17: Global Market Attractiveness Analysis by End Use
- Figure 18: Global Market Value (USD Billion) Share and BPS Analysis by Region, 2026 and 2036
- Figure 19: Global Market Y-o-Y Growth Comparison by Region, 2026-2036
- Figure 20: Global Market Attractiveness Analysis by Region
- Figure 21: North America Market Incremental Dollar Opportunity, 2026-2036
- Figure 22: Latin America Market Incremental Dollar Opportunity, 2026-2036
- Figure 23: Western Europe Market Incremental Dollar Opportunity, 2026-2036
- Figure 24: Eastern Europe Market Incremental Dollar Opportunity, 2026-2036
- Figure 25: East Asia Market Incremental Dollar Opportunity, 2026-2036
- Figure 26: South Asia and Pacific Market Incremental Dollar Opportunity, 2026-2036
- Figure 27: Middle East and Africa Market Incremental Dollar Opportunity, 2026-2036
- Figure 28: North America Market Value Share and BPS Analysis by Country, 2026 and 2036
- Figure 29: North America Market Value Share and BPS Analysis by Product Type, 2026 and 2036
- Figure 30: North America Market Y-o-Y Growth Comparison by Product Type, 2026-2036
- Figure 31: North America Market Attractiveness Analysis by Product Type
- Figure 32: North America Market Value Share and BPS Analysis by Drive Technology, 2026 and 2036
- Figure 33: North America Market Y-o-Y Growth Comparison by Drive Technology, 2026-2036
- Figure 34: North America Market Attractiveness Analysis by Drive Technology
- Figure 35: North America Market Value Share and BPS Analysis by Mechanical Format, 2026 and 2036
- Figure 36: North America Market Y-o-Y Growth Comparison by Mechanical Format, 2026-2036
- Figure 37: North America Market Attractiveness Analysis by Mechanical Format
- Figure 38: North America Market Value Share and BPS Analysis by Optical Property, 2026 and 2036
- Figure 39: North America Market Y-o-Y Growth Comparison by Optical Property, 2026-2036
- Figure 40: North America Market Attractiveness Analysis by Optical Property
- Figure 41: North America Market Value Share and BPS Analysis by End Use, 2026 and 2036
- Figure 42: North America Market Y-o-Y Growth Comparison by End Use, 2026-2036
- Figure 43: North America Market Attractiveness Analysis by End Use
- Figure 44: Latin America Market Value Share and BPS Analysis by Country, 2026 and 2036
- Figure 45: Latin America Market Value Share and BPS Analysis by Product Type, 2026 and 2036
- Figure 46: Latin America Market Y-o-Y Growth Comparison by Product Type, 2026-2036
- Figure 47: Latin America Market Attractiveness Analysis by Product Type
- Figure 48: Latin America Market Value Share and BPS Analysis by Drive Technology, 2026 and 2036
- Figure 49: Latin America Market Y-o-Y Growth Comparison by Drive Technology, 2026-2036
- Figure 50: Latin America Market Attractiveness Analysis by Drive Technology
- Figure 51: Latin America Market Value Share and BPS Analysis by Mechanical Format, 2026 and 2036
- Figure 52: Latin America Market Y-o-Y Growth Comparison by Mechanical Format, 2026-2036
- Figure 53: Latin America Market Attractiveness Analysis by Mechanical Format
- Figure 54: Latin America Market Value Share and BPS Analysis by Optical Property, 2026 and 2036
- Figure 55: Latin America Market Y-o-Y Growth Comparison by Optical Property, 2026-2036
- Figure 56: Latin America Market Attractiveness Analysis by Optical Property
- Figure 57: Latin America Market Value Share and BPS Analysis by End Use, 2026 and 2036
- Figure 58: Latin America Market Y-o-Y Growth Comparison by End Use, 2026-2036
- Figure 59: Latin America Market Attractiveness Analysis by End Use
- Figure 60: Western Europe Market Value Share and BPS Analysis by Country, 2026 and 2036
- Figure 61: Western Europe Market Value Share and BPS Analysis by Product Type, 2026 and 2036
- Figure 62: Western Europe Market Y-o-Y Growth Comparison by Product Type, 2026-2036
- Figure 63: Western Europe Market Attractiveness Analysis by Product Type
- Figure 64: Western Europe Market Value Share and BPS Analysis by Drive Technology, 2026 and 2036
- Figure 65: Western Europe Market Y-o-Y Growth Comparison by Drive Technology, 2026-2036
- Figure 66: Western Europe Market Attractiveness Analysis by Drive Technology
- Figure 67: Western Europe Market Value Share and BPS Analysis by Mechanical Format, 2026 and 2036
- Figure 68: Western Europe Market Y-o-Y Growth Comparison by Mechanical Format, 2026-2036
- Figure 69: Western Europe Market Attractiveness Analysis by Mechanical Format
- Figure 70: Western Europe Market Value Share and BPS Analysis by Optical Property, 2026 and 2036
- Figure 71: Western Europe Market Y-o-Y Growth Comparison by Optical Property, 2026-2036
- Figure 72: Western Europe Market Attractiveness Analysis by Optical Property
- Figure 73: Western Europe Market Value Share and BPS Analysis by End Use, 2026 and 2036
- Figure 74: Western Europe Market Y-o-Y Growth Comparison by End Use, 2026-2036
- Figure 75: Western Europe Market Attractiveness Analysis by End Use
- Figure 76: Eastern Europe Market Value Share and BPS Analysis by Country, 2026 and 2036
- Figure 77: Eastern Europe Market Value Share and BPS Analysis by Product Type, 2026 and 2036
- Figure 78: Eastern Europe Market Y-o-Y Growth Comparison by Product Type, 2026-2036
- Figure 79: Eastern Europe Market Attractiveness Analysis by Product Type
- Figure 80: Eastern Europe Market Value Share and BPS Analysis by Drive Technology, 2026 and 2036
- Figure 81: Eastern Europe Market Y-o-Y Growth Comparison by Drive Technology, 2026-2036
- Figure 82: Eastern Europe Market Attractiveness Analysis by Drive Technology
- Figure 83: Eastern Europe Market Value Share and BPS Analysis by Mechanical Format, 2026 and 2036
- Figure 84: Eastern Europe Market Y-o-Y Growth Comparison by Mechanical Format, 2026-2036
- Figure 85: Eastern Europe Market Attractiveness Analysis by Mechanical Format
- Figure 86: Eastern Europe Market Value Share and BPS Analysis by Optical Property, 2026 and 2036
- Figure 87: Eastern Europe Market Y-o-Y Growth Comparison by Optical Property, 2026-2036
- Figure 88: Eastern Europe Market Attractiveness Analysis by Optical Property
- Figure 89: Eastern Europe Market Value Share and BPS Analysis by End Use, 2026 and 2036
- Figure 90: Eastern Europe Market Y-o-Y Growth Comparison by End Use, 2026-2036
- Figure 91: Eastern Europe Market Attractiveness Analysis by End Use
- Figure 92: East Asia Market Value Share and BPS Analysis by Country, 2026 and 2036
- Figure 93: East Asia Market Value Share and BPS Analysis by Product Type, 2026 and 2036
- Figure 94: East Asia Market Y-o-Y Growth Comparison by Product Type, 2026-2036
- Figure 95: East Asia Market Attractiveness Analysis by Product Type
- Figure 96: East Asia Market Value Share and BPS Analysis by Drive Technology, 2026 and 2036
- Figure 97: East Asia Market Y-o-Y Growth Comparison by Drive Technology, 2026-2036
- Figure 98: East Asia Market Attractiveness Analysis by Drive Technology
- Figure 99: East Asia Market Value Share and BPS Analysis by Mechanical Format, 2026 and 2036
- Figure 100: East Asia Market Y-o-Y Growth Comparison by Mechanical Format, 2026-2036
- Figure 101: East Asia Market Attractiveness Analysis by Mechanical Format
- Figure 102: East Asia Market Value Share and BPS Analysis by Optical Property, 2026 and 2036
- Figure 103: East Asia Market Y-o-Y Growth Comparison by Optical Property, 2026-2036
- Figure 104: East Asia Market Attractiveness Analysis by Optical Property
- Figure 105: East Asia Market Value Share and BPS Analysis by End Use, 2026 and 2036
- Figure 106: East Asia Market Y-o-Y Growth Comparison by End Use, 2026-2036
- Figure 107: East Asia Market Attractiveness Analysis by End Use
- Figure 108: South Asia and Pacific Market Value Share and BPS Analysis by Country, 2026 and 2036
- Figure 109: South Asia and Pacific Market Value Share and BPS Analysis by Product Type, 2026 and 2036
- Figure 110: South Asia and Pacific Market Y-o-Y Growth Comparison by Product Type, 2026-2036
- Figure 111: South Asia and Pacific Market Attractiveness Analysis by Product Type
- Figure 112: South Asia and Pacific Market Value Share and BPS Analysis by Drive Technology, 2026 and 2036
- Figure 113: South Asia and Pacific Market Y-o-Y Growth Comparison by Drive Technology, 2026-2036
- Figure 114: South Asia and Pacific Market Attractiveness Analysis by Drive Technology
- Figure 115: South Asia and Pacific Market Value Share and BPS Analysis by Mechanical Format, 2026 and 2036
- Figure 116: South Asia and Pacific Market Y-o-Y Growth Comparison by Mechanical Format, 2026-2036
- Figure 117: South Asia and Pacific Market Attractiveness Analysis by Mechanical Format
- Figure 118: South Asia and Pacific Market Value Share and BPS Analysis by Optical Property, 2026 and 2036
- Figure 119: South Asia and Pacific Market Y-o-Y Growth Comparison by Optical Property, 2026-2036
- Figure 120: South Asia and Pacific Market Attractiveness Analysis by Optical Property
- Figure 121: South Asia and Pacific Market Value Share and BPS Analysis by End Use, 2026 and 2036
- Figure 122: South Asia and Pacific Market Y-o-Y Growth Comparison by End Use, 2026-2036
- Figure 123: South Asia and Pacific Market Attractiveness Analysis by End Use
- Figure 124: Middle East and Africa Market Value Share and BPS Analysis by Country, 2026 and 2036
- Figure 125: Middle East and Africa Market Value Share and BPS Analysis by Product Type, 2026 and 2036
- Figure 126: Middle East and Africa Market Y-o-Y Growth Comparison by Product Type, 2026-2036
- Figure 127: Middle East and Africa Market Attractiveness Analysis by Product Type
- Figure 128: Middle East and Africa Market Value Share and BPS Analysis by Drive Technology, 2026 and 2036
- Figure 129: Middle East and Africa Market Y-o-Y Growth Comparison by Drive Technology, 2026-2036
- Figure 130: Middle East and Africa Market Attractiveness Analysis by Drive Technology
- Figure 131: Middle East and Africa Market Value Share and BPS Analysis by Mechanical Format, 2026 and 2036
- Figure 132: Middle East and Africa Market Y-o-Y Growth Comparison by Mechanical Format, 2026-2036
- Figure 133: Middle East and Africa Market Attractiveness Analysis by Mechanical Format
- Figure 134: Middle East and Africa Market Value Share and BPS Analysis by Optical Property, 2026 and 2036
- Figure 135: Middle East and Africa Market Y-o-Y Growth Comparison by Optical Property, 2026-2036
- Figure 136: Middle East and Africa Market Attractiveness Analysis by Optical Property
- Figure 137: Middle East and Africa Market Value Share and BPS Analysis by End Use, 2026 and 2036
- Figure 138: Middle East and Africa Market Y-o-Y Growth Comparison by End Use, 2026-2036
- Figure 139: Middle East and Africa Market Attractiveness Analysis by End Use
- Figure 140: Global Market - Tier Structure Analysis
- Figure 141: Global Market - Company Share Analysis
Frequently Asked Questions
What is the forecast for the OLED Market?
FMI values the market at USD 65.7 billion in 2025 and USD 74.70 billion in 2026, with USD 269.58 billion forecast by 2036 and a 13.7% CAGR from 2026 to 2036.
Which product type leads the OLED Market?
The display segment leads by product type with 82.6% of the 2026 market in FMI's assessment.
Which drive technology and end use lead?
AMOLED accounts for 67.3% by drive technology and the consumer electronics segment for 76.4% by end use in FMI's 2026 assessment.
Which profiled country has the highest forecast growth?
China leads the profiled countries with an 18.5% FMI forecast CAGR from 2026 to 2036, followed by India at 17.1%.
Does India's approved Dholera display project establish OLED capacity?
The May 2026 Cabinet announcement concerns a GaN-based Mini/Micro-LED facility. It does not establish approval of an OLED plant. [6]
Preview the report firsthand - request a free sample
Get SampleGet the brochure for pricing and purchase details.
Get PDF
