Open Radio Access Network Market Size and Share Forecast Outlook From 2024 to 2034

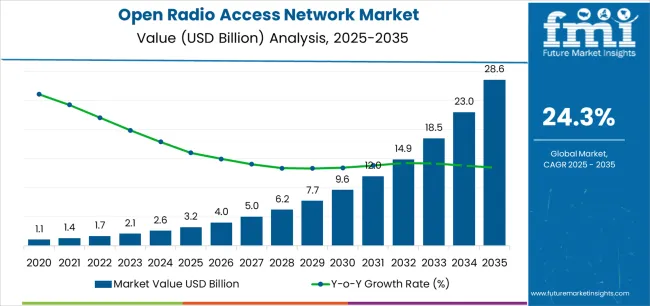
The open radio access network market is expected to grow at a CAGR of 70.7% during the projected period. The market value is projected to increase from USD 1.9 billion in 2024 to USD 401 billion by 2034.

Attributes Details
Open Radio Access Network Market Size, 2024 USD 1.9 billion
Projected Market Size, 2034 USD 401 billion
Value-based CAGR (2024 to 2034) 70.7%

Open Radio Access Network Market Overview

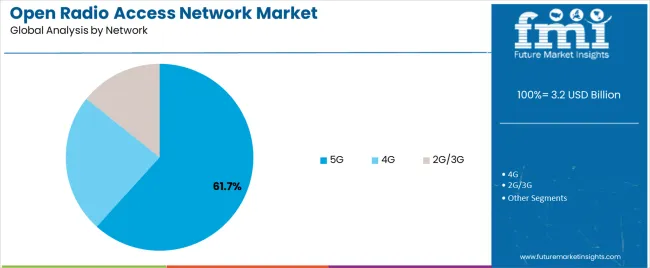
  • Increased demand for 5G networks. With the advent of 5G technology, the need for more efficient and flexible radio access solutions has become more pressing.
  • Rising demand for virtualization and cloud-based solutions. O-RAN technology is inherently cloud-native and can be easily integrated into existing cloud infrastructure.
  • Increasing adoption of Software-Defined Networking (SDN) and Network Functions Virtualization (NFV).
  • Growing demand for disaggregated network solutions.
  • O-RAN offers a more open approach, with different vendors providing components that can be easily integrated into a single network infrastructure which opens up the market to more competition and innovation, which ultimately benefits end-users.

Key Opportunities in the Open Radio Access Network Market

  • Greater flexibility and scalability of the business help in the growth of the demand for open radio access networks.
  • Operators can easily add or remove components from their networks as needed, which makes it easier to adapt to changing market conditions.
  • O-RAN works without being locked into a single vendor's ecosystem, which can quickly adopt new features and services that their customers demand. This gives them a competitive advantage.
  • The ability to reduce costs is expected to create lucrative market opportunities.
  • Open RAN provides cost savings for small and mid-size operators by allowing them to use commodity hardware and software from multiple vendors.
  • Open RAN presents a significant market opportunity by enabling operators to build networks in previously uneconomical areas, thus bridging the digital divide and promoting economic growth and social development in underserved communities.
  • Open RAN can enable new business models in the telecom industry. By allowing operators to mix and match components from multiple vendors, it creates a more competitive market that encourages innovation and reduces vendor lock-in.
  • The growth in the collaboration between operators and vendors helps drive the industry forward and create new revenue streams.

Challenges for the Open Radio Access Network Market

  • Greater flexibility and scalability of the business help in the growth of the demand for open radio access networks.
  • Operators can easily add or remove components from their networks as needed, which makes it easier to adapt to changing market conditions.
  • O-RAN works without being locked into a single vendor's ecosystem, which can quickly adopt new features and services that their customers demand. This gives them a competitive advantage.
  • The ability to reduce costs is expected to create lucrative market opportunities.
  • Open RAN provides cost savings for small and mid-size operators by allowing them to use commodity hardware and software from multiple vendors.
  • Open RAN presents a significant market opportunity by enabling operators to build networks in previously uneconomical areas, thus bridging the digital divide and promoting economic growth and social development in underserved communities.
  • Open RAN can enable new business models in the telecom industry. By allowing operators to mix and match components from multiple vendors, it creates a more competitive market that encourages innovation and reduces vendor lock-in.
  • The growth in the collaboration between operators and vendors helps drive the industry forward and create new revenue streams.
  • The lack of standardization leads to interoperability issues and creates complexities for network operators in integrating different components from different vendors.
  • The unavailability of a skilled workforce is expected to hamper the market growth during the forecast period.
  • The shortage of skilled workforce can slow down the adoption of open RAN solutions, especially in emerging markets.
  • The cost of deploying open RAN solutions can be higher than traditional proprietary solutions.
  • The high cost is anticipated to hinder market growth in the coming years.
  • Security concerns are also a major challenge in the open RAN market.
  • The use of open-source software can expose the network to vulnerabilities and cyberattacks and can compromise the network's integrity and confidentiality.
  • The open RAN market is still in its nascent stage, and there is a lack of a mature ecosystem that can support the deployment and maintenance of open RAN solutions.
  • While the open RAN market has the potential to transform the telecom industry, it faces several challenges that need to be addressed.
  • Standardization, availability of skilled workforce, cost, security concerns, and lack of a mature ecosystem are some of the key challenges that the market needs to overcome to ensure its growth and adoption.

Analysis of Top Countries Engaged in Manufacturing, Distributing, and Utilizing Open Radio Access Network Solutions

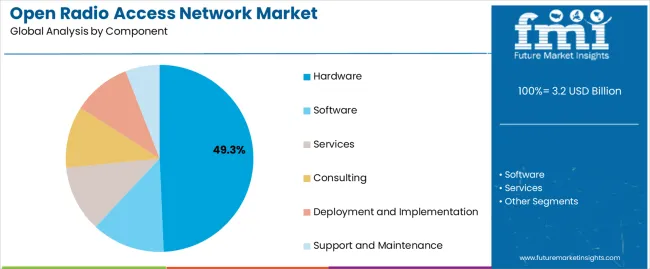
In terms of Component, the Hardware Segment Leads the Market Growth

Attributes Details
Top Component Hardware
CAGR from 2024 to 2034 70.5%
  • Without hardware such as base stations, antennas, and other radio frequency components, it would be impossible to connect devices to the Internet.
  • Therefore, the hardware segment plays a crucial role in the open radio access network market.
  • Established players in the hardware market have a significant advantage over new entrants.
  • These players have years of experience in the industry, established distribution networks, and economies of scale.
  • Hardware companies are investing heavily in research and development to stay ahead of the competition.
  • They are creating innovative products that are more energy-efficient and cost-effective.
  • These efforts have enabled them to reduce costs and offer competitive pricing to customers, which has further reinforced their dominance in the market.

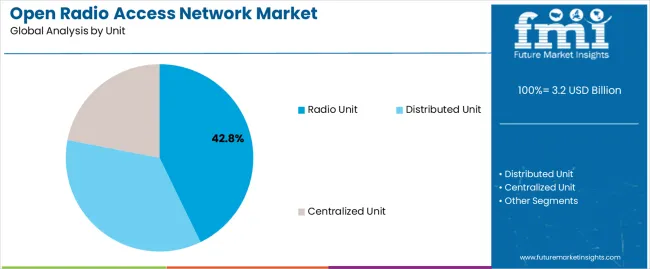
In terms of Unit, the Radio Unit Segment is dominating the Market

Attributes Details
Top Unit Radio Unit
CAGR from 2024 to 2034 70.3%
  • As the demand for more flexible, cost-effective wireless networks continues to grow, the radio unit segment is well-positioned to meet these needs.
  • Its ability to mix and match basebands from different vendors provides a diverse and competitive wireless network solution.
  • The adoption of cloud-based RAN solutions further strengthens the segment's position in the market, allowing for more efficient and cost-effective network deployment.
  • The RU segment's crucial role in delivering the high data rates and low latency required for 5G networks maintains its dominance in the open RAN market.

Open Radio Access Network Industry Analysis by Top Investment Segments

Countries CAGR (2024 to 2034)
United States 70.9%
United Kingdom 71.8%
China 71.7%
Japan 72.5%
South Korea 73.4%

Growing Need for a More Flexible and Cost-Effective 5G Network Infrastructure in the United States

  • The demand for the open radio access network (O-RAN) market in the United States is increasing due to the growing need for a more flexible and cost-effective 5G network infrastructure.
  • O-RAN technology enables operators to build networks using best-of-breed components from multiple vendors in the United States, instead of being locked into a single vendor's proprietary solution.
  • The United States government has identified the importance of O-RAN in enabling a secure and competitive 5G ecosystem.
  • For Instance, the Federal Communications Commission (FCC) has allocated over USD 1 billion in funds to promote the development and deployment of open and interoperable networks, including O-RAN.
  • The country has a highly competitive telecom market, and O-RAN is seen as a way for smaller operators to compete with larger players by offering more innovative and cost-effective services.

Need For a More Diverse Supplier Base in the United Kingdom

  • The United Kingdom is witnessing a growing demand for O-RAN technology, driven by the need for a more diverse supplier base and increased network flexibility.
  • The United Kingdom government has also recognized the importance of O-RAN in promoting competition and innovation and has allocated funds to support its development.

Growing Demand for Mobile Data Services in China

  • China is one of the largest and fastest-growing markets for O-RAN technology, driven by the government's push to develop a more robust and competitive telecom ecosystem.
  • The country's large population and growing demand for mobile data services have also created a need for more efficient and cost-effective network infrastructure.

Increasing Government Initiatives Toward Automation in Japan

  • Japan is another market that is witnessing a growing demand for O-RAN technology.
  • The country has a highly advanced telecom infrastructure, but it is dominated by a few large vendors, which has led to concerns over vendor lock-in and limited innovation.
  • The Japanese government has recognized the importance of O-RAN in promoting competition and innovation, and has allocated funds to support its development.
  • Major Japanese operators such as NTT DoCoMo and SoftBank have also announced plans to deploy O-RAN technology in their networks, to reduce costs and increase network agility.
  • The country's regulators have also been supportive of O-RAN, with the Ministry of Internal Affairs and Communications recently announcing plans to promote its adoption in Japan.
  • Growing need for efficient inventory management systems in the country.

Growing Industrial Sector in South Korea

  • South Korea is one of the most advanced markets for 5G technology, and the deployment of O-RAN technology is seen as a way to accelerate the development and deployment of 5G networks in the country.
  • Increasing demand for O-RAN technology in South Korea is driven by the need for more efficient and cost-effective network infrastructure, the growth of 5G technology, and the need to promote healthy competition and innovation in the telecom industry.

Competitive Landscape of the Open Radio Access Network Market

The market is expected to grow significantly in the coming years as more operators adopt O-RAN technology in their networks. The market is highly competitive, with several large vendors and a growing number of smaller players offering O-RAN solutions.

The market is expected to become even more competitive as more vendors are entering and existing vendors are expanding their offerings. Large vendors are expected to dominate the market due to their established relationships with operators and their ability to offer end-to-end solutions.

However, smaller vendors are also expected to gain market share as operators seek more innovative and cost-effective solutions. The key players in the market are offering a range of solutions, including virtualized radio access network (vRAN) solutions, hardware and software solutions, and cloud-based solutions.

Recent Development in the Open Radio Access Network Market:

In 2022, To enhance their 5G network capabilities, Nokia and AT&T have teamed up to create an RIC software platform. They have successfully conducted trials using external applications, known as 'xApps', at the edge of AT&T's live 5G mmWave network on an Open Cloud Platform.

Leading Companies in the Open Radio Access Network Market

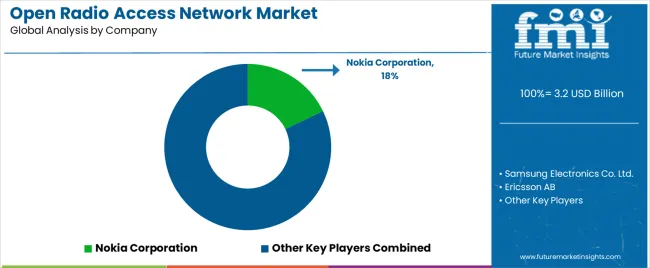
  • Nokia Corporation
  • Samsung Electronics Co. Ltd.
  • Ericsson AB
  • Huawei Technologies Co. Ltd.
  • NEC Corporation
  • Mavenir Systems Inc.
  • Parallel Wireless Inc.
  • ZTE Corporation
  • Fujitsu Ltd.
  • Radisys Corporation
  • ASOCS Ltd.
  • Comba Telecom Systems Holdings Ltd.
  • Altiostar Networks Inc.
  • Airspan Networks Inc.
  • Cisco Systems Inc.

Key Coverage in the Open Radio Access Network Market Report

  • RAN Market Landscape
  • 5G Radio Access Industry Assessment
  • Usage Analysis of ORAN Overview
  • Barcode Inventory Tags Pricing Outlook
  • Analysis of Key Vendors in the Radio Access Network Market

Top Segments Studied in the Open Radio Access Network Market

By Component:

  • Hardware
  • Software
  • Services
    • Consulting
    • Deployment and Implementation
    • Support and Maintenance

By Unit:

  • Radio Unit
  • Distributed Unit
  • Centralized Unit

By Network:

  • 2G/3G
  • 4G
  • 5G

By Frequency:

  • Sub-6 GHz
  • mmWave

By Region:

  • North America
  • Latin America
  • East Asia
  • South Asia
  • Europe
  • Oceania
  • MEA

Table of Content

  • 1. Executive Summary
  • 2. Market Overview
  • 3. Market Background
  • 4. Global Market Analysis 2019 to 2023 and Forecast, 2024 to 2034
  • 5. Global Market Analysis 2019 to 2023 and Forecast 2024 to 2034, By Component
    • 5.1. Hardware
    • 5.2. Software
    • 5.3. Services
      • 5.3.1. Consulting
      • 5.3.2. Deployment and Implementation
      • 5.3.3. Support and Maintenance
  • 6. Global Market Analysis 2019 to 2023 and Forecast 2024 to 2034, By Value
    • 6.1. Radio Value
    • 6.2. Distributed Value
    • 6.3. Centralized Value
  • 7. Global Market Analysis 2019 to 2023 and Forecast 2024 to 2034, By Deployment
    • 7.1. Private
    • 7.2. Hybrid Cloud
    • 7.3. Public Cloud
  • 8. Global Market Analysis 2019 to 2023 and Forecast 2024 to 2034, By Network
    • 8.1. 2G/3G
    • 8.2. 4G
    • 8.3. 5G
  • 9. Global Market Analysis 2019 to 2023 and Forecast 2024 to 2034, By Frequency
    • 9.1. Sub to 6 GHz
    • 9.2. mmWave
  • 10. Global Market Analysis 2019 to 2023 and Forecast 2024 to 2034, By Region
    • 10.1. North America
    • 10.2. Latin America
    • 10.3. Western Europe
    • 10.4. Eastern Europe
    • 10.5. South Asia and Pacific
    • 10.6. East Asia
    • 10.7. Middle East and Africa
  • 11. North America Market Analysis 2019 to 2023 and Forecast 2024 to 2034, By Country
  • 12. Latin America Market Analysis 2019 to 2023 and Forecast 2024 to 2034, By Country
  • 13. Western Europe Market Analysis 2019 to 2023 and Forecast 2024 to 2034, By Country
  • 14. Eastern Europe Market Analysis 2019 to 2023 and Forecast 2024 to 2034, By Country
  • 15. South Asia and Pacific Market Analysis 2019 to 2023 and Forecast 2024 to 2034, By Country
  • 16. East Asia Market Analysis 2019 to 2023 and Forecast 2024 to 2034, By Country
  • 17. Middle East and Africa Market Analysis 2019 to 2023 and Forecast 2024 to 2034, By Country
  • 18. Key Countries Market Analysis
  • 19. Market Structure Analysis
  • 20. Competition Analysis
    • 20.1. Mavenir
    • 20.2. NEC Corp.
    • 20.3. Fujitsu Limited
    • 20.4. Nokia Corporation
    • 20.5. Samsung Electronics Co., Ltd.
    • 20.6. Radisys Corporation
    • 20.7. Parallel Wireless
    • 20.8. ZTE Corporation
    • 20.9. AT&T Inc.
    • 20.10. Huawei Technologies Co., Ltd.
  • 21. Assumptions & Acronyms Used
  • 22. Research Methodology

List of Tables

Table 1: Global Market Value (US$ Million) Forecast by Region, 2019 to 2034

Table 2: Global Market Value (US$ Million) Forecast by Component, 2019 to 2034

Table 3: Global Market Value (US$ Million) Forecast by Unit, 2019 to 2034

Table 4: Global Market Value (US$ Million) Forecast by Deployment, 2019 to 2034

Table 5: Global Market Value (US$ Million) Forecast by Network, 2019 to 2034

Table 6: Global Market Value (US$ Million) Forecast by Frequency, 2019 to 2034

Table 7: North America Market Value (US$ Million) Forecast by Country, 2019 to 2034

Table 8: North America Market Value (US$ Million) Forecast by Component, 2019 to 2034

Table 9: North America Market Value (US$ Million) Forecast by Unit, 2019 to 2034

Table 10: North America Market Value (US$ Million) Forecast by Deployment, 2019 to 2034

Table 11: North America Market Value (US$ Million) Forecast by Network, 2019 to 2034

Table 12: North America Market Value (US$ Million) Forecast by Frequency, 2019 to 2034

Table 13: Latin America Market Value (US$ Million) Forecast by Country, 2019 to 2034

Table 14: Latin America Market Value (US$ Million) Forecast by Component, 2019 to 2034

Table 15: Latin America Market Value (US$ Million) Forecast by Unit, 2019 to 2034

Table 16: Latin America Market Value (US$ Million) Forecast by Deployment, 2019 to 2034

Table 17: Latin America Market Value (US$ Million) Forecast by Network, 2019 to 2034

Table 18: Latin America Market Value (US$ Million) Forecast by Frequency, 2019 to 2034

Table 19: Western Europe Market Value (US$ Million) Forecast by Country, 2019 to 2034

Table 20: Western Europe Market Value (US$ Million) Forecast by Component, 2019 to 2034

Table 21: Western Europe Market Value (US$ Million) Forecast by Unit, 2019 to 2034

Table 22: Western Europe Market Value (US$ Million) Forecast by Deployment, 2019 to 2034

Table 23: Western Europe Market Value (US$ Million) Forecast by Network, 2019 to 2034

Table 24: Western Europe Market Value (US$ Million) Forecast by Frequency, 2019 to 2034

Table 25: Eastern Europe Market Value (US$ Million) Forecast by Country, 2019 to 2034

Table 26: Eastern Europe Market Value (US$ Million) Forecast by Component, 2019 to 2034

Table 27: Eastern Europe Market Value (US$ Million) Forecast by Unit, 2019 to 2034

Table 28: Eastern Europe Market Value (US$ Million) Forecast by Deployment, 2019 to 2034

Table 29: Eastern Europe Market Value (US$ Million) Forecast by Network, 2019 to 2034

Table 30: Eastern Europe Market Value (US$ Million) Forecast by Frequency, 2019 to 2034

Table 31: South Asia and Pacific Market Value (US$ Million) Forecast by Country, 2019 to 2034

Table 32: South Asia and Pacific Market Value (US$ Million) Forecast by Component, 2019 to 2034

Table 33: South Asia and Pacific Market Value (US$ Million) Forecast by Unit, 2019 to 2034

Table 34: South Asia and Pacific Market Value (US$ Million) Forecast by Deployment, 2019 to 2034

Table 35: South Asia and Pacific Market Value (US$ Million) Forecast by Network, 2019 to 2034

Table 36: South Asia and Pacific Market Value (US$ Million) Forecast by Frequency, 2019 to 2034

Table 37: East Asia Market Value (US$ Million) Forecast by Country, 2019 to 2034

Table 38: East Asia Market Value (US$ Million) Forecast by Component, 2019 to 2034

Table 39: East Asia Market Value (US$ Million) Forecast by Unit, 2019 to 2034

Table 40: East Asia Market Value (US$ Million) Forecast by Deployment, 2019 to 2034

Table 41: East Asia Market Value (US$ Million) Forecast by Network, 2019 to 2034

Table 42: East Asia Market Value (US$ Million) Forecast by Frequency, 2019 to 2034

Table 43: Middle East and Africa Market Value (US$ Million) Forecast by Country, 2019 to 2034

Table 44: Middle East and Africa Market Value (US$ Million) Forecast by Component, 2019 to 2034

Table 45: Middle East and Africa Market Value (US$ Million) Forecast by Unit, 2019 to 2034

Table 46: Middle East and Africa Market Value (US$ Million) Forecast by Deployment, 2019 to 2034

Table 47: Middle East and Africa Market Value (US$ Million) Forecast by Network, 2019 to 2034

Table 48: Middle East and Africa Market Value (US$ Million) Forecast by Frequency, 2019 to 2034

List of Figures

Figure 1: Global Market Value (US$ Million) by Component, 2024 to 2034

Figure 2: Global Market Value (US$ Million) by Unit, 2024 to 2034

Figure 3: Global Market Value (US$ Million) by Deployment, 2024 to 2034

Figure 4: Global Market Value (US$ Million) by Network, 2024 to 2034

Figure 5: Global Market Value (US$ Million) by Frequency, 2024 to 2034

Figure 6: Global Market Value (US$ Million) by Region, 2024 to 2034

Figure 7: Global Market Value (US$ Million) Analysis by Region, 2019 to 2034

Figure 8: Global Market Value Share (%) and BPS Analysis by Region, 2024 to 2034

Figure 9: Global Market Y-o-Y Growth (%) Projections by Region, 2024 to 2034

Figure 10: Global Market Value (US$ Million) Analysis by Component, 2019 to 2034

Figure 11: Global Market Value Share (%) and BPS Analysis by Component, 2024 to 2034

Figure 12: Global Market Y-o-Y Growth (%) Projections by Component, 2024 to 2034

Figure 13: Global Market Value (US$ Million) Analysis by Unit, 2019 to 2034

Figure 14: Global Market Value Share (%) and BPS Analysis by Unit, 2024 to 2034

Figure 15: Global Market Y-o-Y Growth (%) Projections by Unit, 2024 to 2034

Figure 16: Global Market Value (US$ Million) Analysis by Deployment, 2019 to 2034

Figure 17: Global Market Value Share (%) and BPS Analysis by Deployment, 2024 to 2034

Figure 18: Global Market Y-o-Y Growth (%) Projections by Deployment, 2024 to 2034

Figure 19: Global Market Value (US$ Million) Analysis by Network, 2019 to 2034

Figure 20: Global Market Value Share (%) and BPS Analysis by Network, 2024 to 2034

Figure 21: Global Market Y-o-Y Growth (%) Projections by Network, 2024 to 2034

Figure 22: Global Market Value (US$ Million) Analysis by Frequency, 2019 to 2034

Figure 23: Global Market Value Share (%) and BPS Analysis by Frequency, 2024 to 2034

Figure 24: Global Market Y-o-Y Growth (%) Projections by Frequency, 2024 to 2034

Figure 25: Global Market Attractiveness by Component, 2024 to 2034

Figure 26: Global Market Attractiveness by Unit, 2024 to 2034

Figure 27: Global Market Attractiveness by Deployment, 2024 to 2034

Figure 28: Global Market Attractiveness by Network, 2024 to 2034

Figure 29: Global Market Attractiveness by Frequency, 2024 to 2034

Figure 30: Global Market Attractiveness by Region, 2024 to 2034

Figure 31: North America Market Value (US$ Million) by Component, 2024 to 2034

Figure 32: North America Market Value (US$ Million) by Unit, 2024 to 2034

Figure 33: North America Market Value (US$ Million) by Deployment, 2024 to 2034

Figure 34: North America Market Value (US$ Million) by Network, 2024 to 2034

Figure 35: North America Market Value (US$ Million) by Frequency, 2024 to 2034

Figure 36: North America Market Value (US$ Million) by Country, 2024 to 2034

Figure 37: North America Market Value (US$ Million) Analysis by Country, 2019 to 2034

Figure 38: North America Market Value Share (%) and BPS Analysis by Country, 2024 to 2034

Figure 39: North America Market Y-o-Y Growth (%) Projections by Country, 2024 to 2034

Figure 40: North America Market Value (US$ Million) Analysis by Component, 2019 to 2034

Figure 41: North America Market Value Share (%) and BPS Analysis by Component, 2024 to 2034

Figure 42: North America Market Y-o-Y Growth (%) Projections by Component, 2024 to 2034

Figure 43: North America Market Value (US$ Million) Analysis by Unit, 2019 to 2034

Figure 44: North America Market Value Share (%) and BPS Analysis by Unit, 2024 to 2034

Figure 45: North America Market Y-o-Y Growth (%) Projections by Unit, 2024 to 2034

Figure 46: North America Market Value (US$ Million) Analysis by Deployment, 2019 to 2034

Figure 47: North America Market Value Share (%) and BPS Analysis by Deployment, 2024 to 2034

Figure 48: North America Market Y-o-Y Growth (%) Projections by Deployment, 2024 to 2034

Figure 49: North America Market Value (US$ Million) Analysis by Network, 2019 to 2034

Figure 50: North America Market Value Share (%) and BPS Analysis by Network, 2024 to 2034

Figure 51: North America Market Y-o-Y Growth (%) Projections by Network, 2024 to 2034

Figure 52: North America Market Value (US$ Million) Analysis by Frequency, 2019 to 2034

Figure 53: North America Market Value Share (%) and BPS Analysis by Frequency, 2024 to 2034

Figure 54: North America Market Y-o-Y Growth (%) Projections by Frequency, 2024 to 2034

Figure 55: North America Market Attractiveness by Component, 2024 to 2034

Figure 56: North America Market Attractiveness by Unit, 2024 to 2034

Figure 57: North America Market Attractiveness by Deployment, 2024 to 2034

Figure 58: North America Market Attractiveness by Network, 2024 to 2034

Figure 59: North America Market Attractiveness by Frequency, 2024 to 2034

Figure 60: North America Market Attractiveness by Country, 2024 to 2034

Figure 61: Latin America Market Value (US$ Million) by Component, 2024 to 2034

Figure 62: Latin America Market Value (US$ Million) by Unit, 2024 to 2034

Figure 63: Latin America Market Value (US$ Million) by Deployment, 2024 to 2034

Figure 64: Latin America Market Value (US$ Million) by Network, 2024 to 2034

Figure 65: Latin America Market Value (US$ Million) by Frequency, 2024 to 2034

Figure 66: Latin America Market Value (US$ Million) by Country, 2024 to 2034

Figure 67: Latin America Market Value (US$ Million) Analysis by Country, 2019 to 2034

Figure 68: Latin America Market Value Share (%) and BPS Analysis by Country, 2024 to 2034

Figure 69: Latin America Market Y-o-Y Growth (%) Projections by Country, 2024 to 2034

Figure 70: Latin America Market Value (US$ Million) Analysis by Component, 2019 to 2034

Figure 71: Latin America Market Value Share (%) and BPS Analysis by Component, 2024 to 2034

Figure 72: Latin America Market Y-o-Y Growth (%) Projections by Component, 2024 to 2034

Figure 73: Latin America Market Value (US$ Million) Analysis by Unit, 2019 to 2034

Figure 74: Latin America Market Value Share (%) and BPS Analysis by Unit, 2024 to 2034

Figure 75: Latin America Market Y-o-Y Growth (%) Projections by Unit, 2024 to 2034

Figure 76: Latin America Market Value (US$ Million) Analysis by Deployment, 2019 to 2034

Figure 77: Latin America Market Value Share (%) and BPS Analysis by Deployment, 2024 to 2034

Figure 78: Latin America Market Y-o-Y Growth (%) Projections by Deployment, 2024 to 2034

Figure 79: Latin America Market Value (US$ Million) Analysis by Network, 2019 to 2034

Figure 80: Latin America Market Value Share (%) and BPS Analysis by Network, 2024 to 2034

Figure 81: Latin America Market Y-o-Y Growth (%) Projections by Network, 2024 to 2034

Figure 82: Latin America Market Value (US$ Million) Analysis by Frequency, 2019 to 2034

Figure 83: Latin America Market Value Share (%) and BPS Analysis by Frequency, 2024 to 2034

Figure 84: Latin America Market Y-o-Y Growth (%) Projections by Frequency, 2024 to 2034

Figure 85: Latin America Market Attractiveness by Component, 2024 to 2034

Figure 86: Latin America Market Attractiveness by Unit, 2024 to 2034

Figure 87: Latin America Market Attractiveness by Deployment, 2024 to 2034

Figure 88: Latin America Market Attractiveness by Network, 2024 to 2034

Figure 89: Latin America Market Attractiveness by Frequency, 2024 to 2034

Figure 90: Latin America Market Attractiveness by Country, 2024 to 2034

Figure 91: Western Europe Market Value (US$ Million) by Component, 2024 to 2034

Figure 92: Western Europe Market Value (US$ Million) by Unit, 2024 to 2034

Figure 93: Western Europe Market Value (US$ Million) by Deployment, 2024 to 2034

Figure 94: Western Europe Market Value (US$ Million) by Network, 2024 to 2034

Figure 95: Western Europe Market Value (US$ Million) by Frequency, 2024 to 2034

Figure 96: Western Europe Market Value (US$ Million) by Country, 2024 to 2034

Figure 97: Western Europe Market Value (US$ Million) Analysis by Country, 2019 to 2034

Figure 98: Western Europe Market Value Share (%) and BPS Analysis by Country, 2024 to 2034

Figure 99: Western Europe Market Y-o-Y Growth (%) Projections by Country, 2024 to 2034

Figure 100: Western Europe Market Value (US$ Million) Analysis by Component, 2019 to 2034

Figure 101: Western Europe Market Value Share (%) and BPS Analysis by Component, 2024 to 2034

Figure 102: Western Europe Market Y-o-Y Growth (%) Projections by Component, 2024 to 2034

Figure 103: Western Europe Market Value (US$ Million) Analysis by Unit, 2019 to 2034

Figure 104: Western Europe Market Value Share (%) and BPS Analysis by Unit, 2024 to 2034

Figure 105: Western Europe Market Y-o-Y Growth (%) Projections by Unit, 2024 to 2034

Figure 106: Western Europe Market Value (US$ Million) Analysis by Deployment, 2019 to 2034

Figure 107: Western Europe Market Value Share (%) and BPS Analysis by Deployment, 2024 to 2034

Figure 108: Western Europe Market Y-o-Y Growth (%) Projections by Deployment, 2024 to 2034

Figure 109: Western Europe Market Value (US$ Million) Analysis by Network, 2019 to 2034

Figure 110: Western Europe Market Value Share (%) and BPS Analysis by Network, 2024 to 2034

Figure 111: Western Europe Market Y-o-Y Growth (%) Projections by Network, 2024 to 2034

Figure 112: Western Europe Market Value (US$ Million) Analysis by Frequency, 2019 to 2034

Figure 113: Western Europe Market Value Share (%) and BPS Analysis by Frequency, 2024 to 2034

Figure 114: Western Europe Market Y-o-Y Growth (%) Projections by Frequency, 2024 to 2034

Figure 115: Western Europe Market Attractiveness by Component, 2024 to 2034

Figure 116: Western Europe Market Attractiveness by Unit, 2024 to 2034

Figure 117: Western Europe Market Attractiveness by Deployment, 2024 to 2034

Figure 118: Western Europe Market Attractiveness by Network, 2024 to 2034

Figure 119: Western Europe Market Attractiveness by Frequency, 2024 to 2034

Figure 120: Western Europe Market Attractiveness by Country, 2024 to 2034

Figure 121: Eastern Europe Market Value (US$ Million) by Component, 2024 to 2034

Figure 122: Eastern Europe Market Value (US$ Million) by Unit, 2024 to 2034

Figure 123: Eastern Europe Market Value (US$ Million) by Deployment, 2024 to 2034

Figure 124: Eastern Europe Market Value (US$ Million) by Network, 2024 to 2034

Figure 125: Eastern Europe Market Value (US$ Million) by Frequency, 2024 to 2034

Figure 126: Eastern Europe Market Value (US$ Million) by Country, 2024 to 2034

Figure 127: Eastern Europe Market Value (US$ Million) Analysis by Country, 2019 to 2034

Figure 128: Eastern Europe Market Value Share (%) and BPS Analysis by Country, 2024 to 2034

Figure 129: Eastern Europe Market Y-o-Y Growth (%) Projections by Country, 2024 to 2034

Figure 130: Eastern Europe Market Value (US$ Million) Analysis by Component, 2019 to 2034

Figure 131: Eastern Europe Market Value Share (%) and BPS Analysis by Component, 2024 to 2034

Figure 132: Eastern Europe Market Y-o-Y Growth (%) Projections by Component, 2024 to 2034

Figure 133: Eastern Europe Market Value (US$ Million) Analysis by Unit, 2019 to 2034

Figure 134: Eastern Europe Market Value Share (%) and BPS Analysis by Unit, 2024 to 2034

Figure 135: Eastern Europe Market Y-o-Y Growth (%) Projections by Unit, 2024 to 2034

Figure 136: Eastern Europe Market Value (US$ Million) Analysis by Deployment, 2019 to 2034

Figure 137: Eastern Europe Market Value Share (%) and BPS Analysis by Deployment, 2024 to 2034

Figure 138: Eastern Europe Market Y-o-Y Growth (%) Projections by Deployment, 2024 to 2034

Figure 139: Eastern Europe Market Value (US$ Million) Analysis by Network, 2019 to 2034

Figure 140: Eastern Europe Market Value Share (%) and BPS Analysis by Network, 2024 to 2034

Figure 141: Eastern Europe Market Y-o-Y Growth (%) Projections by Network, 2024 to 2034

Figure 142: Eastern Europe Market Value (US$ Million) Analysis by Frequency, 2019 to 2034

Figure 143: Eastern Europe Market Value Share (%) and BPS Analysis by Frequency, 2024 to 2034

Figure 144: Eastern Europe Market Y-o-Y Growth (%) Projections by Frequency, 2024 to 2034

Figure 145: Eastern Europe Market Attractiveness by Component, 2024 to 2034

Figure 146: Eastern Europe Market Attractiveness by Unit, 2024 to 2034

Figure 147: Eastern Europe Market Attractiveness by Deployment, 2024 to 2034

Figure 148: Eastern Europe Market Attractiveness by Network, 2024 to 2034

Figure 149: Eastern Europe Market Attractiveness by Frequency, 2024 to 2034

Figure 150: Eastern Europe Market Attractiveness by Country, 2024 to 2034

Figure 151: South Asia and Pacific Market Value (US$ Million) by Component, 2024 to 2034

Figure 152: South Asia and Pacific Market Value (US$ Million) by Unit, 2024 to 2034

Figure 153: South Asia and Pacific Market Value (US$ Million) by Deployment, 2024 to 2034

Figure 154: South Asia and Pacific Market Value (US$ Million) by Network, 2024 to 2034

Figure 155: South Asia and Pacific Market Value (US$ Million) by Frequency, 2024 to 2034

Figure 156: South Asia and Pacific Market Value (US$ Million) by Country, 2024 to 2034

Figure 157: South Asia and Pacific Market Value (US$ Million) Analysis by Country, 2019 to 2034

Figure 158: South Asia and Pacific Market Value Share (%) and BPS Analysis by Country, 2024 to 2034

Figure 159: South Asia and Pacific Market Y-o-Y Growth (%) Projections by Country, 2024 to 2034

Figure 160: South Asia and Pacific Market Value (US$ Million) Analysis by Component, 2019 to 2034

Figure 161: South Asia and Pacific Market Value Share (%) and BPS Analysis by Component, 2024 to 2034

Figure 162: South Asia and Pacific Market Y-o-Y Growth (%) Projections by Component, 2024 to 2034

Figure 163: South Asia and Pacific Market Value (US$ Million) Analysis by Unit, 2019 to 2034

Figure 164: South Asia and Pacific Market Value Share (%) and BPS Analysis by Unit, 2024 to 2034

Figure 165: South Asia and Pacific Market Y-o-Y Growth (%) Projections by Unit, 2024 to 2034

Figure 166: South Asia and Pacific Market Value (US$ Million) Analysis by Deployment, 2019 to 2034

Figure 167: South Asia and Pacific Market Value Share (%) and BPS Analysis by Deployment, 2024 to 2034

Figure 168: South Asia and Pacific Market Y-o-Y Growth (%) Projections by Deployment, 2024 to 2034

Figure 169: South Asia and Pacific Market Value (US$ Million) Analysis by Network, 2019 to 2034

Figure 170: South Asia and Pacific Market Value Share (%) and BPS Analysis by Network, 2024 to 2034

Figure 171: South Asia and Pacific Market Y-o-Y Growth (%) Projections by Network, 2024 to 2034

Figure 172: South Asia and Pacific Market Value (US$ Million) Analysis by Frequency, 2019 to 2034

Figure 173: South Asia and Pacific Market Value Share (%) and BPS Analysis by Frequency, 2024 to 2034

Figure 174: South Asia and Pacific Market Y-o-Y Growth (%) Projections by Frequency, 2024 to 2034

Figure 175: South Asia and Pacific Market Attractiveness by Component, 2024 to 2034

Figure 176: South Asia and Pacific Market Attractiveness by Unit, 2024 to 2034

Figure 177: South Asia and Pacific Market Attractiveness by Deployment, 2024 to 2034

Figure 178: South Asia and Pacific Market Attractiveness by Network, 2024 to 2034

Figure 179: South Asia and Pacific Market Attractiveness by Frequency, 2024 to 2034

Figure 180: South Asia and Pacific Market Attractiveness by Country, 2024 to 2034

Figure 181: East Asia Market Value (US$ Million) by Component, 2024 to 2034

Figure 182: East Asia Market Value (US$ Million) by Unit, 2024 to 2034

Figure 183: East Asia Market Value (US$ Million) by Deployment, 2024 to 2034

Figure 184: East Asia Market Value (US$ Million) by Network, 2024 to 2034

Figure 185: East Asia Market Value (US$ Million) by Frequency, 2024 to 2034

Figure 186: East Asia Market Value (US$ Million) by Country, 2024 to 2034

Figure 187: East Asia Market Value (US$ Million) Analysis by Country, 2019 to 2034

Figure 188: East Asia Market Value Share (%) and BPS Analysis by Country, 2024 to 2034

Figure 189: East Asia Market Y-o-Y Growth (%) Projections by Country, 2024 to 2034

Figure 190: East Asia Market Value (US$ Million) Analysis by Component, 2019 to 2034

Figure 191: East Asia Market Value Share (%) and BPS Analysis by Component, 2024 to 2034

Figure 192: East Asia Market Y-o-Y Growth (%) Projections by Component, 2024 to 2034

Figure 193: East Asia Market Value (US$ Million) Analysis by Unit, 2019 to 2034

Figure 194: East Asia Market Value Share (%) and BPS Analysis by Unit, 2024 to 2034

Figure 195: East Asia Market Y-o-Y Growth (%) Projections by Unit, 2024 to 2034

Figure 196: East Asia Market Value (US$ Million) Analysis by Deployment, 2019 to 2034

Figure 197: East Asia Market Value Share (%) and BPS Analysis by Deployment, 2024 to 2034

Figure 198: East Asia Market Y-o-Y Growth (%) Projections by Deployment, 2024 to 2034

Figure 199: East Asia Market Value (US$ Million) Analysis by Network, 2019 to 2034

Figure 200: East Asia Market Value Share (%) and BPS Analysis by Network, 2024 to 2034

Figure 201: East Asia Market Y-o-Y Growth (%) Projections by Network, 2024 to 2034

Figure 202: East Asia Market Value (US$ Million) Analysis by Frequency, 2019 to 2034

Figure 203: East Asia Market Value Share (%) and BPS Analysis by Frequency, 2024 to 2034

Figure 204: East Asia Market Y-o-Y Growth (%) Projections by Frequency, 2024 to 2034

Figure 205: East Asia Market Attractiveness by Component, 2024 to 2034

Figure 206: East Asia Market Attractiveness by Unit, 2024 to 2034

Figure 207: East Asia Market Attractiveness by Deployment, 2024 to 2034

Figure 208: East Asia Market Attractiveness by Network, 2024 to 2034

Figure 209: East Asia Market Attractiveness by Frequency, 2024 to 2034

Figure 210: East Asia Market Attractiveness by Country, 2024 to 2034

Figure 211: Middle East and Africa Market Value (US$ Million) by Component, 2024 to 2034

Figure 212: Middle East and Africa Market Value (US$ Million) by Unit, 2024 to 2034

Figure 213: Middle East and Africa Market Value (US$ Million) by Deployment, 2024 to 2034

Figure 214: Middle East and Africa Market Value (US$ Million) by Network, 2024 to 2034

Figure 215: Middle East and Africa Market Value (US$ Million) by Frequency, 2024 to 2034

Figure 216: Middle East and Africa Market Value (US$ Million) by Country, 2024 to 2034

Figure 217: Middle East and Africa Market Value (US$ Million) Analysis by Country, 2019 to 2034

Figure 218: Middle East and Africa Market Value Share (%) and BPS Analysis by Country, 2024 to 2034

Figure 219: Middle East and Africa Market Y-o-Y Growth (%) Projections by Country, 2024 to 2034

Figure 220: Middle East and Africa Market Value (US$ Million) Analysis by Component, 2019 to 2034

Figure 221: Middle East and Africa Market Value Share (%) and BPS Analysis by Component, 2024 to 2034

Figure 222: Middle East and Africa Market Y-o-Y Growth (%) Projections by Component, 2024 to 2034

Figure 223: Middle East and Africa Market Value (US$ Million) Analysis by Unit, 2019 to 2034

Figure 224: Middle East and Africa Market Value Share (%) and BPS Analysis by Unit, 2024 to 2034

Figure 225: Middle East and Africa Market Y-o-Y Growth (%) Projections by Unit, 2024 to 2034

Figure 226: Middle East and Africa Market Value (US$ Million) Analysis by Deployment, 2019 to 2034

Figure 227: Middle East and Africa Market Value Share (%) and BPS Analysis by Deployment, 2024 to 2034

Figure 228: Middle East and Africa Market Y-o-Y Growth (%) Projections by Deployment, 2024 to 2034

Figure 229: Middle East and Africa Market Value (US$ Million) Analysis by Network, 2019 to 2034

Figure 230: Middle East and Africa Market Value Share (%) and BPS Analysis by Network, 2024 to 2034

Figure 231: Middle East and Africa Market Y-o-Y Growth (%) Projections by Network, 2024 to 2034

Figure 232: Middle East and Africa Market Value (US$ Million) Analysis by Frequency, 2019 to 2034

Figure 233: Middle East and Africa Market Value Share (%) and BPS Analysis by Frequency, 2024 to 2034

Figure 234: Middle East and Africa Market Y-o-Y Growth (%) Projections by Frequency, 2024 to 2034

Figure 235: Middle East and Africa Market Attractiveness by Component, 2024 to 2034

Figure 236: Middle East and Africa Market Attractiveness by Unit, 2024 to 2034

Figure 237: Middle East and Africa Market Attractiveness by Deployment, 2024 to 2034

Figure 238: Middle East and Africa Market Attractiveness by Network, 2024 to 2034

Figure 239: Middle East and Africa Market Attractiveness by Frequency, 2024 to 2034

Figure 240: Middle East and Africa Market Attractiveness by Country, 2024 to 2034

Frequently Asked Questions

How Big is the Open Radio Access Network Market in 2024?

The open radio access network market is estimated to be valued at USD 1.9 billion in 2024.

What is China’s Market Outlook?

The market in China is expected to progress at a CAGR of 71.7% over the forecast period.

Which Component Segment Contributes More to the Market?

Within the component, the hardware segment is expected to register a CAGR of 70.5% market from 2024 to 2034.

What is the United States Market Outlook?

The United States accounts for around 70.9% of the global CAGR from 2024 to 2034.

What is the Global Market Projected Value for 2034?

The global market is set to reach a valuation of around USD 401 billion by the end of 2034.

What Was the Historical CAGR for the Global Market?

The demand for open radio access networks increased at a 74.0% CAGR from 2019 to 2023.

Explore Similar Insights

Future Market Insights

Open Radio Access Network Market