Reports

- Global Locations -

Headquarters

Future Market Insights, Inc.

Christiana Corporate, 200
Continental Drive, Suite 401,
Newark, Delaware - 19713,
United States

T: +1-347-918-3531

Americas

Future Market Insights, Inc.

616 Corporate Way, Suite 2-9018,
Valley Cottage, NY 10989, United States

MEA

Future Market Insights

1602-6 Jumeirah Bay X2 Tower, Plot No: JLT-PH2-X2A,
Jumeirah Lakes Towers, Dubai,
United Arab Emirates

Europe

Future Market Insights

3rd Floor, 207 Regent Street,
W1B 3HH London
United Kingdom

T: + 44 (0) 20 8123 9659

Asia Pacific

Future Market Insights

IndiaLand Global Tech Park, Unit UG-1, Behind Grand HighStreet, Phase 1, Hinjawadi, MH, Pune – 411057, India

Open Source Service Market Outlook from 2024 to 2034

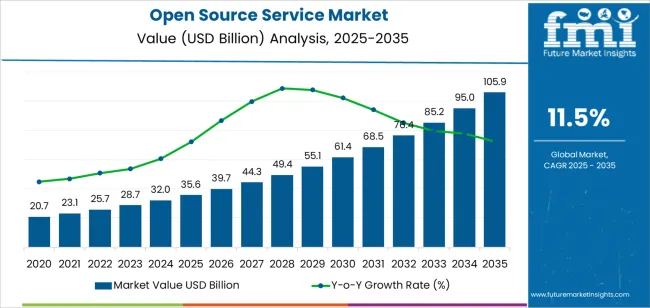
The open source service market is projected to be valued at US$ 30.6 billion in 2024 and rise to US$ 141.0 billion by 2034. It is expected to progress at an impressive CAGR of 16.5% during the forecast period.

Attributes Key Statistics
Expected Base Year Value (2024) US$ 30.6 billion
Anticipated Forecast Value (2034) US$ 141.0 billion
Estimated Growth Rate (2024 to 2034) 16.5% CAGR

Don't pay for what you don't need

Customize your report by selecting specific countries or regions and save 30%!

Key Market Drivers

  • Open source software is cost-effective, saving businesses money on licensing fees.
  • A diverse community of developers contributes to open source software, driving rapid innovation.
  • Flexibility and customization allow for tailored solutions that integrate with existing systems.
  • Open source software is typically vendor-neutral, reducing vendor lock-in.
  • Security standards and code reviews provide reliable and secure software.
  • Professional support and services are available for successful implementation and maintenance.
  • Large enterprises are increasingly adopting open source software for mission-critical applications.
  • Open source software provides businesses with greater control over their technology stack.

Consumption Analysis of Open Source Services

  • Sales of open source services are rising as companies invest in support and maintenance.
  • Open source services are being adopted across various industries, including retail and distribution, healthcare and life sciences, BFSI, and manufacturing.
  • Businesses integrate open source solutions into their operations to increase customer satisfaction.
  • The transparency of the development process drives the growing popularity of open source services.
  • Open source solutions are becoming alternatives to proprietary IT, healthcare, finance, and education software.
  • The collaborative nature and transparent development process of open source projects fuel their popularity among businesses and developers.
Sudip Saha
Sudip Saha

Principal Consultant

Talk to Analyst

Find your sweet spots for generating winning opportunities in this market.

Restraining Factors Adversely Affecting the Open Source Service Market

  • Limited awareness can slow the adoption of open source software.
  • Perception of risk can discourage organizations from embracing open source solutions.
  • Fragmentation and compatibility issues can hinder interoperability and integration.
  • Finding reliable support and maintenance services can be challenging.
  • Concerns about intellectual property and licensing can create uncertainty.
  • Resistance to change may prevent businesses from exploring open source alternatives.
  • Monetizing open source software may require compromising its ethos.
  • Collaborative development can drive innovation and improve software quality.
  • Open source communities can provide valuable resources and support.

Comparative View of Adjacent Industries

A comprehensive study on the open source service market has been conducted, along with two other markets that have the potential to compete rigorously with it. These markets are the cloud service market and the IT service management tool market. The growth rates and current market valuations are mentioned in the table below, along with the respective markets' growth factors and critical challenges.

Open Source Service Market:

Attributes Open Source Service Market
CAGR (2024 to 2034) 16.5%
Growth Factor Organizations can leverage open source solutions without hefty licensing fees
Key Challenge While transparency can enhance security, it also exposes vulnerabilities

Cloud Service Market:

Attributes Cloud Service Market
CAGR (2024 to 2034) 15.7 %
Growth Factor Pay-as-you-go pricing models reduce capital expenditure and make cloud services financially attractive
Key Challenge Data breaches and compliance challenges pose significant security concerns for businesses using cloud services

IT Service Management Tool Market:

Attributes IT Service Management Tools Market
CAGR (2024 to 2034) 15.2%
Growth Factor IT service management tools streamline processes, leading to increased productivity within IT departments.
Key Challenge Scalability issues may arise as these tools struggle to handle growing volumes of data and user requests

Get the data you need at a Fraction of the cost

Personalize your report by choosing insights you need
and save 40%!

Category-wise Insights

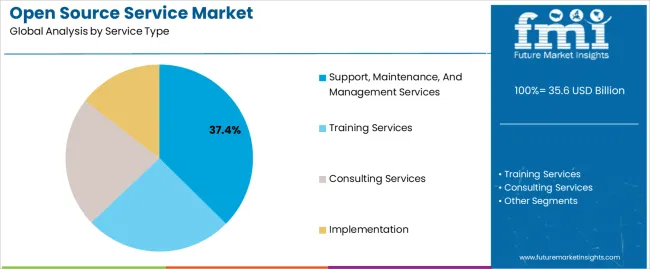
Support, Maintenance, and Management Services Top the Market by Guaranteeing Software Reliability and Functionality

Support, maintenance, and management services are poised to propel the open source service market with a 16.3% CAGR through 2034.

Attributes Details
Service Type Support, Maintenance, and Management Services
CAGR (2024 to 2034) 16.3%

This rising popularity is attributed to:

  • Open source software is complex and diverse, demanding professional support services.
  • Expertise in deployment, configuration, troubleshooting, and maintenance is critical.
  • Continuous management services are necessary to keep pace with emerging technologies and security threats.
  • Effective support and maintenance instill confidence in the stability and security of IT infrastructure.
  • Partnering with experienced service providers mitigates risks and maximizes investments.
  • Comprehensive services tailored to specific needs and challenges differentiate providers.
  • Trusted partnerships with providers drive innovation and growth.

BFSI Makes Significant Market Impact with Security and Customizability of Open Source Solutions

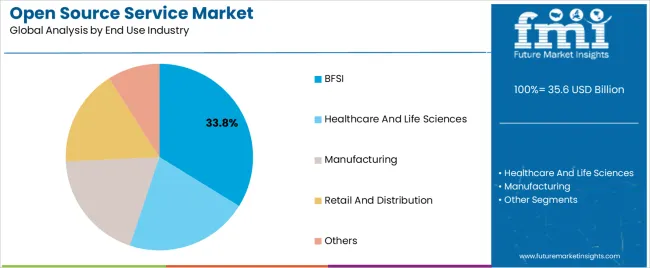
Based on end users, the BFSI segment is expected to generate significant revenue in the open source service market, exhibiting a 16.1% CAGR from 2024 to 2034.

Attributes Details
End Use BFSI
CAGR (2024 to 2034) 16.1%
  • The BFSI sector relies on open source services for security and compliance needs.
  • Open source provides cost-effective solutions while enabling customization and innovation, which is appealing to the BFSI sector.
  • Digital transformation initiatives increase the demand for open source software and services in this sector.
  • Open source solutions support the complex IT infrastructures of financial institutions.
  • Open source solutions provide scalability, agility, and interoperability to organizations operating in this sector.
  • BFSI organizations leverage open source technologies to drive innovation and customer engagement.
  • Open source solutions help BFSI organizations stay ahead in an increasingly dynamic market landscape.

Country-wise Insights

This section examines the open source service market across various countries, encompassing the United Kingdom, the United States, China, South Korea, and Japan. The table illustrates each country's CAGR, projecting the anticipated market expansion up to 2034.

Countries Forecasted CAGR from 2024 to 2034
South Korea 18.3%
United Kingdom 17.7%
Japan 17.6%
China 16.9%
United States 16.8%

Government Initiatives and Existence of Tech Giants Propel South Korea to the Forefront of Open Source Development

South Korea is rapidly establishing itself as a formidable force in the open source service market, showcasing CAGR of 18.3% from 2024 to 2034. This remarkable surge underscores South Korea's unwavering commitment to innovation and technological advancement, propelling it to the forefront of the open source revolution.

With leading tech companies like Samsung and LG investing in open source projects and collaboration initiatives, South Korea fosters a vibrant open source software development and adoption ecosystem.

Government initiatives to promote open data policies and encourage collaboration in the tech community are driving market expansion. The adoption of open source solutions in key sectors like telecommunications, finance, and healthcare is fueling market growth and driving innovation in South Korea.

Demand for Innovative Software Solutions in the United Kingdom is Helping the Open source Service Market to Grow

The United Kingdom is a formidable force in the open source service market, showcasing a remarkable CAGR of 17.7% projected through 2034. The country has a robust tech ecosystem home to innovation hubs like London's Silicon Roundabout, fostering a conducive environment for open source software development and adoption.

The government has taken several initiatives to promote digital innovation and entrepreneurship, coupled with favorable regulatory frameworks that encourage the proliferation of open source solutions across industries. The United Kingdom's strong emphasis on cybersecurity and data privacy regulations enhances trust and reliability in open source services, driving adoption among businesses seeking secure and transparent software solutions.

Robust Technology Infrastructure and Industry Collaboration Propel Japan to Open Source Service Leadership

Japan solidifies its pivotal role in the open source service market, showcasing unwavering growth momentum with an impressive CAGR of 17.6%. This trajectory underscores Japan's commitment to innovation and technological advancement, positioning the nation as a frontrunner in driving the evolution of open source solutions worldwide.

With a rich history of technological innovation and a strong emphasis on research and development, Japan is witnessing a surge in open source software development and adoption. Moreover, initiatives like the Japan Open Source Software Association and government support for open source projects drive market expansion.

Versatility and cost-effectiveness of open source solutions appeal to Japanese businesses seeking to enhance efficiency and innovation, further driving market growth and adoption.

Government Support for Innovation and Drive for Technological Self-reliance are Propelling Market Growth in China

China is poised to revolutionize the open source service market, showcasing an astounding compound annual growth rate (CAGR) of 16.9% from 2024 to 2034. With its rapidly evolving tech landscape and unparalleled innovation capabilities, China is not just participating but leading the charge in shaping the future of open source services worldwide.

With a massive pool of tech talent and a thriving startup ecosystem, China is witnessing a surge in open source software development and adoption. Moreover, initiatives like the China Open Source Cloud Alliance and government-backed projects to promote open source technologies are driving market expansion.

Adopting open source solutions aligns with China's efforts to reduce dependence on foreign technology and enhance technological self-reliance, further boosting market growth.

Favorable Tech Ecosystem and Innovative Culture Propel the United States to the Pinnacle of Open Source Revolution

The United States is unequivocally establishing itself as a powerhouse in the open source service market, boasting an impressive projected CAGR of 16.8% anticipated to endure until 2034. This steadfast emergence underscores the nation's unwavering commitment to technological innovation and its relentless pursuit of excellence in the digital realm.

With renowned tech hubs like Silicon Valley and a thriving startup culture, the United States is at the forefront of open source software development and adoption. The presence of major tech giants and industry leaders investing heavily in open source projects further fuels market expansion.

The United States government's initiatives to promote open data policies and encourage collaboration in the software development community create a conducive environment for the growth of open source services. The versatility and scalability of open source solutions appeal to businesses across various sectors, driving widespread adoption and market growth.

Competitive Landscape

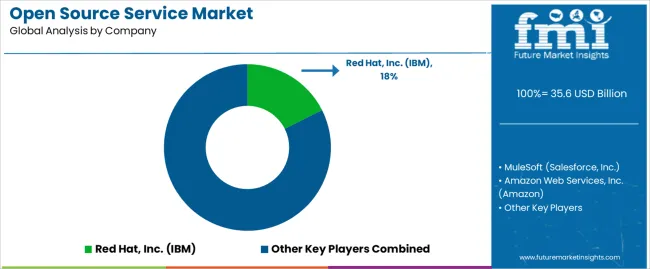
Many key companies actively contribute to global growth by investing heavily in open source projects. Leading technology firms such as IBM, Red Hat (now part of IBM), Microsoft, and Google are among those providing financial support, technical expertise, and resources to foster innovation and community development. These companies recognize the strategic importance of open source software in driving digital transformation.

In addition to technology giants, established open source vendors and service providers, such as Canonical, SUSE, and Docker, are expanding their global presence by entering new markets and forming partnerships with local organizations and enterprises.

These companies offer comprehensive solutions for deploying, managing, and optimizing open source software across diverse industries and use cases. By customizing their offerings to meet the specific needs and preferences of different regions and market segments, these vendors are effectively driving adoption and fueling the growth of the open source service market on a global scale.

Recent Developments
  • Persistent Systems Ltd. shares rose by 1.16% on November 20, 2023, following the launch of their open source maintenance service. The service aimed to ensure organizations' open source software remained up-to-date with patches and bug fixes.
  • On December 21, 2023, the Linux Foundation and Meta broadened open source connectivity projects for network service providers. LF Connectivity expanded with Meta's ISP Toolbox and Magma subprojects.
  • On May 26, 2021, Databricks unveiled Delta Sharing, an open source tool facilitating data sharing across various cloud infrastructures and SaaS products with appropriate connectors. This expansion enhanced their Delta Lake project.
  • Boston Consulting Group flagged a long-term trend on September 28, 2023, indicating a shift from traditional banking to fintech services. They estimated fintech revenue to surge from 2% to 25% by 2030, reaching US$ 1.5 trillion annually.
  • On March 23, 2023, Vue Storefront secured US$ 20 million in funding despite eCommerce slowdowns. The Poland-based startup experienced 300% revenue growth in 18 months, intending to enhance its platform and target B2B eCommerce.

Key Companies in the Market

  • Red Hat, Inc. (IBM)
  • MuleSoft (Salesforce, Inc.)
  • Amazon Web Services, Inc. (Amazon)
  • Databricks
  • HashiCorp
  • Alphabet, Inc. (Google)
  • Microsoft
  • SAP SE
  • IBM Corporation
  • Oracle Corporation
  • Accenture Plc.
  • Wipro Limited
  • Cisco System, Inc.
  • SUSE
  • ViSolve.Com
  • Hewlett Packard Enterprise Development LP
  • Infosys Limited
  • Kubermatic GmbH

Key Coverage in the Open Source Service Market Market Report

  • Factors Impacting the Open Source Service Market Size
  • Competitive Analysis of Top Emerging Open Source Communities at Github
  • List of Free and Open Source Software Organizations
  • Market Analysis on Open Source Community
  • Insights into the Open Source Cloud Software in Different Regions
  • 10 Best Open Source Software Examples

Market Segmentation

By Service Type:

  • Support, Maintenance, and Management Services
  • Training Services
  • Consulting Services
  • Implementation

By End Use Industry:

  • BFSI
  • Healthcare and Life Sciences
  • Manufacturing
  • Retail and Distribution
  • Others

By Region:

  • North America
  • Latin America
  • Asia Pacific
  • Middle East and Africa (MEA)
  • Europe

Frequently Asked Questions

What is the Current Worth of the Open Source Service Market?

The market is expected to be worth US$ 30.6 billion in 2024.

What is the Sales Forecast for Open Source Service Through 2034?

The open source service market is expected to reach US$ 141.0 billion by 2034.

At What Rate Is the Open Source Service Market Growing Globally?

The market is growing at a CAGR of 16.5% from 2024 to 2034.

Who are the Key Market Players offering Open Source Services?

Red Hat, Inc., MuleSoft, Amazon Web Services, Inc., and Oracle Corporation are among the key companies contributing to the expansion of the open source service market.

Which is the Top End-use Industry in the Open Source Service Market?

BFSI is the top end use industries, anticipated to develop at a 16.1% CAGR through 2034.

Table of Content

1. Executive Summary

    1.1. Global Market Outlook

    1.2. Demand-side Trends

    1.3. Supply-side Trends

    1.4. Technology Roadmap Analysis

    1.5. Analysis and Recommendations

2. Market Overview

    2.1. Market Coverage / Taxonomy

    2.2. Market Definition / Scope / Limitations

3. Market Background

    3.1. Market Dynamics

        3.1.1. Drivers

        3.1.2. Restraints

        3.1.3. Opportunity

        3.1.4. Trends

    3.2. Scenario Forecast

        3.2.1. Demand in Optimistic Scenario

        3.2.2. Demand in Likely Scenario

        3.2.3. Demand in Conservative Scenario

    3.3. Opportunity Map Analysis

    3.4. Investment Feasibility Matrix

    3.5. PESTLE and Porter’s Analysis

    3.6. Regulatory Landscape

        3.6.1. By Key Regions

        3.6.2. By Key Countries

    3.7. Regional Parent Market Outlook

4. Global Market Analysis 2019 to 2023 and Forecast, 2024 to 2034

    4.1. Historical Market Size Value (US$ Million) Analysis, 2019 to 2023

    4.2. Current and Future Market Size Value (US$ Million) Projections, 2024 to 2034

        4.2.1. Y-o-Y Growth Trend Analysis

        4.2.2. Absolute $ Opportunity Analysis

5. Global Market Analysis 2019 to 2023 and Forecast 2024 to 2034, By Services

    5.1. Introduction / Key Findings

    5.2. Historical Market Size Value (US$ Million) Analysis By Services, 2019 to 2023

    5.3. Current and Future Market Size Value (US$ Million) Analysis and Forecast By Services, 2024 to 2034

        5.3.1. Integration & Deployment

        5.3.2. Training & Consulting

        5.3.3. Managed Services

        5.3.4. Support & Maintenance

    5.4. Y-o-Y Growth Trend Analysis By Services, 2019 to 2023

    5.5. Absolute $ Opportunity Analysis By Services, 2024 to 2034

6. Global Market Analysis 2019 to 2023 and Forecast 2024 to 2034, By Deployment

    6.1. Introduction / Key Findings

    6.2. Historical Market Size Value (US$ Million) Analysis By Deployment, 2019 to 2023

    6.3. Current and Future Market Size Value (US$ Million) Analysis and Forecast By Deployment, 2024 to 2034

        6.3.1. Cloud Based Deployment

        6.3.2. On-Premise Deployment

        6.3.3. Hybrid Deployment

    6.4. Y-o-Y Growth Trend Analysis By Deployment, 2019 to 2023

    6.5. Absolute $ Opportunity Analysis By Deployment, 2024 to 2034

7. Global Market Analysis 2019 to 2023 and Forecast 2024 to 2034, By Application

    7.1. Introduction / Key Findings

    7.2. Historical Market Size Value (US$ Million) Analysis By Application, 2019 to 2023

    7.3. Current and Future Market Size Value (US$ Million) Analysis and Forecast By Application, 2024 to 2034

        7.3.1. BFSI

        7.3.2. IT & ITeS

        7.3.3. Telecommunication & Media

        7.3.4. Industrial

        7.3.5. Retail & E-commerce

        7.3.6. Others

    7.4. Y-o-Y Growth Trend Analysis By Application, 2019 to 2023

    7.5. Absolute $ Opportunity Analysis By Application, 2024 to 2034

8. Global Market Analysis 2019 to 2023 and Forecast 2024 to 2034, By End-User

    8.1. Introduction / Key Findings

    8.2. Historical Market Size Value (US$ Million) Analysis By End-user, 2019 to 2023

    8.3. Current and Future Market Size Value (US$ Million) Analysis and Forecast By End-user, 2024 to 2034

        8.3.1. Large Enterprises

        8.3.2. Small & Medium Enterprises

    8.4. Y-o-Y Growth Trend Analysis By End-user, 2019 to 2023

    8.5. Absolute $ Opportunity Analysis By End-user, 2024 to 2034

9. Global Market Analysis 2019 to 2023 and Forecast 2024 to 2034, By Region

    9.1. Introduction

    9.2. Historical Market Size Value (US$ Million) Analysis By Region, 2019 to 2023

    9.3. Current Market Size Value (US$ Million) Analysis and Forecast By Region, 2024 to 2034

        9.3.1. North America

        9.3.2. Latin America

        9.3.3. Western Europe

        9.3.4. Eastern Europe

        9.3.5. South Asia and Pacific

        9.3.6. East Asia

        9.3.7. Middle East and Africa

    9.4. Market Attractiveness Analysis By Region

10. North America Market Analysis 2019 to 2023 and Forecast 2024 to 2034, By Country

    10.1. Historical Market Size Value (US$ Million) Trend Analysis By Market Taxonomy, 2019 to 2023

    10.2. Market Size Value (US$ Million) Forecast By Market Taxonomy, 2024 to 2034

        10.2.1. By Country

            10.2.1.1. USA

            10.2.1.2. Canada

        10.2.2. By Services

        10.2.3. By Deployment

        10.2.4. By Application

        10.2.5. By End-user

    10.3. Market Attractiveness Analysis

        10.3.1. By Country

        10.3.2. By Services

        10.3.3. By Deployment

        10.3.4. By Application

        10.3.5. By End-user

    10.4. Key Takeaways

11. Latin America Market Analysis 2019 to 2023 and Forecast 2024 to 2034, By Country

    11.1. Historical Market Size Value (US$ Million) Trend Analysis By Market Taxonomy, 2019 to 2023

    11.2. Market Size Value (US$ Million) Forecast By Market Taxonomy, 2024 to 2034

        11.2.1. By Country

            11.2.1.1. Brazil

            11.2.1.2. Mexico

            11.2.1.3. Rest of Latin America

        11.2.2. By Services

        11.2.3. By Deployment

        11.2.4. By Application

        11.2.5. By End-user

    11.3. Market Attractiveness Analysis

        11.3.1. By Country

        11.3.2. By Services

        11.3.3. By Deployment

        11.3.4. By Application

        11.3.5. By End-user

    11.4. Key Takeaways

12. Western Europe Market Analysis 2019 to 2023 and Forecast 2024 to 2034, By Country

    12.1. Historical Market Size Value (US$ Million) Trend Analysis By Market Taxonomy, 2019 to 2023

    12.2. Market Size Value (US$ Million) Forecast By Market Taxonomy, 2024 to 2034

        12.2.1. By Country

            12.2.1.1. Germany

            12.2.1.2. UK

            12.2.1.3. France

            12.2.1.4. Spain

            12.2.1.5. Italy

            12.2.1.6. Rest of Western Europe

        12.2.2. By Services

        12.2.3. By Deployment

        12.2.4. By Application

        12.2.5. By End-user

    12.3. Market Attractiveness Analysis

        12.3.1. By Country

        12.3.2. By Services

        12.3.3. By Deployment

        12.3.4. By Application

        12.3.5. By End-user

    12.4. Key Takeaways

13. Eastern Europe Market Analysis 2019 to 2023 and Forecast 2024 to 2034, By Country

    13.1. Historical Market Size Value (US$ Million) Trend Analysis By Market Taxonomy, 2019 to 2023

    13.2. Market Size Value (US$ Million) Forecast By Market Taxonomy, 2024 to 2034

        13.2.1. By Country

            13.2.1.1. Poland

            13.2.1.2. Russia

            13.2.1.3. Czech Republic

            13.2.1.4. Romania

            13.2.1.5. Rest of Eastern Europe

        13.2.2. By Services

        13.2.3. By Deployment

        13.2.4. By Application

        13.2.5. By End-user

    13.3. Market Attractiveness Analysis

        13.3.1. By Country

        13.3.2. By Services

        13.3.3. By Deployment

        13.3.4. By Application

        13.3.5. By End-user

    13.4. Key Takeaways

14. South Asia and Pacific Market Analysis 2019 to 2023 and Forecast 2024 to 2034, By Country

    14.1. Historical Market Size Value (US$ Million) Trend Analysis By Market Taxonomy, 2019 to 2023

    14.2. Market Size Value (US$ Million) Forecast By Market Taxonomy, 2024 to 2034

        14.2.1. By Country

            14.2.1.1. India

            14.2.1.2. Bangladesh

            14.2.1.3. Australia

            14.2.1.4. New Zealand

            14.2.1.5. Rest of South Asia and Pacific

        14.2.2. By Services

        14.2.3. By Deployment

        14.2.4. By Application

        14.2.5. By End-user

    14.3. Market Attractiveness Analysis

        14.3.1. By Country

        14.3.2. By Services

        14.3.3. By Deployment

        14.3.4. By Application

        14.3.5. By End-user

    14.4. Key Takeaways

15. East Asia Market Analysis 2019 to 2023 and Forecast 2024 to 2034, By Country

    15.1. Historical Market Size Value (US$ Million) Trend Analysis By Market Taxonomy, 2019 to 2023

    15.2. Market Size Value (US$ Million) Forecast By Market Taxonomy, 2024 to 2034

        15.2.1. By Country

            15.2.1.1. China

            15.2.1.2. Japan

            15.2.1.3. South Korea

        15.2.2. By Services

        15.2.3. By Deployment

        15.2.4. By Application

        15.2.5. By End-user

    15.3. Market Attractiveness Analysis

        15.3.1. By Country

        15.3.2. By Services

        15.3.3. By Deployment

        15.3.4. By Application

        15.3.5. By End-user

    15.4. Key Takeaways

16. Middle East and Africa Market Analysis 2019 to 2023 and Forecast 2024 to 2034, By Country

    16.1. Historical Market Size Value (US$ Million) Trend Analysis By Market Taxonomy, 2019 to 2023

    16.2. Market Size Value (US$ Million) Forecast By Market Taxonomy, 2024 to 2034

        16.2.1. By Country

            16.2.1.1. GCC Countries

            16.2.1.2. South Africa

            16.2.1.3. Israel

            16.2.1.4. Rest of MEA

        16.2.2. By Services

        16.2.3. By Deployment

        16.2.4. By Application

        16.2.5. By End-user

    16.3. Market Attractiveness Analysis

        16.3.1. By Country

        16.3.2. By Services

        16.3.3. By Deployment

        16.3.4. By Application

        16.3.5. By End-user

    16.4. Key Takeaways

17. Key Countries Market Analysis

    17.1. USA

        17.1.1. Market Share Analysis, 2023

            17.1.1.1. By Services

            17.1.1.2. By Deployment

            17.1.1.3. By Application

            17.1.1.4. By End-user

    17.2. Canada

        17.2.1. Market Share Analysis, 2023

            17.2.1.1. By Services

            17.2.1.2. By Deployment

            17.2.1.3. By Application

            17.2.1.4. By End-user

    17.3. Brazil

        17.3.1. Market Share Analysis, 2023

            17.3.1.1. By Services

            17.3.1.2. By Deployment

            17.3.1.3. By Application

            17.3.1.4. By End-user

    17.4. Mexico

        17.4.1. Market Share Analysis, 2023

            17.4.1.1. By Services

            17.4.1.2. By Deployment

            17.4.1.3. By Application

            17.4.1.4. By End-user

    17.5. Germany

        17.5.1. Market Share Analysis, 2023

            17.5.1.1. By Services

            17.5.1.2. By Deployment

            17.5.1.3. By Application

            17.5.1.4. By End-user

    17.6. UK

        17.6.1. Market Share Analysis, 2023

            17.6.1.1. By Services

            17.6.1.2. By Deployment

            17.6.1.3. By Application

            17.6.1.4. By End-user

    17.7. France

        17.7.1. Market Share Analysis, 2023

            17.7.1.1. By Services

            17.7.1.2. By Deployment

            17.7.1.3. By Application

            17.7.1.4. By End-user

    17.8. Spain

        17.8.1. Market Share Analysis, 2023

            17.8.1.1. By Services

            17.8.1.2. By Deployment

            17.8.1.3. By Application

            17.8.1.4. By End-user

    17.9. Italy

        17.9.1. Market Share Analysis, 2023

            17.9.1.1. By Services

            17.9.1.2. By Deployment

            17.9.1.3. By Application

            17.9.1.4. By End-user

    17.10. Poland

        17.10.1. Market Share Analysis, 2023

            17.10.1.1. By Services

            17.10.1.2. By Deployment

            17.10.1.3. By Application

            17.10.1.4. By End-user

    17.11. Russia

        17.11.1. Market Share Analysis, 2023

            17.11.1.1. By Services

            17.11.1.2. By Deployment

            17.11.1.3. By Application

            17.11.1.4. By End-user

    17.12. Czech Republic

        17.12.1. Market Share Analysis, 2023

            17.12.1.1. By Services

            17.12.1.2. By Deployment

            17.12.1.3. By Application

            17.12.1.4. By End-user

    17.13. Romania

        17.13.1. Market Share Analysis, 2023

            17.13.1.1. By Services

            17.13.1.2. By Deployment

            17.13.1.3. By Application

            17.13.1.4. By End-user

    17.14. India

        17.14.1. Market Share Analysis, 2023

            17.14.1.1. By Services

            17.14.1.2. By Deployment

            17.14.1.3. By Application

            17.14.1.4. By End-user

    17.15. Bangladesh

        17.15.1. Market Share Analysis, 2023

            17.15.1.1. By Services

            17.15.1.2. By Deployment

            17.15.1.3. By Application

            17.15.1.4. By End-user

    17.16. Australia

        17.16.1. Market Share Analysis, 2023

            17.16.1.1. By Services

            17.16.1.2. By Deployment

            17.16.1.3. By Application

            17.16.1.4. By End-user

    17.17. New Zealand

        17.17.1. Market Share Analysis, 2023

            17.17.1.1. By Services

            17.17.1.2. By Deployment

            17.17.1.3. By Application

            17.17.1.4. By End-user

    17.18. China

        17.18.1. Market Share Analysis, 2023

            17.18.1.1. By Services

            17.18.1.2. By Deployment

            17.18.1.3. By Application

            17.18.1.4. By End-user

    17.19. Japan

        17.19.1. Market Share Analysis, 2023

            17.19.1.1. By Services

            17.19.1.2. By Deployment

            17.19.1.3. By Application

            17.19.1.4. By End-user

    17.20. South Korea

        17.20.1. Market Share Analysis, 2023

            17.20.1.1. By Services

            17.20.1.2. By Deployment

            17.20.1.3. By Application

            17.20.1.4. By End-user

    17.21. GCC Countries

        17.21.1. Market Share Analysis, 2023

            17.21.1.1. By Services

            17.21.1.2. By Deployment

            17.21.1.3. By Application

            17.21.1.4. By End-user

    17.22. South Africa

        17.22.1. Market Share Analysis, 2023

            17.22.1.1. By Services

            17.22.1.2. By Deployment

            17.22.1.3. By Application

            17.22.1.4. By End-user

    17.23. Israel

        17.23.1. Market Share Analysis, 2023

            17.23.1.1. By Services

            17.23.1.2. By Deployment

            17.23.1.3. By Application

            17.23.1.4. By End-user

18. Market Structure Analysis

    18.1. Competition Dashboard

    18.2. Competition Benchmarking

    18.3. Market Share Analysis of Top Players

        18.3.1. By Regional

        18.3.2. By Services

        18.3.3. By Deployment

        18.3.4. By Application

        18.3.5. By End-user

19. Competition Analysis

    19.1. Competition Deep Dive

        19.1.1. Red Hat, Inc. (IBM)

            19.1.1.1. Overview

            19.1.1.2. Product Portfolio

            19.1.1.3. Profitability by Market Segments

            19.1.1.4. Sales Footprint

            19.1.1.5. Strategy Overview

                19.1.1.5.1. Marketing Strategy

        19.1.2. MuleSoft (Salesforce, Inc.)

            19.1.2.1. Overview

            19.1.2.2. Product Portfolio

            19.1.2.3. Profitability by Market Segments

            19.1.2.4. Sales Footprint

            19.1.2.5. Strategy Overview

                19.1.2.5.1. Marketing Strategy

        19.1.3. Amazon Web Services, Inc. (Amazon)

            19.1.3.1. Overview

            19.1.3.2. Product Portfolio

            19.1.3.3. Profitability by Market Segments

            19.1.3.4. Sales Footprint

            19.1.3.5. Strategy Overview

                19.1.3.5.1. Marketing Strategy

        19.1.4. Databricks

            19.1.4.1. Overview

            19.1.4.2. Product Portfolio

            19.1.4.3. Profitability by Market Segments

            19.1.4.4. Sales Footprint

            19.1.4.5. Strategy Overview

                19.1.4.5.1. Marketing Strategy

        19.1.5. HashiCorp

            19.1.5.1. Overview

            19.1.5.2. Product Portfolio

            19.1.5.3. Profitability by Market Segments

            19.1.5.4. Sales Footprint

            19.1.5.5. Strategy Overview

                19.1.5.5.1. Marketing Strategy

        19.1.6. Alphabet, Inc. (Google)

            19.1.6.1. Overview

            19.1.6.2. Product Portfolio

            19.1.6.3. Profitability by Market Segments

            19.1.6.4. Sales Footprint

            19.1.6.5. Strategy Overview

                19.1.6.5.1. Marketing Strategy

        19.1.7. Cisco

            19.1.7.1. Overview

            19.1.7.2. Product Portfolio

            19.1.7.3. Profitability by Market Segments

            19.1.7.4. Sales Footprint

            19.1.7.5. Strategy Overview

                19.1.7.5.1. Marketing Strategy

        19.1.8. Microsoft

            19.1.8.1. Overview

            19.1.8.2. Product Portfolio

            19.1.8.3. Profitability by Market Segments

            19.1.8.4. Sales Footprint

            19.1.8.5. Strategy Overview

                19.1.8.5.1. Marketing Strategy

        19.1.9. Oracle

            19.1.9.1. Overview

            19.1.9.2. Product Portfolio

            19.1.9.3. Profitability by Market Segments

            19.1.9.4. Sales Footprint

            19.1.9.5. Strategy Overview

                19.1.9.5.1. Marketing Strategy

        19.1.10. SAP SE

            19.1.10.1. Overview

            19.1.10.2. Product Portfolio

            19.1.10.3. Profitability by Market Segments

            19.1.10.4. Sales Footprint

            19.1.10.5. Strategy Overview

                19.1.10.5.1. Marketing Strategy

20. Assumptions & Acronyms Used

21. Research Methodology

Recommendations

Technology

ServiceNow Tech Service Market

Published : April 2024

Technology

Document Outsourcing Service Market

Published : April 2024

Technology

Cloud Service Market

Published : February 2024

Technology

IT Service Management Tools Market

Published : September 2022

Explore Technology Insights

View Reports

Open Source Service Market