The OTT Content Market is estimated to be valued at USD 3.2 billion in 2025 and is projected to reach USD 14.6 billion by 2035, registering a compound annual growth rate (CAGR) of 16.4% over the forecast period.
The OTT content market is expanding rapidly due to increased internet penetration, rising smartphone adoption, and growing consumer preference for on-demand digital entertainment. The current market scenario is characterized by a surge in subscription-based models, diversified content offerings, and technological advancements in streaming infrastructure. Enhanced bandwidth availability and improved user interface design have supported seamless viewing experiences, strengthening consumer retention rates.
Global and regional players are investing heavily in original productions and localized content to attract niche audiences and sustain engagement. The future outlook remains optimistic as integration of AI-driven recommendations, personalized viewing, and interactive streaming formats continue to redefine consumer experience.
Growth rationale is being reinforced by the steady transition from traditional broadcasting to digital streaming, strategic pricing models, and the increasing role of data analytics in content curation Collectively, these developments are positioning the OTT content market for sustained revenue growth and deeper market penetration across both mature and emerging digital economies.
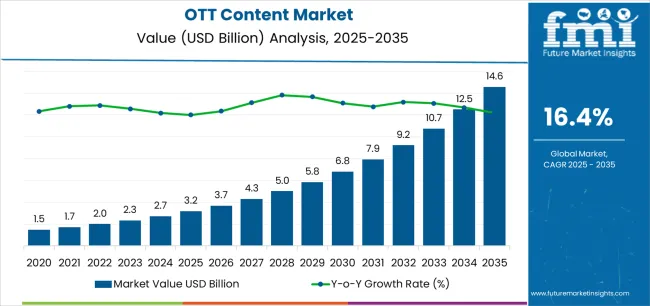
| Metric | Value |
|---|---|
| OTT Content Market Estimated Value in (2025 E) | USD 3.2 billion |
| OTT Content Market Forecast Value in (2035 F) | USD 14.6 billion |
| Forecast CAGR (2025 to 2035) | 16.4% |
The market is segmented by Content Type, Access Type, and Revenue Model and region. By Content Type, the market is divided into Video, Audio, Games, Mobile Applications, and Communication. In terms of Access Type, the market is classified into Smartphones & Tablets, OTT Streaming Devices, Desktops & Laptops, and Smart TVs. Based on Revenue Model, the market is segmented into SVOD Services, AVOD Services, TVOD Services, and Live Streaming Services. Regionally, the market is classified into North America, Latin America, Western Europe, Eastern Europe, Balkan & Baltic Countries, Russia & Belarus, Central Asia, East Asia, South Asia & Pacific, and the Middle East & Africa.
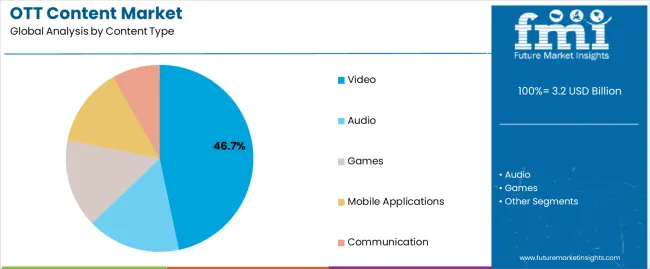
The video segment, accounting for 46.70% of the content type category, has emerged as the dominant format due to its widespread accessibility and universal appeal across demographics. Growth has been propelled by continuous innovation in video quality, including high-definition and ultra-HD formats, and the proliferation of short-form and long-form content catering to varied user preferences.
Major OTT platforms are expanding their libraries with diversified genres, while investments in exclusive and original video content are enhancing brand loyalty and reducing subscriber churn. Enhanced monetization through ad-supported and subscription-driven video models has also contributed to sustained revenue generation.
As content consumption becomes increasingly mobile-centric, the video segment is expected to maintain its leadership through adaptive streaming technologies, personalized recommendations, and cross-platform integration, ensuring ongoing engagement and market dominance.
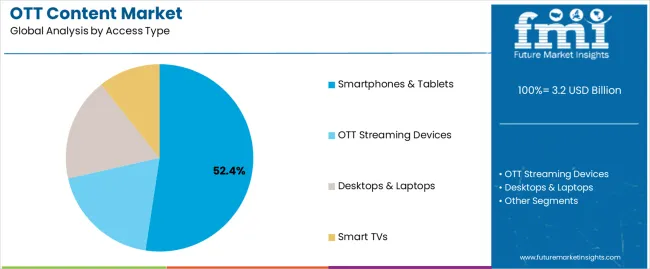
The smartphones and tablets segment, holding 52.40% of the access type category, has remained the leading access point due to widespread device penetration and the convenience of mobile streaming. Increasing affordability of smartphones, coupled with expanding 4G and 5G connectivity, has driven exponential growth in mobile viewership.
OTT platforms have optimized applications for mobile interfaces, providing seamless streaming, offline downloads, and multi-language support to enhance user experience. The portability of smartphones and tablets enables continuous engagement, especially among younger audiences with on-the-go entertainment preferences.
As data costs continue to decline and network coverage improves, the segment is expected to retain its dominance, further supported by technological upgrades in display resolution, audio quality, and device synchronization with smart TVs and wearables.
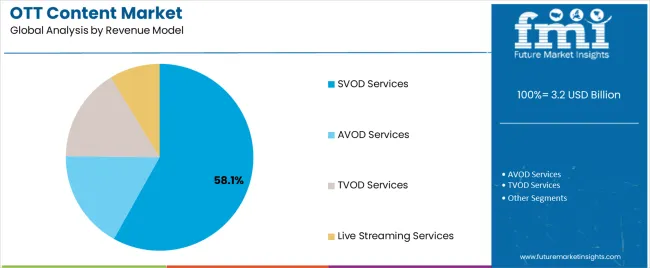
The SVOD services segment, representing 58.10% of the revenue model category, has become the primary revenue driver due to its predictable income stream and high customer retention rates. Subscribers are increasingly opting for ad-free experiences and exclusive content libraries offered under subscription-based models.
Market growth has been reinforced by multi-tier pricing strategies, flexible subscription options, and bundled service offerings that cater to diverse income groups. Continuous expansion of regional and global SVOD platforms, coupled with strategic partnerships with telecom providers and smart device manufacturers, has widened accessibility.
The integration of AI-based content curation and user analytics has further enhanced engagement and reduced churn With the shift from traditional cable subscriptions to digital platforms accelerating, the SVOD segment is expected to maintain its lead, underpinning long-term profitability and sustained market expansion.
Adoption of Hybrid Business Models Surges in the Market
OTT content platforms like Amazon Prime Videos and others are embracing a hybrid strategy that blends subscription-based services with ad-supported content offers, therefore revolutionizing their income streams. This approach maximizes income sources by attracting a larger audience base and satisfying both customers who would pay for premium membership services and those who prefer free material with ads included.
OTT services can retain competitive pricing and high levels of customer happiness while tapping into both subscription fees and advertising income to increase their potential for monetization and financial sustainability.
Implementing Decentralized CDNs Can Offer Strategic Advantages to Market Players
OTT streaming platforms can gain a competitive edge in content distribution optimization by utilizing P2P or blockchain-based decentralized content distribution networks (CDNs). Platforms improve scalability, lower latency, and guarantee high availability by distributing content throughout a decentralized network of nodes. This technology strategy improves overall quality of service (QoS) and user experience while supporting the platform's scalability goals.
Decentralized CDNs also enhance fault tolerance, lessening the effects of network outages or congestion. By utilizing this technology, the platform can more effectively satisfy the needs of its diversified and widely dispersed user base and establish itself as a leader in providing dependable and effective OTT streaming services.
Adoption of Next-gen Compression Algorithms Creates Opportunities in the Market
OTT providers have a strategic chance to improve video quality and optimize bandwidth use by implementing next-generation compression methods like AV1 or VVC. OTT platforms use more effective compression algorithms to provide higher-resolution material without sacrificing streaming speed. This technological development supports the platform's goals of delivering excellent streaming experiences at the lowest possible infrastructure cost.
Moreover, adaptive streaming is supported by next-generation compression algorithms, guaranteeing flawless playing on various devices and network configurations. Adopting these innovations places the platform in a leadership position for providing high-quality video content, drawing discriminating consumers and marketers looking for experiences with premium content.
| Attributes | Details |
|---|---|
| Trends |
|
| Opportunities |
|
| Challenges |
|
| Segment | Video (Content Type) |
|---|---|
| Value Share (2025) | 42.5% |
Based on content type, the video segment holds 42.5% of OTT content market shares in 2025.
| Segment | Smartphone/Tablets (Access Type) |
|---|---|
| Value Share (2025) | 49% |
Based on access type, the smartphones/tablets segment captured 49% of OTT content market shares in 2025.
| Countries | Value CAGR (2025 to 2035) |
|---|---|
| United States | 14.2% |
| Germany | 4.8% |
| Japan | 6.1% |
| China | 17.8% |
| Australia & New Zealand | 20.8% |
The demand for OTT content in the United States is anticipated to surge at a 14.2% CAGR through 2035.
The OTT content market growth in Germany is predicted to rise at a 4.8% CAGR through 2035.
The demand for OTT content in Japan is projected to increase at a 4.1% CAGR through 2035.
The OTT content market growth in China is forecasted at a staggering 17.8% CAGR through 2035.
The demand for OTT content in Australia & New Zealand is predicted to surge at an astronomical 20.8% CAGR through 2035.
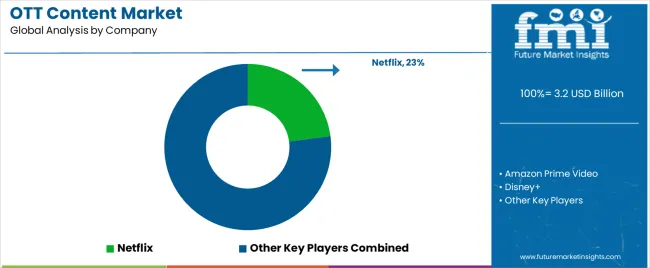
The OTT (Over-The-Top) content market is highly competitive, with prominent competitors vying for market share. Established behemoths such as Netflix, Amazon Prime Video, and Disney+ dominate due to their vast content libraries, worldwide reach, and smart alliances. As an industry pioneer, Netflix retains a strong position with a diverse portfolio of original content and a customer base that sets a high standard for rivals.
Recent Developments
The global OTT content market is estimated to be valued at USD 3.2 billion in 2025.
The market size for the OTT content market is projected to reach USD 14.6 billion by 2035.
The OTT content market is expected to grow at a 16.4% CAGR between 2025 and 2035.
The key product types in OTT content market are video, audio, games, mobile applications and communication.
In terms of access type, smartphones & tablets segment to command 52.4% share in the OTT content market in 2025.


Our Research Products

The "Full Research Suite" delivers actionable market intel, deep dives on markets or technologies, so clients act faster, cut risk, and unlock growth.

The Leaderboard benchmarks and ranks top vendors, classifying them as Established Leaders, Leading Challengers, or Disruptors & Challengers.

Locates where complements amplify value and substitutes erode it, forecasting net impact by horizon

We deliver granular, decision-grade intel: market sizing, 5-year forecasts, pricing, adoption, usage, revenue, and operational KPIs—plus competitor tracking, regulation, and value chains—across 60 countries broadly.

Spot the shifts before they hit your P&L. We track inflection points, adoption curves, pricing moves, and ecosystem plays to show where demand is heading, why it is changing, and what to do next across high-growth markets and disruptive tech

Real-time reads of user behavior. We track shifting priorities, perceptions of today’s and next-gen services, and provider experience, then pace how fast tech moves from trial to adoption, blending buyer, consumer, and channel inputs with social signals (#WhySwitch, #UX).

Partner with our analyst team to build a custom report designed around your business priorities. From analysing market trends to assessing competitors or crafting bespoke datasets, we tailor insights to your needs.
Supplier Intelligence
Discovery & Profiling
Capacity & Footprint
Performance & Risk
Compliance & Governance
Commercial Readiness
Who Supplies Whom
Scorecards & Shortlists
Playbooks & Docs
Category Intelligence
Definition & Scope
Demand & Use Cases
Cost Drivers
Market Structure
Supply Chain Map
Trade & Policy
Operating Norms
Deliverables
Buyer Intelligence
Account Basics
Spend & Scope
Procurement Model
Vendor Requirements
Terms & Policies
Entry Strategy
Pain Points & Triggers
Outputs
Pricing Analysis
Benchmarks
Trends
Should-Cost
Indexation
Landed Cost
Commercial Terms
Deliverables
Brand Analysis
Positioning & Value Prop
Share & Presence
Customer Evidence
Go-to-Market
Digital & Reputation
Compliance & Trust
KPIs & Gaps
Outputs
Full Research Suite comprises of:
Market outlook & trends analysis
Interviews & case studies
Strategic recommendations
Vendor profiles & capabilities analysis
5-year forecasts
8 regions and 60+ country-level data splits
Market segment data splits
12 months of continuous data updates
DELIVERED AS:
PDF EXCEL ONLINE
Cotton Candy Maker Market Forecast and Outlook 2025 to 2035
Mottled Test Liner Market Size and Share Forecast Outlook 2025 to 2035
Cotton Bags Market Size and Share Forecast Outlook 2025 to 2035
Bottle Sealing Wax Market Size and Share Forecast Outlook 2025 to 2035
Bottom Stacking Cone Market Size and Share Forecast Outlook 2025 to 2035
Bottle Filling Machines Market Size and Share Forecast Outlook 2025 to 2035
Bottle Shippers Market Size and Share Forecast Outlook 2025 to 2035
Pottery Ceramics Market Size and Share Forecast Outlook 2025 to 2035
Bottled Water Packaging Market Size and Share Forecast Outlook 2025 to 2035
Potting Compound Market Size and Share Forecast Outlook 2025 to 2035
Potty Training and Step Stools Market Size and Share Forecast Outlook 2025 to 2035
Cotton Processing Equipment Market Size and Share Forecast Outlook 2025 to 2035
Bottle Sticker Labelling Machine Market Size and Share Forecast Outlook 2025 to 2035
Tottle Containers Market Size and Share Forecast Outlook 2025 to 2035
Bottle Dividers Market Size and Share Forecast Outlook 2025 to 2035
Bottle Jack Market Size and Share Forecast Outlook 2025 to 2035
Bottles Market Analysis - Growth & Forecast 2025 to 2035
Cottonseed Meal Market Analysis by Product Type, Nature and End Use Industry Through 2025 to 2035
Cottonseed Oil Market Analysis – Size, Share & Forecast 2025-2035
Cotton Candy Machines Market - Fluffy & Sweet Treats 2025 to 2035

Thank you!
You will receive an email from our Business Development Manager. Please be sure to check your SPAM/JUNK folder too.
Chat With
MaRIA