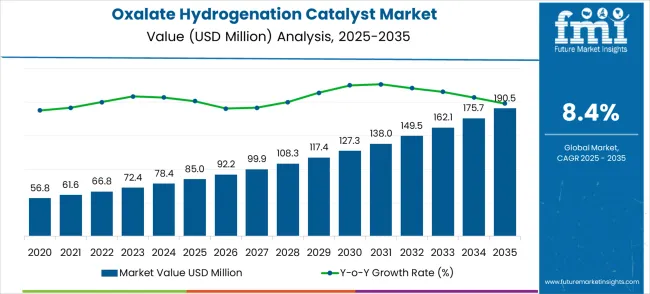
The oxalate hydrogenation catalyst market is projected at USD 85.0 million in 2025 and expected to reach USD 190.5 million by 2035, recording a CAGR of 8.4%. The market shows steady expansion from USD 56.8 million in 2020 to USD 85.0 million in 2025, reflecting growing adoption in chemical manufacturing and industrial hydrogenation processes. Early growth is supported by increasing demand for efficient catalysts that enhance oxalate conversion and yield, as well as a focus on process optimization across key production regions. Revenue trends indicate a steady upward trajectory, highlighting the market’s importance in enabling improved production efficiency and operational consistency.
| Metric | Value |
|---|---|
| Estimated Value in (2025E) | USD 85 million |
| Forecast Value in (2035F) | USD 190.5 million |
| Forecast CAGR (2025 to 2035) | 8.4% |
Between 2025 and 2030, the market grows from USD 85 million to USD 127.3 million, marking the first key breakpoint in the growth trajectory. This phase reflects accelerating adoption of high-performance catalysts in large-scale chemical production and industrial applications. The market gains momentum as existing plants upgrade catalytic systems and new facilities integrate optimized hydrogenation processes. Revenue increases are driven by both replacement demand and expansion into emerging production regions, reflecting the critical role of oxalate hydrogenation catalysts in enhancing process yield, reducing energy consumption, and supporting industrial efficiency improvements.
From 2030 to 2035, the market rises from USD 127.3 million to USD 190.5 million, representing the second major breakpoint and peak growth phase. During this period, adoption expands further due to increased production capacity, integration of advanced catalytic technologies, and growing industrial reliance on oxalate hydrogenation processes. The accelerated revenue growth is supported by rising demand in key end-use industries and replacement of conventional catalysts with higher-performance solutions. By the end of the decade, the market demonstrates strong maturity, with high adoption rates, operational efficiency gains, and sustained investment ensuring robust long-term growth and significant market expansion.
Market expansion is being supported by the increasing global demand for polyester production and the corresponding need for efficient chemical catalysts that can provide superior hydrogenation performance and high selectivity while maintaining process efficiency across various ethylene glycol manufacturing and chemical synthesis applications. Modern chemical manufacturers are increasingly focused on implementing catalytic solutions that can maximize conversion rates, minimize waste production, and provide consistent performance in demanding industrial environments. Oxalate hydrogenation catalysts' proven ability to deliver superior selectivity, enhanced conversion efficiency, and reliable catalytic performance make them essential components for contemporary chemical manufacturing and sustainable process solutions.
The growing emphasis on sustainable chemistry and green manufacturing is driving demand for oxalate hydrogenation catalysts that can support environmentally friendly production processes, reduce energy consumption, and enable efficient chemical conversion with minimal environmental impact. Chemical processing companies' preference for catalysts that combine high performance with operational reliability and cost-effectiveness is creating opportunities for innovative oxalate hydrogenation catalyst implementations. The rising influence of circular economy principles and sustainable manufacturing trends is also contributing to increased adoption of catalysts that can provide advanced chemical synthesis solutions without compromising process efficiency or environmental compliance.
The market is segmented by classification, application, and region. By classification, the market is divided into selectivity >95%, selectivity >98%, and others. Based on application, the market is categorized into polyester and antifreeze. Regionally, the market is divided into North America, Europe, East Asia, South Asia & Pacific, Latin America, and the Middle East & Africa.
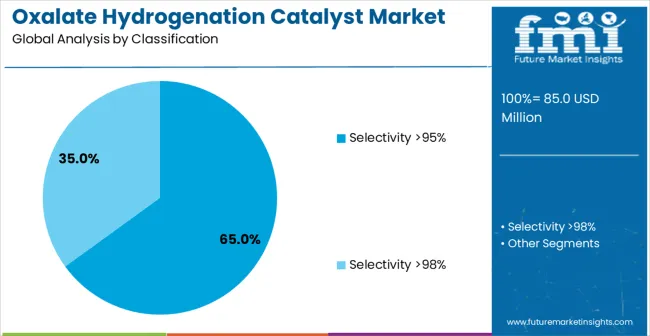
The selectivity >95% segment is projected to account for 65% of the oxalate hydrogenation catalyst market in 2025, confirming its role as the leading classification. This dominance stems from its superior cost-effectiveness, established process reliability, and proven performance across polyester manufacturing, ethylene glycol synthesis, and general chemical production. Selectivity >95% catalysts deliver consistent conversion rates and industrial efficiency, making them indispensable in cost-sensitive environments that demand operational predictability. Chemical plants continue to favor this grade due to its balance of efficiency, cost savings, and versatility in varied applications. Continuous investments in performance improvements and adoption of enhanced >95% selectivity catalyst systems are strengthening its market relevance. With the growing focus on large-scale process optimization and economic efficiency, this classification remains the foundation of modern chemical processing and is expected to retain its market-leading position throughout the forecast period.
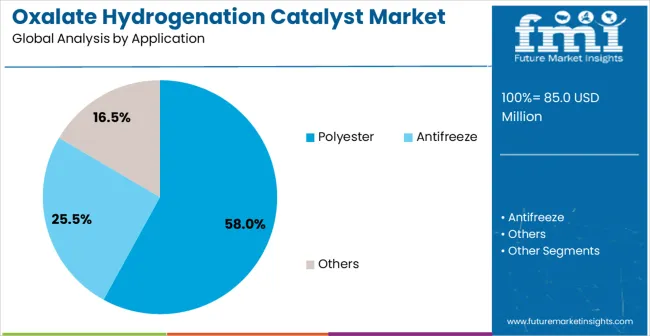
The polyester application segment is projected to represent 58% of oxalate hydrogenation catalyst demand in 2025, reaffirming its dominance in the global market. This segment is driven by the widespread use of catalysts in ethylene glycol production, which is essential for polyester manufacturing. Polyester producers adopt oxalate hydrogenation catalysts for their high selectivity, process stability, and capability to deliver superior output quality while maintaining cost efficiency. Continuous growth in polyester demand across textiles, packaging, and industrial applications reinforces the need for catalysts that can handle high production volumes while maintaining process reliability. Producers are increasingly adopting advanced catalyst systems that reduce operational costs while enhancing ethylene glycol yields. These catalysts play a pivotal role in meeting industry requirements for quality, efficiency, and economic performance. As polyester consumption expands globally, this application will remain the most influential demand driver for oxalate hydrogenation catalysts.
The oxalate hydrogenation catalyst market is advancing rapidly due to increasing demand for ethylene glycol production and growing adoption of efficient hydrogenation technologies that provide enhanced conversion rates and superior selectivity across diverse chemical manufacturing and polyester production applications. However, the market faces challenges, including raw material price volatility, technical expertise requirements, and the need for continuous catalyst regeneration investments. Innovation in sustainable catalyst formulations and process optimization continues to influence product development and market expansion patterns.
The growing adoption of selectivity >98% formulations and enhanced catalyst support systems is enabling chemical catalyst manufacturers to produce premium oxalate hydrogenation catalysts with superior conversion efficiency, enhanced selectivity characteristics, and advanced operational stability. Advanced catalyst systems provide improved chemical performance while allowing more efficient processing and consistent output across various reaction conditions and feedstock compositions. Manufacturers are increasingly recognizing the competitive advantages of advanced catalyst capabilities for product differentiation and premium market positioning in demanding chemical processing segments.
Catalyst manufacturers are focusing on developing advanced oxalate hydrogenation catalysts with higher activity, selectivity, and resistance to deactivation. Innovations include nanostructured catalysts, metal-promoted systems, and optimized supports that improve hydrogenation efficiency and operational stability. Longer catalyst lifespans reduce replacement frequency, lowering overall costs for industrial operators. These advancements enable enhanced performance under high-temperature, high-pressure conditions and minimize by-product formation, supporting large-scale ethylene glycol production while improving plant economics and operational reliability.
| Country | CAGR (2025-2035) |
|---|---|
| China | 11.3% |
| India | 10.5% |
| Germany | 9.7% |
| Brazil | 8.8% |
| USA | 8% |
| UK | 7.1% |
| Japan | 6.3% |
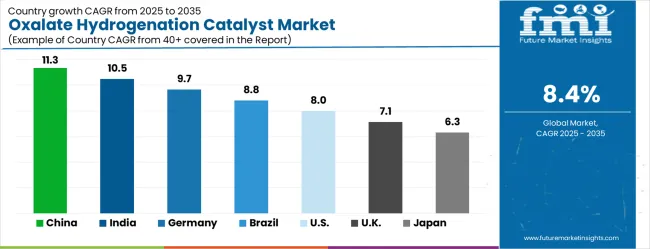
The oxalate hydrogenation catalyst market is experiencing strong growth globally, with China leading at an 11.3% CAGR through 2035, driven by the expanding chemical manufacturing industry, growing polyester production capacity, and significant investment in catalyst technology infrastructure development. India follows at 10.5%, supported by large-scale chemical industry expansion, emerging catalyst manufacturing facilities, and growing domestic demand for ethylene glycol and polyester production technologies. Germany shows growth at 9.7%, emphasizing technological innovation and premium catalyst development. Brazil records 8.8%, focusing on chemical industry expansion and catalyst technology modernization. The USA demonstrates 8% growth, prioritizing advanced chemical technologies and high-performance catalyst solutions. The UK exhibits 7.1% growth, emphasizing chemical manufacturing capabilities and quality catalyst adoption. Japan shows 6.3% growth, supported by precision chemical manufacturing excellence and advanced catalyst technology innovation.
The report covers an in-depth analysis of 40+ countries top-performing countries are highlighted below.
The oxalate hydrogenation catalyst market in China is forecasted to expand at a CAGR of 11.3% through 2035, making the country a global leader in this field. Expanding polyester production and chemical manufacturing hubs are increasing demand for efficient catalytic processes. Government policies promoting industrial modernization are encouraging the adoption of hydrogenation technologies across major production centers. Domestic producers and international companies are reinforcing their capabilities to meet both local and export requirements. Expanding infrastructure, high-volume manufacturing, and continuous investments in technology are positioning China as the most critical hub for catalyst demand. Rising industrial adoption is expected to sustain growth momentum across major polyester and chemical processing clusters.
The oxalate hydrogenation catalyst market in India is projected to grow at a CAGR of 10.5% through 2035, supported by expanding chemical clusters and rising polyester manufacturing demand. India is emerging as a strong market with domestic producers and international suppliers investing in distribution and production infrastructure. Government initiatives focusing on industrial modernization and efficiency are accelerating adoption of hydrogenation technologies. India’s chemical industry scale advantages are driving opportunities for cost-effective catalyst deployment across polyester units and other chemical processing facilities. With a rapidly developing supply chain, the country is positioned to become a competitive hub for advanced catalyst systems. Growing demand across major industrial corridors is expected to sustain long-term expansion.
The oxalate hydrogenation catalyst market in Germany is expected to register a CAGR of 9.7% through 2035, driven by technological innovation and advanced chemical industry capabilities. German manufacturers emphasize process efficiency and high precision, which has created strong demand for premium hydrogenation catalysts. Local and international companies are developing catalyst systems tailored to Germany’s strict quality and sustainability standards. Polyester production facilities are rapidly deploying high-performance catalysts to improve selectivity and reduce process losses. Continuous investments in technology development are enabling production of catalysts with enhanced lifespan and reliability. Germany remains a significant exporter of high-grade catalyst technologies, reinforcing its role as a leader in precision chemical processing solutions.
The oxalate hydrogenation catalyst market in Brazil is set to grow at a CAGR of 8.8% through 2035, supported by rising polyester demand and chemical sector expansion. Industrial clusters in Brazil are undergoing modernization, with increased adoption of hydrogenation technologies across polyester and specialty chemical facilities. Domestic manufacturers are building capabilities to reduce import reliance, while international suppliers are targeting Brazil’s industrial hubs to establish distribution networks. Government programs supporting chemical development are encouraging catalyst adoption throughout industrial corridors. Rising investment in polyester production is directly contributing to catalyst demand growth. Brazil’s position as both a domestic consumer and regional exporter strengthens its long-term market outlook.
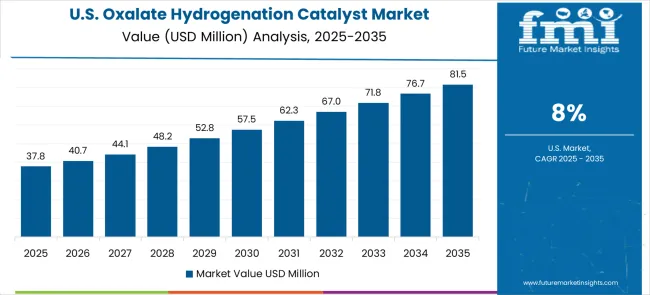
The oxalate hydrogenation catalyst market in the United States is projected to increase at a CAGR of 8% through 2035, fueled by advanced chemical infrastructure and preference for premium catalysts. The USA’s strong R&D ecosystem supports the development of catalysts with high selectivity, durability, and efficiency. Domestic producers are strengthening quality systems to supply both national and export markets. Polyester plants and specialty chemical producers are adopting advanced hydrogenation solutions to meet rising efficiency standards. Demand is reinforced by strong technological capabilities and continuous innovations in chemical process technologies. The USA is expected to remain a key hub for advanced catalysts, especially in industries requiring high-performance solutions.
The oxalate hydrogenation catalyst market in the United Kingdom is forecasted to grow at a CAGR of 7.1% through 2035, driven by the nation’s mature chemical industry and focus on process optimization. Established industrial hubs are increasingly using hydrogenation catalysts to improve polyester output and chemical processing quality. UK-based producers emphasize chemical innovation and are investing in catalyst technologies that provide long-term operational efficiency. International firms are building strategic presence to supply advanced catalysts across British industrial corridors. Strong demand from polyester manufacturing and specialty chemical facilities is supporting adoption. The UK’s well-established export sector is also encouraging widespread use of premium hydrogenation catalysts to meet global standards.
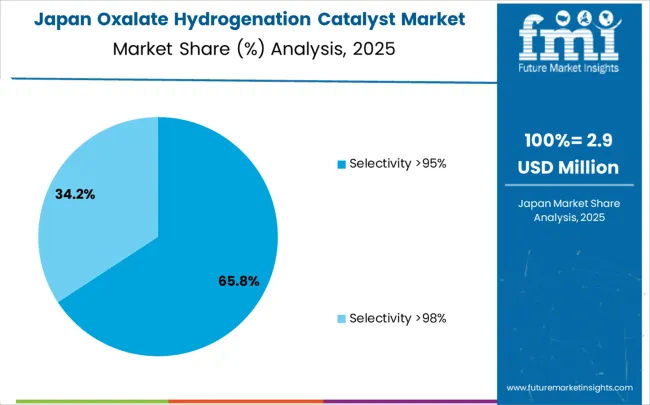
The oxalate hydrogenation catalyst market in Japan is projected to rise at a CAGR of 6.3% through 2035, supported by precision-focused chemical manufacturing and strong emphasis on advanced processing technologies. Japanese chemical companies prioritize process reliability, creating strong demand for catalysts that deliver high selectivity and durability. Domestic producers are expanding their specialized manufacturing capacity, while global suppliers view Japan as a hub for precision-driven catalyst adoption. Polyester and specialty chemical facilities are integrating hydrogenation catalysts that improve both efficiency and product quality. Japan’s industrial excellence and commitment to manufacturing reliability provide a strong base for continuous market expansion, supported by advanced research and development programs.
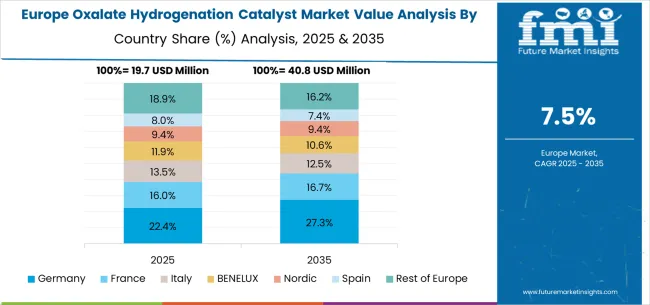
The oxalate hydrogenation catalyst market in Europe is projected to grow from USD 19.7 million in 2025 to USD 40.8 million by 2035, registering a CAGR of 7.5% over the forecast period. Germany will lead the market, rising from 22.4% in 2025 to 27.3% by 2035, supported by its advanced chemical manufacturing industry, catalyst production facilities, and chemical processing infrastructure. France will hold 16.0% in 2025, rising to 16.7% by 2035, reflecting steady adoption in specialty chemicals and polyester applications. Italy will represent 13.5% in 2025, easing slightly to 12.5% by 2035, reflecting moderate growth in chemical manufacturing.
The BENELUX region will account for 11.9% in 2025, softening to 10.6% by 2035, reflecting consolidation of smaller catalyst producers. The Nordic countries will hold 9.4% in 2025, declining to 9.0% by 2035, reflecting steady but limited catalyst adoption in the region. Spain will capture 7.4% in 2025, remaining stable at 7.4% by 2035, supported by moderate adoption in chemical facilities. Meanwhile, the Rest of Europe will decline from 18.9% in 2025 to 16.2% by 2035, reflecting slower growth in Eastern European chemical manufacturing hubs compared to Western Europe.
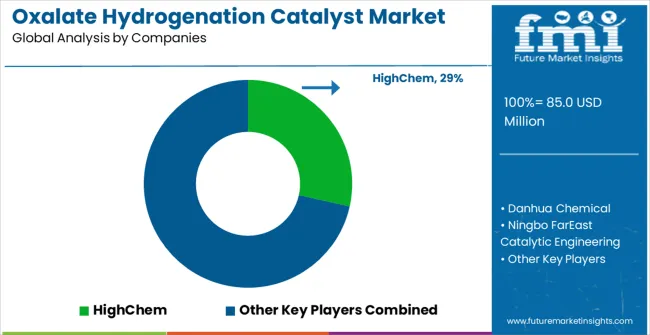
Competition in the oxalate hydrogenation catalyst market is shaped by specialized chemical manufacturers, advanced materials firms, and regional catalyst producers. HighChem Co., Ltd. provides high-performance hydrogenation catalysts with emphasis on activity, selectivity, and operational stability. Danhua Chemical Technology Co., Ltd. delivers catalysts engineered for efficiency and consistent performance in industrial-scale hydrogenation processes. Ningbo FarEast Catalytic Engineering Co., Ltd. focuses on precision-engineered catalysts tailored to specific chemical reactions, ensuring reproducible results and long-term reliability. Shanghai Pujing Chemical Co., Ltd. supplies catalysts designed for scalable production, combining material purity with optimized reaction kinetics.
Differentiation in the market is achieved through formulation expertise, performance optimization, and process adaptability. Haiso Technology Co., Ltd. develops advanced catalyst systems with attention to stability under variable reaction conditions and environmental compliance. Shangqiu Guolong New Materials Co., Ltd. emphasizes custom catalyst solutions that meet stringent industrial standards, providing technical support and application guidance to enhance operational efficiency. Product brochures highlight key attributes such as catalytic activity, selectivity, lifetime, and compatibility with various hydrogenation processes.
Technical specifications, validated performance data, and operational advantages are presented to reinforce reliability and usability. Emphasis is placed on process efficiency, reproducibility, and safe handling in industrial applications. Each brochure functions as a clear demonstration of product quality, technical sophistication, and market positioning, collectively illustrating the competitive dynamics and strategic differentiation in the oxalate hydrogenation catalyst market.
| Items | Values |
|---|---|
| Quantitative Units (2025) | USD 85 million |
| Classification | Selectivity >95%, Selectivity >98%, Others |
| Application | Polyester, Antifreeze |
| Regions Covered | North America, Europe, East Asia, South Asia & Pacific, Latin America, Middle East & Africa |
| Countries Covered | United States, Canada, United Kingdom, Germany, France, China, Japan, South Korea, India, Brazil, Australia and 40+ countries |
| Key Companies Profiled | HighChem Co., Ltd., Danhua Chemical Technology Co., Ltd., Ningbo FarEast Catalytic Engineering Co., Ltd., Shanghai Pujing Chemical Co., Ltd., Haiso Technology Co., Ltd., and Shangqiu Guolong New Materials Co., Ltd. |
| Additional Attributes | Dollar sales by classification and application category, regional demand trends, competitive landscape, technological advancements in catalyst systems, selectivity innovation, process development, and manufacturing optimization |
North America
Europe
East Asia
South Asia & Pacific
Latin America
Middle East & Africa
The global oxalate hydrogenation catalyst market is estimated to be valued at USD 85.0 million in 2025.
The market size for the oxalate hydrogenation catalyst market is projected to reach USD 190.5 million by 2035.
The oxalate hydrogenation catalyst market is expected to grow at a 8.4% CAGR between 2025 and 2035.
The key product types in oxalate hydrogenation catalyst market are selectivity >95% and selectivity >98%.
In terms of application, polyester segment to command 58.0% share in the oxalate hydrogenation catalyst market in 2025.


Our Research Products

The "Full Research Suite" delivers actionable market intel, deep dives on markets or technologies, so clients act faster, cut risk, and unlock growth.

The Leaderboard benchmarks and ranks top vendors, classifying them as Established Leaders, Leading Challengers, or Disruptors & Challengers.

Locates where complements amplify value and substitutes erode it, forecasting net impact by horizon

We deliver granular, decision-grade intel: market sizing, 5-year forecasts, pricing, adoption, usage, revenue, and operational KPIs—plus competitor tracking, regulation, and value chains—across 60 countries broadly.

Spot the shifts before they hit your P&L. We track inflection points, adoption curves, pricing moves, and ecosystem plays to show where demand is heading, why it is changing, and what to do next across high-growth markets and disruptive tech

Real-time reads of user behavior. We track shifting priorities, perceptions of today’s and next-gen services, and provider experience, then pace how fast tech moves from trial to adoption, blending buyer, consumer, and channel inputs with social signals (#WhySwitch, #UX).

Partner with our analyst team to build a custom report designed around your business priorities. From analysing market trends to assessing competitors or crafting bespoke datasets, we tailor insights to your needs.
Supplier Intelligence
Discovery & Profiling
Capacity & Footprint
Performance & Risk
Compliance & Governance
Commercial Readiness
Who Supplies Whom
Scorecards & Shortlists
Playbooks & Docs
Category Intelligence
Definition & Scope
Demand & Use Cases
Cost Drivers
Market Structure
Supply Chain Map
Trade & Policy
Operating Norms
Deliverables
Buyer Intelligence
Account Basics
Spend & Scope
Procurement Model
Vendor Requirements
Terms & Policies
Entry Strategy
Pain Points & Triggers
Outputs
Pricing Analysis
Benchmarks
Trends
Should-Cost
Indexation
Landed Cost
Commercial Terms
Deliverables
Brand Analysis
Positioning & Value Prop
Share & Presence
Customer Evidence
Go-to-Market
Digital & Reputation
Compliance & Trust
KPIs & Gaps
Outputs
Full Research Suite comprises of:
Market outlook & trends analysis
Interviews & case studies
Strategic recommendations
Vendor profiles & capabilities analysis
5-year forecasts
8 regions and 60+ country-level data splits
Market segment data splits
12 months of continuous data updates
DELIVERED AS:
PDF EXCEL ONLINE
Catalyst Bins Market Insights – Growth & Forecast 2025 to 2035
Biocatalyst Market Size and Share Forecast Outlook 2025 to 2035
Nanocatalysts Market Size and Share Forecast Outlook 2025 to 2035
Titanium Catalyst for Polyester Market Size and Share Forecast Outlook 2025 to 2035
Chemical Catalyst Market Size and Share Forecast Outlook 2025 to 2035
Refinery Catalyst Market Growth - Trends & Forecast 2025 to 2035
Polyolefin Catalyst Market Size and Share Forecast Outlook 2025 to 2035
UK Refinery Catalyst Market Insights – Growth, Applications & Outlook 2025-2035
Polyurethane Catalyst Market Size and Share Forecast Outlook 2025 to 2035
USA Refinery Catalyst Market Report - Trends & Innovations 2025 to 2035
BDO Synthesis Catalyst Market Size and Share Forecast Outlook 2025 to 2035
Environmental Catalysts Market Trends & Growth 2025 to 2035
Copper Bismuth Catalyst Market Size and Share Forecast Outlook 2025 to 2035
Japan Refinery Catalyst Market Report – Trends, Demand & Industry Forecast 2025-2035
ASEAN Refinery Catalyst Market Analysis
Aluminum-Nickel Catalyst Market Size and Share Forecast Outlook 2025 to 2035
Emission Control Catalyst for Small Engines Market - Size, Share, and Forecast 2025 to 2035
Motorcycle Emission Control Catalyst Market Growth - Trends & Forecast 2025 to 2035
High-Performance Catalyst Market Trend Analysis Based on Product, End-Use, and Region 2025-2035
Germany Refinery Catalyst Market Analysis – Size, Share & Forecast 2025-2035

Thank you!
You will receive an email from our Business Development Manager. Please be sure to check your SPAM/JUNK folder too.
Chat With
MaRIA