Particulate Matter Monitoring Market Size and Share Forecast Outlook 2025 to 2035

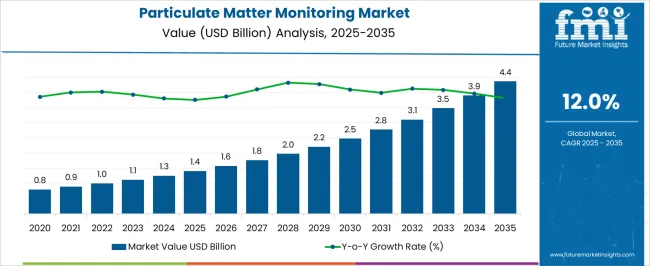
The particulate matter monitoring market is estimated to be valued at USD 1.4 billion in 2025 and is projected to reach USD 4.4 billion by 2035, registering a compound annual growth rate (CAGR) of 12.0% over the forecast period.

The particulate matter monitoring market, valued at USD 1.4 billion in 2025 and expected to reach USD 4.4 billion by 2035 at a CAGR of 12.0%, reflects a strong upward trajectory along the market maturity curve. The data trend demonstrates rapid year-on-year growth, indicating that the industry is currently moving from the introduction stage toward an early growth phase within the adoption lifecycle. Rising awareness of air quality standards, stringent environmental regulations, and technological advancements in sensor miniaturization are accelerating adoption across industrial, commercial, and governmental applications. During the early phase, adoption is being driven by industries under compliance pressure, along with urban administrations deploying smart city solutions. The growth between 2025 and 2030, from USD 1.4 billion to nearly USD 2.5 billion, shows strong penetration among early adopters such as manufacturing, energy, and automotive sectors.

The acceleration post-2030, reaching USD 4.4 billion by 2035, reflects a transition into the maturity stage, where broader adoption across residential, commercial, and public health monitoring is expected. The adoption lifecycle indicates innovators and early adopters have established the foundation, while the early majority is entering, driven by declining costs and improved reliability of devices. By 2035, the market will approach late growth, with adoption becoming mainstream across global regions, though opportunities will remain in emerging economies with weaker monitoring infrastructure.
Quick Stats for Particulate Matter Monitoring Market

  • Particulate Matter Monitoring Market Value (2025): USD 1.4 billion
  • Particulate Matter Monitoring Market Forecast Value (2035): USD 4.4 billion
  • Particulate Matter Monitoring Market Forecast CAGR: 12.0%
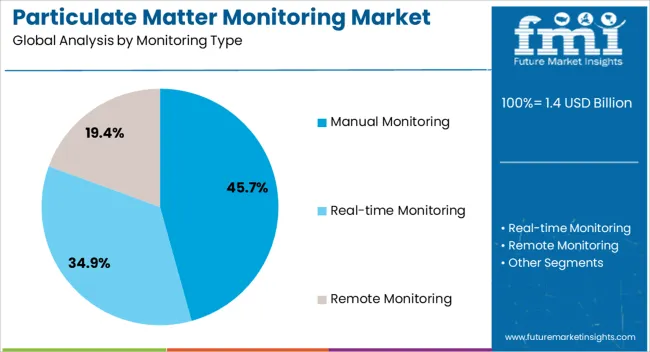
  • Leading Segment in Particulate Matter Monitoring Market in 2025: Manual Monitoring (45.7%)
  • Key Growth Regions in Particulate Matter Monitoring Market: North America, Asia-Pacific, Europe
  • Top Players in Particulate Matter Monitoring Market: 3M Company, ACOEM Group, Aeroqual Group Limited, AMETEK, Beckman Coulter, Inc., ECOM America, Ltd., Emerson Electric Co., GrayWolf Sensing Solutions, Horiba, Ltd., Kaiterra, Kanomax, Inc., Rupprecht & Patashnick Co., Inc. (R&P), Siemens AG, Teledyne API, Thermo Fisher Scientific, Inc., TSI Incorporated

Particulate Matter Monitoring Market Market Value Analysis

Particulate Matter Monitoring Market Key Takeaways

Metric Value
Particulate Matter Monitoring Market Estimated Value in (2025 E) USD 1.4 billion
Particulate Matter Monitoring Market Forecast Value in (2035 F) USD 4.4 billion
Forecast CAGR (2025 to 2035) 12.0%

The particulate matter monitoring market represents a critical segment within the global environmental monitoring and air quality management industry, emphasizing public health, regulatory compliance, and industrial safety. Within the broader air quality monitoring systems sector, it accounts for about 6.1%, driven by stricter regulations and rising awareness of air pollution impacts. In the environmental testing and measurement equipment segment, it holds nearly 5.3%, reflecting demand from governments, research institutions, and industrial facilities. Across the emission control and pollution management market, the share is 4.7%, supporting integration into pollution source tracking and compliance monitoring. Within the smart city and urban environmental monitoring category, it represents 4.2%, highlighting adoption of IoT-based air quality sensors.

In the healthcare and occupational safety monitoring sector, it secures 3.8%, emphasizing workplace air quality assessments and exposure tracking. Recent developments in this market have focused on sensor miniaturization, digital connectivity, and real-time data analytics. Innovations include low-cost portable PM2.5 and PM10 sensors, AI-driven predictive monitoring platforms, and satellite-assisted air quality mapping. Key players are collaborating with smart city planners, environmental agencies, and industrial operators to deploy large-scale monitoring networks. Adoption of cloud-based data platforms, remote calibration, and mobile app integration is gaining traction to improve accessibility and decision-making. The hybrid monitoring systems combining optical, gravimetric, and laser-based detection technologies are being developed to enhance accuracy and coverage. These trends demonstrate how technology, regulation, and health priorities are shaping the market.

Why is the Particulate Matter Monitoring Market Growing?

The particulate matter monitoring market is experiencing notable growth driven by increasing public awareness of air pollution’s impact on health, stricter environmental regulations, and the rising need for real time air quality assessment. Advancements in sensor technology, miniaturization, and data integration capabilities have enhanced the accuracy and accessibility of particulate monitoring systems.

Government initiatives and corporate sustainability goals are further accelerating deployment in both urban and industrial environments. The growing adoption of air quality monitoring in smart city infrastructure and commercial buildings is expanding the market’s scope.

With heightened concern over respiratory illnesses linked to fine particulate matter exposure, the outlook for the market remains strong, supported by sustained demand from regulatory bodies, research institutions, and private enterprises seeking continuous environmental compliance and public health protection.

Segmental Analysis

The particulate matter monitoring market is segmented by monitoring type, particle size, application, end-use industry, and geographic regions. By monitoring type, particulate matter monitoring market is divided into manual monitoring, real-time monitoring, and remote monitoring. In terms of particle size, particulate matter monitoring market is classified into PM 1 (1 Micrometer or less) Dia, PM 2.5 (2.5 Micrometer or less) Dia, PM 5 (5 Micrometer or less) Dia, and PM 10 (10 Micrometer or less) Dia. Based on application, particulate matter monitoring market is segmented into indoor air quality (IAQ) monitoring and outdoor air quality monitoring.

By end-use industry, particulate matter monitoring market is segmented into power generation, oil & gas, chemical & petrochemical, transportation & logistics, healthcare, research institutions, and others. Regionally, the particulate matter monitoring industry is classified into North America, Latin America, Western Europe, Eastern Europe, Balkan & Baltic Countries, Russia & Belarus, Central Asia, East Asia, South Asia & Pacific, and the Middle East & Africa.
Insights into the Manual Monitoring Segment

Particulate Matter Monitoring Market Analysis By Monitoring Type

The manual monitoring segment is expected to hold 45.7% of the total market revenue by 2025 within the monitoring type category, making it a leading segment. Its prominence is driven by the reliability, cost effectiveness, and ease of deployment in diverse environmental conditions.

Manual methods remain preferred in regions with limited access to automated monitoring infrastructure and where periodic sampling is sufficient to meet regulatory requirements. Additionally, the lower maintenance costs and simpler calibration processes contribute to its sustained use.

The flexibility to operate without continuous power supply further enhances its suitability for field studies and remote locations, ensuring continued adoption across developing and developed markets.
Insights into the PM 1 Particle Size Segment

Particulate Matter Monitoring Market Analysis By Particle Size

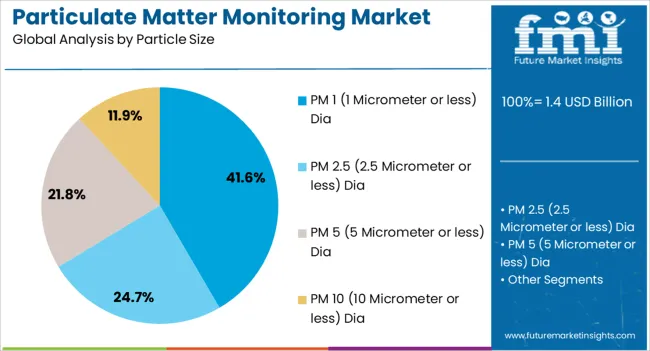
The PM 1 particle size category is projected to account for 41.6% of the total market share by 2025, representing a significant focus area. This trend is influenced by growing evidence linking ultrafine particles to severe health effects due to their ability to penetrate deep into the respiratory system and enter the bloodstream.

Increased demand for precision monitoring of PM 1 has been supported by advances in sensor sensitivity and calibration technologies. Regulatory frameworks and indoor air quality standards are increasingly recognizing the importance of PM 1 data, particularly in healthcare facilities, schools, and sensitive industrial environments.

These factors have positioned PM 1 monitoring as a priority in both environmental research and public health protection.
Insights into the Indoor Air Quality Monitoring Application Segment

Particulate Matter Monitoring Market Analysis By Application

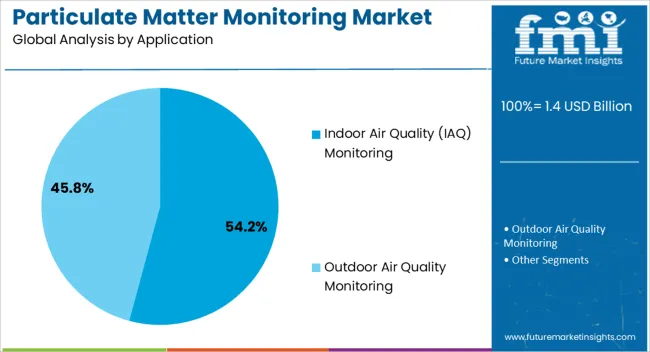
The indoor air quality monitoring application segment is forecasted to contribute 54.2% of the total market revenue by 2025, making it the most dominant application. This growth is being propelled by rising awareness of indoor pollution sources such as dust, combustion particles, and chemical emissions from furnishings and equipment.

Corporate wellness programs, building certifications, and post pandemic concerns about ventilation quality have also accelerated adoption. Real time monitoring systems for indoor spaces are increasingly integrated into smart building management systems, enabling continuous optimization of air filtration and ventilation.

As indoor environments are closely tied to occupant health, productivity, and comfort, the demand for robust indoor air quality monitoring solutions is expected to remain strong, reinforcing its leadership in the application category.

What are the Drivers, Restraints, and Key Trends of the Particulate Matter Monitoring Market?

The market has emerged as a critical sector due to increasing environmental awareness and public health concerns associated with fine particle exposure. Rising pollution levels across industrial, residential, and transportation sectors have resulted in heightened monitoring demand. Advanced technologies such as laser scattering and IoT-enabled sensors have enhanced the ability to detect particles like PM2.5 and PM10 with improved accuracy. Regulatory requirements have accelerated installations across regions, while community initiatives and smart infrastructure programs are also creating significant opportunities for growth within this segment.

Regulatory Pressure Driving Industry Adoption

Stringent environmental regulations have been implemented across several regions to reduce the harmful effects of airborne pollutants. Regulatory authorities including the United States Environmental Protection Agency and the European Environment Agency have mandated continuous emissions monitoring. Industrial sectors such as power generation, cement manufacturing, oil refining, and mining have been required to integrate monitoring solutions to ensure compliance with permissible emission limits. Government funded projects in developing economies have also focused on deploying particulate matter monitoring devices to control rising pollution. The inclusion of such systems within smart city initiatives and environmental health monitoring programs has amplified demand globally.

Role of Technological Advancement in Enhancing Monitoring Accuracy

Technological innovation has significantly strengthened the capabilities of particulate matter monitoring systems. Modern solutions have been designed with features such as laser diffraction, gravimetric methods, and optical particle counters that ensure high precision. Integration of IoT has enabled continuous data collection and real time analysis across remote and industrial locations. Cloud based platforms have enhanced predictive monitoring while supporting regulatory reporting requirements. Portable and low power consumption devices have expanded accessibility for research institutions and community driven monitoring programs. Manufacturers have been focusing on compact designs and improved durability, making the systems more reliable for long term environmental and occupational applications.

Increasing Awareness of Health and Environmental Hazards

Health concerns associated with particulate matter have been driving market expansion across diverse regions. Scientific studies have linked prolonged exposure to fine particles with asthma, lung disease, and cardiovascular complications. As a result, hospitals, schools, and public spaces have witnessed installations of monitoring devices to ensure safer environments. Growing involvement of non-governmental organizations, research institutions, and local communities in air quality projects has supported widespread adoption. Publicly accessible air quality data has encouraged informed decision making by individuals and policy makers. This increasing awareness has created a favorable environment for sustained investments in particulate matter monitoring solutions across industrial and residential landscapes.

Cost Barriers and Technical Challenges in Implementation

Despite strong growth potential, cost remains a significant challenge within the particulate matter monitoring market. Advanced systems require high capital investment along with recurring maintenance costs for calibration, spare parts, and data management. Small and medium sized industries in emerging economies face difficulties in adopting such solutions. In addition, environmental conditions including temperature and humidity variations can affect monitoring accuracy, creating operational concerns. Lack of standardization in measurement methods across global markets has also led to inconsistencies in data reporting. Addressing these barriers through affordable solutions, enhanced calibration techniques, and international cooperation on measurement standards has become crucial for long term adoption.
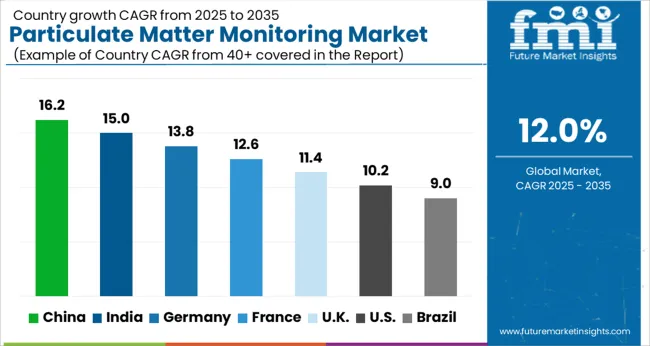
Analysis of Particulate Matter Monitoring Market By Key Countries

Particulate Matter Monitoring Market Cagr Analysis By Country

Country CAGR
China 16.2%
India 15.0%
Germany 13.8%
France 12.6%
UK 11.4%
USA 10.2%
Brazil 9.0%

The market is projected to expand at a CAGR of 12.0% between 2025 and 2035, fueled by stricter air quality regulations, technological innovation, and rising awareness of pollution control. India recorded 15.0%, supported by nationwide initiatives to strengthen air quality monitoring networks. Germany registered 13.8%, with growth influenced by stringent environmental standards and advanced industrial applications. China led the market with 16.2%, reflecting large-scale infrastructure deployment and regulatory enforcement. The United Kingdom posted 11.4%, shaped by growing adoption of smart monitoring technologies, while the United States reached 10.2%, driven by investments in pollution tracking and data-driven environmental management. The landscape illustrates how both developed and emerging markets are intensifying efforts to address air quality challenges. This report includes insights on 40+ countries; the top markets are shown here for reference.

Expansion of Particulate Matter Monitoring Market in China

China is expected to record a CAGR of 16.2%, supported by stringent air quality regulations, government initiatives on emission reduction, and increased deployment of monitoring systems in industrial hubs. Adoption has been reinforced by investments in smart city projects where continuous monitoring is a priority. Domestic manufacturers focus on cost effective sensor based systems, while international players provide advanced analyzers and real time monitoring solutions. Growing awareness among citizens regarding health impacts of air pollution has further boosted adoption across multiple sectors.

  • China had more than 6,500 continuous emission monitoring systems installed in 2023.
  • Over 40% of new installations in 2023 were sensor based portable devices.
  • Smart city projects accounted for nearly 30% of new demand in 2023.

Growth Dynamics of Particulate Matter Monitoring Market in India

India is forecast to grow at a CAGR of 15.0%, driven by rapid increase in industrial monitoring requirements and expansion of ambient air quality stations in urban regions. Adoption has been reinforced by government led air quality improvement programs and integration of IoT enabled devices for real time reporting. Domestic producers collaborate with research institutes for calibration technologies, while imports of advanced analyzers from global suppliers remain vital. Awareness of respiratory health issues is also creating demand for low cost portable monitors among consumers.
  • India operated over 1,200 government air quality stations in 2023.
  • Portable particulate matter monitors grew by nearly 22% year on year in 2023.
  • Industrial sector installations accounted for more than 45% of demand in 2023.

Market Analysis of Particulate Matter Monitoring in Germany

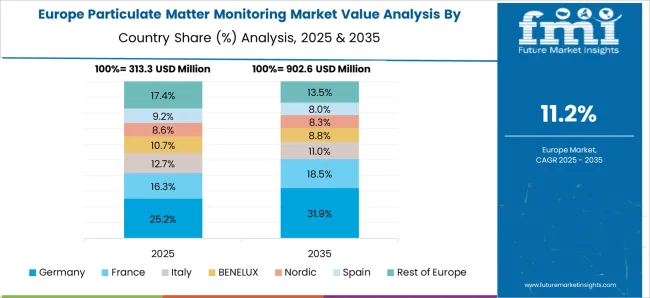
Particulate Matter Monitoring Market Europe Country Market Share Analysis, 2025 & 2035

Germany is anticipated to expand at a CAGR of 13.8%, supported by strict EU emission control laws and strong adoption of advanced environmental monitoring technologies. Adoption has been reinforced by the automotive sector, which relies on particulate matter testing for compliance with Euro 6 and upcoming Euro 7 standards. Domestic companies emphasize precision and integration with cloud based platforms for data reporting. Collaboration between government bodies and environmental agencies is further driving research into long term air quality impacts.

  • Germany conducted monitoring through over 600 certified air quality stations in 2023.
  • More than 50% of new demand came from the automotive testing sector in 2023.
  • Cloud connected particulate matter analyzers increased by nearly 18% year on year in 2023.

Demand Forecast for Particulate Matter Monitoring in the United Kingdom

The United Kingdom market is projected to grow at a CAGR of 11.4%, supported by regulatory compliance needs and increasing deployment of community based monitoring networks. Adoption has been reinforced by local councils implementing real time pollution alert systems. Imports from European suppliers remain important, while domestic distributors focus on low maintenance solutions for local governments and industries. Growing public awareness of health impacts has also led to higher adoption of indoor air monitoring devices across residential and office spaces.
  • The U K operated nearly 300 government managed air quality stations in 2023.
  • Community based monitoring projects increased by almost 20% year on year in 2023.
  • Indoor air monitoring device sales grew by nearly 15% in 2023.

Future Growth of Particulate Matter Monitoring Market in the United States

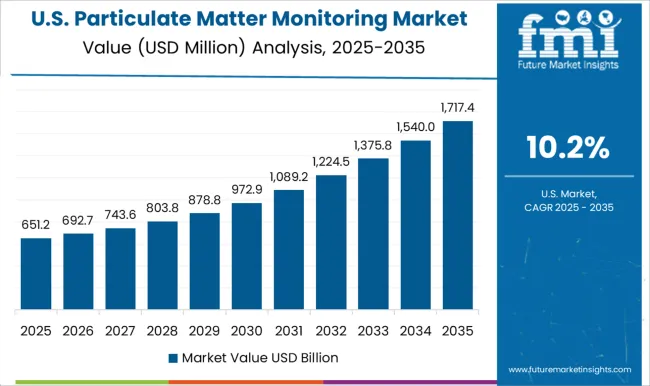
Particulate Matter Monitoring Market Country Value Analysis

The United States is expected to advance at a CAGR of 10.2%, supported by industrial compliance requirements under EPA guidelines and an expanding network of local air monitoring stations. Adoption has been reinforced by strong participation of universities and research institutions in developing low cost sensor technologies. Domestic players invest in wireless and IoT enabled monitoring systems, while demand from healthcare and workplace safety segments continues to grow. The combination of regulatory enforcement and public interest ensures a steady market outlook.
  • The U S operated over 1,000 regulatory monitoring stations in 2023.
  • Healthcare sector demand for particulate monitors rose by nearly 12% in 2023.
  • IoT enabled systems accounted for almost 35% of new installations in 2023.

Competitive Landscape of Particulate Matter Monitoring Market

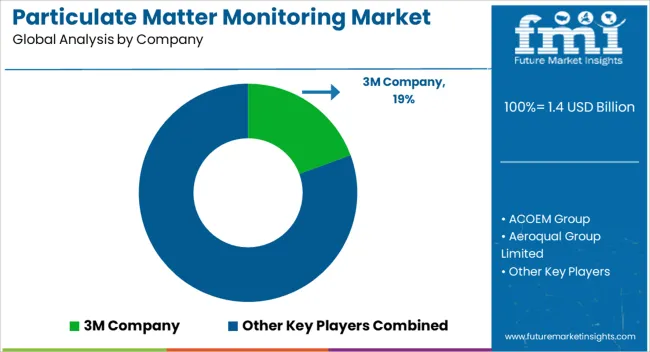
Particulate Matter Monitoring Market Analysis By Company

The market is marked by the presence of global conglomerates, specialized sensor developers, and advanced analytical equipment providers. Thermo Fisher Scientific, Inc., 3M Company, Siemens AG, and Emerson Electric Co. lead the industry with comprehensive portfolios, large-scale distribution networks, and integration of real-time monitoring solutions for industrial and environmental applications. AMETEK, Beckman Coulter, Inc., and Teledyne API enhance competition by offering precision instruments and laboratory-grade analyzers that support compliance with strict air quality regulations.

Specialized companies such as Aeroqual Group Limited, GrayWolf Sensing Solutions, Kanomax, Inc., and Kaiterra focus on portable and IoT-enabled sensors catering to urban monitoring and indoor air quality management. Horiba, Ltd. and ACOEM Group strengthen their positions through innovation in continuous emission monitoring systems, while Rupprecht & Patashnick Co., Inc. (R&P) and TSI Incorporated are recognized for research-grade instruments trusted in regulatory and academic use. The market’s competition is shaped by technological advancements in low-cost sensors, integration with cloud platforms, and the shift toward predictive air quality monitoring. Companies that emphasize miniaturization, data analytics, and compliance with global emission standards are expected to maintain competitive advantage across industrial, governmental, and consumer-driven segments.

Key Players in the Particulate Matter Monitoring Market

  • 3M Company
  • ACOEM Group
  • Aeroqual Group Limited
  • AMETEK
  • Beckman Coulter, Inc.
  • ECOM America, Ltd.
  • Emerson Electric Co.
  • GrayWolf Sensing Solutions
  • Horiba, Ltd.
  • Kaiterra
  • Kanomax, Inc.
  • Rupprecht & Patashnick Co., Inc. (R&P)
  • Siemens AG
  • Teledyne API
  • Thermo Fisher Scientific, Inc.
  • TSI Incorporated

Scope of the Report

Item Value
Quantitative Units USD 1.4 billion
Monitoring Type Manual Monitoring, Real-time Monitoring, and Remote Monitoring
Particle Size PM 1 (1 Micrometer or less) Dia, PM 2.5 (2.5 Micrometer or less) Dia, PM 5 (5 Micrometer or less) Dia, and PM 10 (10 Micrometer or less) Dia
Application Indoor Air Quality (IAQ) Monitoring and Outdoor Air Quality Monitoring
End-use Industry Power Generation, Oil & Gas, Chemical & Petrochemical, Transportation & logistics, Healthcare, Research institutions, and Others
Regions Covered North America, Europe, Asia-Pacific, Latin America, Middle East & Africa
Country Covered United States, Canada, Germany, France, United Kingdom, China, Japan, India, Brazil, South Africa
Key Companies Profiled 3M Company, ACOEM Group, Aeroqual Group Limited, AMETEK, Beckman Coulter, Inc., ECOM America, Ltd., Emerson Electric Co., GrayWolf Sensing Solutions, Horiba, Ltd., Kaiterra, Kanomax, Inc., Rupprecht & Patashnick Co., Inc. (R&P), Siemens AG, Teledyne API, Thermo Fisher Scientific, Inc., and TSI Incorporated
Additional Attributes Dollar sales by monitoring device type and application, demand dynamics across industrial, environmental, and residential sectors, regional trends in air quality monitoring adoption, innovation in sensor accuracy, IoT connectivity, and real-time analytics, environmental impact of emissions tracking and regulatory compliance, and emerging use cases in smart cities, workplace safety, and portable personal monitoring devices.

Particulate Matter Monitoring Market by Segments

Monitoring Type:

  • Manual Monitoring
  • Real-time Monitoring
  • Remote Monitoring

Particle Size:

  • PM 1 (1 Micrometer or less) Dia
  • PM 2.5 (2.5 Micrometer or less) Dia
  • PM 5 (5 Micrometer or less) Dia
  • PM 10 (10 Micrometer or less) Dia

Application:

  • Indoor Air Quality (IAQ) Monitoring
  • Outdoor Air Quality Monitoring

End-use Industry:

  • Power Generation
  • Oil & Gas
  • Chemical & Petrochemical
  • Transportation & logistics
  • Healthcare
  • Research institutions
  • Others

Region:

  • North America
    • USA
    • Canada
    • Mexico
  • Latin America
    • Brazil
    • Chile
    • Rest of Latin America
  • Western Europe
    • Germany
    • UK
    • Italy
    • Spain
    • France
    • Nordic
    • BENELUX
    • Rest of Western Europe
  • Eastern Europe
    • Russia
    • Poland
    • Hungary
    • Balkan & Baltic
    • Rest of Eastern Europe
  • East Asia
    • China
    • Japan
    • South Korea
  • South Asia and Pacific
    • India
    • ASEAN
    • Australia & New Zealand
    • Rest of South Asia and Pacific
  • Middle East & Africa
    • Kingdom of Saudi Arabia
    • Other GCC Countries
    • Turkiye
    • South Africa
    • Other African Union
    • Rest of Middle East & Africa

Table of Content

  1. Executive Summary
    • Global Market Outlook
    • Demand-side Trends
    • Supply-side Trends
    • Technology Roadmap Analysis
    • Analysis and Recommendations
  2. Market Overview
    • Market Coverage / Taxonomy
    • Market Definition / Scope / Limitations
  3. Market Background
    • Market Dynamics
      • Drivers
      • Restraints
      • Opportunity
      • Trends
    • Scenario Forecast
      • Demand in Optimistic Scenario
      • Demand in Likely Scenario
      • Demand in Conservative Scenario
    • Opportunity Map Analysis
    • Product Life Cycle Analysis
    • Supply Chain Analysis
    • Investment Feasibility Matrix
    • Value Chain Analysis
    • PESTLE and Porter’s Analysis
    • Regulatory Landscape
    • Regional Parent Market Outlook
    • Production and Consumption Statistics
    • Import and Export Statistics
  4. Global Particulate Matter Monitoring Market Analysis 2020-2024 and Forecast, 2025-2035
    • Historical Market Size Value (USD Mn) Analysis, 2020-2024
    • Current and Future Market Size Value (USD Mn) Projections, 2025-2035
      • Y-o-Y Growth Trend Analysis
      • Absolute $ Opportunity Analysis
  5. Global Particulate Matter Monitoring Market Pricing Analysis 2020-2024 and Forecast 2025-2035
  6. Global Particulate Matter Monitoring Market Analysis 2020-2024 and Forecast 2025-2035, By Monitoring Type
    • Introduction / Key Findings
    • Historical Market Size Value (USD Mn) Analysis By Monitoring Type , 2020-2024
    • Current and Future Market Size Value (USD Mn) Analysis and Forecast By Monitoring Type , 2025-2035
      • Manual Monitoring
      • Real-time Monitoring
      • Remote Monitoring
    • Y-o-Y Growth Trend Analysis By Monitoring Type , 2020-2024
    • Absolute $ Opportunity Analysis By Monitoring Type , 2025-2035
  7. Global Particulate Matter Monitoring Market Analysis 2020-2024 and Forecast 2025-2035, By Particle Size
    • Introduction / Key Findings
    • Historical Market Size Value (USD Mn) Analysis By Particle Size, 2020-2024
    • Current and Future Market Size Value (USD Mn) Analysis and Forecast By Particle Size, 2025-2035
      • PM 1 (1 Micrometer or less) Dia
      • PM 2.5 (2.5 Micrometer or less) Dia
      • PM 5 (5 Micrometer or less) Dia
      • PM 10 (10 Micrometer or less) Dia
    • Y-o-Y Growth Trend Analysis By Particle Size, 2020-2024
    • Absolute $ Opportunity Analysis By Particle Size, 2025-2035
  8. Global Particulate Matter Monitoring Market Analysis 2020-2024 and Forecast 2025-2035, By Application
    • Introduction / Key Findings
    • Historical Market Size Value (USD Mn) Analysis By Application, 2020-2024
    • Current and Future Market Size Value (USD Mn) Analysis and Forecast By Application, 2025-2035
      • Indoor Air Quality (IAQ) Monitoring
      • Outdoor Air Quality Monitoring
    • Y-o-Y Growth Trend Analysis By Application, 2020-2024
    • Absolute $ Opportunity Analysis By Application, 2025-2035
  9. Global Particulate Matter Monitoring Market Analysis 2020-2024 and Forecast 2025-2035, By End-use Industry
    • Introduction / Key Findings
    • Historical Market Size Value (USD Mn) Analysis By End-use Industry, 2020-2024
    • Current and Future Market Size Value (USD Mn) Analysis and Forecast By End-use Industry, 2025-2035
      • Power Generation
      • Oil & Gas
      • Chemical & Petrochemical
      • Transportation & logistics
      • Healthcare
      • Research institutions
      • Others
    • Y-o-Y Growth Trend Analysis By End-use Industry, 2020-2024
    • Absolute $ Opportunity Analysis By End-use Industry, 2025-2035
  10. Global Particulate Matter Monitoring Market Analysis 2020-2024 and Forecast 2025-2035, By Region
    • Introduction
    • Historical Market Size Value (USD Mn) Analysis By Region, 2020-2024
    • Current Market Size Value (USD Mn) Analysis and Forecast By Region, 2025-2035
      • North America
      • Latin America
      • Western Europe
      • Eastern Europe
      • East Asia
      • South Asia and Pacific
      • Middle East & Africa
    • Market Attractiveness Analysis By Region
  11. North America Particulate Matter Monitoring Market Analysis 2020-2024 and Forecast 2025-2035, By Country
    • Historical Market Size Value (USD Mn) Trend Analysis By Market Taxonomy, 2020-2024
    • Market Size Value (USD Mn) Forecast By Market Taxonomy, 2025-2035
      • By Country
        • USA
        • Canada
        • Mexico
      • By Monitoring Type
      • By Particle Size
      • By Application
      • By End-use Industry
    • Market Attractiveness Analysis
      • By Country
      • By Monitoring Type
      • By Particle Size
      • By Application
      • By End-use Industry
    • Key Takeaways
  12. Latin America Particulate Matter Monitoring Market Analysis 2020-2024 and Forecast 2025-2035, By Country
    • Historical Market Size Value (USD Mn) Trend Analysis By Market Taxonomy, 2020-2024
    • Market Size Value (USD Mn) Forecast By Market Taxonomy, 2025-2035
      • By Country
        • Brazil
        • Chile
        • Rest of Latin America
      • By Monitoring Type
      • By Particle Size
      • By Application
      • By End-use Industry
    • Market Attractiveness Analysis
      • By Country
      • By Monitoring Type
      • By Particle Size
      • By Application
      • By End-use Industry
    • Key Takeaways
  13. Western Europe Particulate Matter Monitoring Market Analysis 2020-2024 and Forecast 2025-2035, By Country
    • Historical Market Size Value (USD Mn) Trend Analysis By Market Taxonomy, 2020-2024
    • Market Size Value (USD Mn) Forecast By Market Taxonomy, 2025-2035
      • By Country
        • Germany
        • UK
        • Italy
        • Spain
        • France
        • Nordic
        • BENELUX
        • Rest of Western Europe
      • By Monitoring Type
      • By Particle Size
      • By Application
      • By End-use Industry
    • Market Attractiveness Analysis
      • By Country
      • By Monitoring Type
      • By Particle Size
      • By Application
      • By End-use Industry
    • Key Takeaways
  14. Eastern Europe Particulate Matter Monitoring Market Analysis 2020-2024 and Forecast 2025-2035, By Country
    • Historical Market Size Value (USD Mn) Trend Analysis By Market Taxonomy, 2020-2024
    • Market Size Value (USD Mn) Forecast By Market Taxonomy, 2025-2035
      • By Country
        • Russia
        • Poland
        • Hungary
        • Balkan & Baltic
        • Rest of Eastern Europe
      • By Monitoring Type
      • By Particle Size
      • By Application
      • By End-use Industry
    • Market Attractiveness Analysis
      • By Country
      • By Monitoring Type
      • By Particle Size
      • By Application
      • By End-use Industry
    • Key Takeaways
  15. East Asia Particulate Matter Monitoring Market Analysis 2020-2024 and Forecast 2025-2035, By Country
    • Historical Market Size Value (USD Mn) Trend Analysis By Market Taxonomy, 2020-2024
    • Market Size Value (USD Mn) Forecast By Market Taxonomy, 2025-2035
      • By Country
        • China
        • Japan
        • South Korea
      • By Monitoring Type
      • By Particle Size
      • By Application
      • By End-use Industry
    • Market Attractiveness Analysis
      • By Country
      • By Monitoring Type
      • By Particle Size
      • By Application
      • By End-use Industry
    • Key Takeaways
  16. South Asia and Pacific Particulate Matter Monitoring Market Analysis 2020-2024 and Forecast 2025-2035, By Country
    • Historical Market Size Value (USD Mn) Trend Analysis By Market Taxonomy, 2020-2024
    • Market Size Value (USD Mn) Forecast By Market Taxonomy, 2025-2035
      • By Country
        • India
        • ASEAN
        • Australia & New Zealand
        • Rest of South Asia and Pacific
      • By Monitoring Type
      • By Particle Size
      • By Application
      • By End-use Industry
    • Market Attractiveness Analysis
      • By Country
      • By Monitoring Type
      • By Particle Size
      • By Application
      • By End-use Industry
    • Key Takeaways
  17. Middle East & Africa Particulate Matter Monitoring Market Analysis 2020-2024 and Forecast 2025-2035, By Country
    • Historical Market Size Value (USD Mn) Trend Analysis By Market Taxonomy, 2020-2024
    • Market Size Value (USD Mn) Forecast By Market Taxonomy, 2025-2035
      • By Country
        • Kingdom of Saudi Arabia
        • Other GCC Countries
        • Turkiye
        • South Africa
        • Other African Union
        • Rest of Middle East & Africa
      • By Monitoring Type
      • By Particle Size
      • By Application
      • By End-use Industry
    • Market Attractiveness Analysis
      • By Country
      • By Monitoring Type
      • By Particle Size
      • By Application
      • By End-use Industry
    • Key Takeaways
  18. Key Countries Particulate Matter Monitoring Market Analysis
    • USA
      • Pricing Analysis
      • Market Share Analysis, 2024
        • By Monitoring Type
        • By Particle Size
        • By Application
        • By End-use Industry
    • Canada
      • Pricing Analysis
      • Market Share Analysis, 2024
        • By Monitoring Type
        • By Particle Size
        • By Application
        • By End-use Industry
    • Mexico
      • Pricing Analysis
      • Market Share Analysis, 2024
        • By Monitoring Type
        • By Particle Size
        • By Application
        • By End-use Industry
    • Brazil
      • Pricing Analysis
      • Market Share Analysis, 2024
        • By Monitoring Type
        • By Particle Size
        • By Application
        • By End-use Industry
    • Chile
      • Pricing Analysis
      • Market Share Analysis, 2024
        • By Monitoring Type
        • By Particle Size
        • By Application
        • By End-use Industry
    • Germany
      • Pricing Analysis
      • Market Share Analysis, 2024
        • By Monitoring Type
        • By Particle Size
        • By Application
        • By End-use Industry
    • UK
      • Pricing Analysis
      • Market Share Analysis, 2024
        • By Monitoring Type
        • By Particle Size
        • By Application
        • By End-use Industry
    • Italy
      • Pricing Analysis
      • Market Share Analysis, 2024
        • By Monitoring Type
        • By Particle Size
        • By Application
        • By End-use Industry
    • Spain
      • Pricing Analysis
      • Market Share Analysis, 2024
        • By Monitoring Type
        • By Particle Size
        • By Application
        • By End-use Industry
    • France
      • Pricing Analysis
      • Market Share Analysis, 2024
        • By Monitoring Type
        • By Particle Size
        • By Application
        • By End-use Industry
    • India
      • Pricing Analysis
      • Market Share Analysis, 2024
        • By Monitoring Type
        • By Particle Size
        • By Application
        • By End-use Industry
    • ASEAN
      • Pricing Analysis
      • Market Share Analysis, 2024
        • By Monitoring Type
        • By Particle Size
        • By Application
        • By End-use Industry
    • Australia & New Zealand
      • Pricing Analysis
      • Market Share Analysis, 2024
        • By Monitoring Type
        • By Particle Size
        • By Application
        • By End-use Industry
    • China
      • Pricing Analysis
      • Market Share Analysis, 2024
        • By Monitoring Type
        • By Particle Size
        • By Application
        • By End-use Industry
    • Japan
      • Pricing Analysis
      • Market Share Analysis, 2024
        • By Monitoring Type
        • By Particle Size
        • By Application
        • By End-use Industry
    • South Korea
      • Pricing Analysis
      • Market Share Analysis, 2024
        • By Monitoring Type
        • By Particle Size
        • By Application
        • By End-use Industry
    • Russia
      • Pricing Analysis
      • Market Share Analysis, 2024
        • By Monitoring Type
        • By Particle Size
        • By Application
        • By End-use Industry
    • Poland
      • Pricing Analysis
      • Market Share Analysis, 2024
        • By Monitoring Type
        • By Particle Size
        • By Application
        • By End-use Industry
    • Hungary
      • Pricing Analysis
      • Market Share Analysis, 2024
        • By Monitoring Type
        • By Particle Size
        • By Application
        • By End-use Industry
    • Kingdom of Saudi Arabia
      • Pricing Analysis
      • Market Share Analysis, 2024
        • By Monitoring Type
        • By Particle Size
        • By Application
        • By End-use Industry
    • Turkiye
      • Pricing Analysis
      • Market Share Analysis, 2024
        • By Monitoring Type
        • By Particle Size
        • By Application
        • By End-use Industry
    • South Africa
      • Pricing Analysis
      • Market Share Analysis, 2024
        • By Monitoring Type
        • By Particle Size
        • By Application
        • By End-use Industry
  19. Market Structure Analysis
    • Competition Dashboard
    • Competition Benchmarking
    • Market Share Analysis of Top Players
      • By Regional
      • By Monitoring Type
      • By Particle Size
      • By Application
      • By End-use Industry
  20. Competition Analysis
    • Competition Deep Dive
      • 3M Company
        • Overview
        • Product Portfolio
        • Profitability by Market Segments (Product/Age /Sales Channel/Region)
        • Sales Footprint
        • Strategy Overview
          • Marketing Strategy
          • Product Strategy
          • Channel Strategy
      • ACOEM Group
      • Aeroqual Group Limited
      • AMETEK
      • Beckman Coulter, Inc.
      • ECOM America, Ltd.
      • Emerson Electric Co.
      • GrayWolf Sensing Solutions
      • Horiba, Ltd.
      • Kaiterra
      • Kanomax, Inc.
      • Rupprecht & Patashnick Co., Inc. (R&P)
      • Siemens AG
      • Teledyne API
      • Thermo Fisher Scientific, Inc.
      • TSI Incorporated
  21. Assumptions & Acronyms Used
  22. Research Methodology

List of Tables

  • Table 1: Global Particulate Matter Monitoring Market Value (USD Mn) Forecast by Region, 2020-2035
  • Table 2: Global Particulate Matter Monitoring Market Value (USD Mn) Forecast by Monitoring Type , 2020-2035
  • Table 3: Global Particulate Matter Monitoring Market Value (USD Mn) Forecast by Particle Size, 2020-2035
  • Table 4: Global Particulate Matter Monitoring Market Value (USD Mn) Forecast by Application, 2020-2035
  • Table 5: Global Particulate Matter Monitoring Market Value (USD Mn) Forecast by End-use Industry, 2020-2035
  • Table 6: North America Particulate Matter Monitoring Market Value (USD Mn) Forecast by Country, 2020-2035
  • Table 7: North America Particulate Matter Monitoring Market Value (USD Mn) Forecast by Monitoring Type , 2020-2035
  • Table 8: North America Particulate Matter Monitoring Market Value (USD Mn) Forecast by Particle Size, 2020-2035
  • Table 9: North America Particulate Matter Monitoring Market Value (USD Mn) Forecast by Application, 2020-2035
  • Table 10: North America Particulate Matter Monitoring Market Value (USD Mn) Forecast by End-use Industry, 2020-2035
  • Table 11: Latin America Particulate Matter Monitoring Market Value (USD Mn) Forecast by Country, 2020-2035
  • Table 12: Latin America Particulate Matter Monitoring Market Value (USD Mn) Forecast by Monitoring Type , 2020-2035
  • Table 13: Latin America Particulate Matter Monitoring Market Value (USD Mn) Forecast by Particle Size, 2020-2035
  • Table 14: Latin America Particulate Matter Monitoring Market Value (USD Mn) Forecast by Application, 2020-2035
  • Table 15: Latin America Particulate Matter Monitoring Market Value (USD Mn) Forecast by End-use Industry, 2020-2035
  • Table 16: Western Europe Particulate Matter Monitoring Market Value (USD Mn) Forecast by Country, 2020-2035
  • Table 17: Western Europe Particulate Matter Monitoring Market Value (USD Mn) Forecast by Monitoring Type , 2020-2035
  • Table 18: Western Europe Particulate Matter Monitoring Market Value (USD Mn) Forecast by Particle Size, 2020-2035
  • Table 19: Western Europe Particulate Matter Monitoring Market Value (USD Mn) Forecast by Application, 2020-2035
  • Table 20: Western Europe Particulate Matter Monitoring Market Value (USD Mn) Forecast by End-use Industry, 2020-2035
  • Table 21: Eastern Europe Particulate Matter Monitoring Market Value (USD Mn) Forecast by Country, 2020-2035
  • Table 22: Eastern Europe Particulate Matter Monitoring Market Value (USD Mn) Forecast by Monitoring Type , 2020-2035
  • Table 23: Eastern Europe Particulate Matter Monitoring Market Value (USD Mn) Forecast by Particle Size, 2020-2035
  • Table 24: Eastern Europe Particulate Matter Monitoring Market Value (USD Mn) Forecast by Application, 2020-2035
  • Table 25: Eastern Europe Particulate Matter Monitoring Market Value (USD Mn) Forecast by End-use Industry, 2020-2035
  • Table 26: East Asia Particulate Matter Monitoring Market Value (USD Mn) Forecast by Country, 2020-2035
  • Table 27: East Asia Particulate Matter Monitoring Market Value (USD Mn) Forecast by Monitoring Type , 2020-2035
  • Table 28: East Asia Particulate Matter Monitoring Market Value (USD Mn) Forecast by Particle Size, 2020-2035
  • Table 29: East Asia Particulate Matter Monitoring Market Value (USD Mn) Forecast by Application, 2020-2035
  • Table 30: East Asia Particulate Matter Monitoring Market Value (USD Mn) Forecast by End-use Industry, 2020-2035
  • Table 31: South Asia and Pacific Particulate Matter Monitoring Market Value (USD Mn) Forecast by Country, 2020-2035
  • Table 32: South Asia and Pacific Particulate Matter Monitoring Market Value (USD Mn) Forecast by Monitoring Type , 2020-2035
  • Table 33: South Asia and Pacific Particulate Matter Monitoring Market Value (USD Mn) Forecast by Particle Size, 2020-2035
  • Table 34: South Asia and Pacific Particulate Matter Monitoring Market Value (USD Mn) Forecast by Application, 2020-2035
  • Table 35: South Asia and Pacific Particulate Matter Monitoring Market Value (USD Mn) Forecast by End-use Industry, 2020-2035
  • Table 36: Middle East & Africa Particulate Matter Monitoring Market Value (USD Mn) Forecast by Country, 2020-2035
  • Table 37: Middle East & Africa Particulate Matter Monitoring Market Value (USD Mn) Forecast by Monitoring Type , 2020-2035
  • Table 38: Middle East & Africa Particulate Matter Monitoring Market Value (USD Mn) Forecast by Particle Size, 2020-2035
  • Table 39: Middle East & Africa Particulate Matter Monitoring Market Value (USD Mn) Forecast by Application, 2020-2035
  • Table 40: Middle East & Africa Particulate Matter Monitoring Market Value (USD Mn) Forecast by End-use Industry, 2020-2035

List of Figures

  • Figure 1: Global Particulate Matter Monitoring Market Pricing Analysis
  • Figure 2: Global Particulate Matter Monitoring Market Value (USD Mn) Forecast 2020–2035
  • Figure 3: Global Particulate Matter Monitoring Market Value Share and BPS Analysis by Monitoring Type , 2025 and 2035
  • Figure 4: Global Particulate Matter Monitoring Market Y-o-Y Growth Comparison by Monitoring Type , 2025–2035
  • Figure 5: Global Particulate Matter Monitoring Market Attractiveness Analysis by Monitoring Type
  • Figure 6: Global Particulate Matter Monitoring Market Value Share and BPS Analysis by Particle Size, 2025 and 2035
  • Figure 7: Global Particulate Matter Monitoring Market Y-o-Y Growth Comparison by Particle Size, 2025–2035
  • Figure 8: Global Particulate Matter Monitoring Market Attractiveness Analysis by Particle Size
  • Figure 9: Global Particulate Matter Monitoring Market Value Share and BPS Analysis by Application, 2025 and 2035
  • Figure 10: Global Particulate Matter Monitoring Market Y-o-Y Growth Comparison by Application, 2025–2035
  • Figure 11: Global Particulate Matter Monitoring Market Attractiveness Analysis by Application
  • Figure 12: Global Particulate Matter Monitoring Market Value Share and BPS Analysis by End-use Industry, 2025 and 2035
  • Figure 13: Global Particulate Matter Monitoring Market Y-o-Y Growth Comparison by End-use Industry, 2025–2035
  • Figure 14: Global Particulate Matter Monitoring Market Attractiveness Analysis by End-use Industry
  • Figure 15: Global Particulate Matter Monitoring Market Value (USD Mn) Share and BPS Analysis by Region, 2025 and 2035
  • Figure 16: Global Particulate Matter Monitoring Market Y-o-Y Growth Comparison by Region, 2025–2035
  • Figure 17: Global Particulate Matter Monitoring Market Attractiveness Analysis by Region
  • Figure 18: North America Particulate Matter Monitoring Market Incremental Dollar Opportunity, 2025–2035
  • Figure 19: Latin America Particulate Matter Monitoring Market Incremental Dollar Opportunity, 2025–2035
  • Figure 20: Western Europe Particulate Matter Monitoring Market Incremental Dollar Opportunity, 2025–2035
  • Figure 21: Eastern Europe Particulate Matter Monitoring Market Incremental Dollar Opportunity, 2025–2035
  • Figure 22: East Asia Particulate Matter Monitoring Market Incremental Dollar Opportunity, 2025–2035
  • Figure 23: South Asia and Pacific Particulate Matter Monitoring Market Incremental Dollar Opportunity, 2025–2035
  • Figure 24: Middle East & Africa Particulate Matter Monitoring Market Incremental Dollar Opportunity, 2025–2035
  • Figure 25: North America Particulate Matter Monitoring Market Value Share and BPS Analysis by Country, 2025 and 2035
  • Figure 26: North America Particulate Matter Monitoring Market Value Share and BPS Analysis by Monitoring Type , 2025 and 2035
  • Figure 27: North America Particulate Matter Monitoring Market Y-o-Y Growth Comparison by Monitoring Type , 2025–2035
  • Figure 28: North America Particulate Matter Monitoring Market Attractiveness Analysis by Monitoring Type
  • Figure 29: North America Particulate Matter Monitoring Market Value Share and BPS Analysis by Particle Size, 2025 and 2035
  • Figure 30: North America Particulate Matter Monitoring Market Y-o-Y Growth Comparison by Particle Size, 2025–2035
  • Figure 31: North America Particulate Matter Monitoring Market Attractiveness Analysis by Particle Size
  • Figure 32: North America Particulate Matter Monitoring Market Value Share and BPS Analysis by Application, 2025 and 2035
  • Figure 33: North America Particulate Matter Monitoring Market Y-o-Y Growth Comparison by Application, 2025–2035
  • Figure 34: North America Particulate Matter Monitoring Market Attractiveness Analysis by Application
  • Figure 35: North America Particulate Matter Monitoring Market Value Share and BPS Analysis by End-use Industry, 2025 and 2035
  • Figure 36: North America Particulate Matter Monitoring Market Y-o-Y Growth Comparison by End-use Industry, 2025–2035
  • Figure 37: North America Particulate Matter Monitoring Market Attractiveness Analysis by End-use Industry
  • Figure 38: Latin America Particulate Matter Monitoring Market Value Share and BPS Analysis by Country, 2025 and 2035
  • Figure 39: Latin America Particulate Matter Monitoring Market Value Share and BPS Analysis by Monitoring Type , 2025 and 2035
  • Figure 40: Latin America Particulate Matter Monitoring Market Y-o-Y Growth Comparison by Monitoring Type , 2025–2035
  • Figure 41: Latin America Particulate Matter Monitoring Market Attractiveness Analysis by Monitoring Type
  • Figure 42: Latin America Particulate Matter Monitoring Market Value Share and BPS Analysis by Particle Size, 2025 and 2035
  • Figure 43: Latin America Particulate Matter Monitoring Market Y-o-Y Growth Comparison by Particle Size, 2025–2035
  • Figure 44: Latin America Particulate Matter Monitoring Market Attractiveness Analysis by Particle Size
  • Figure 45: Latin America Particulate Matter Monitoring Market Value Share and BPS Analysis by Application, 2025 and 2035
  • Figure 46: Latin America Particulate Matter Monitoring Market Y-o-Y Growth Comparison by Application, 2025–2035
  • Figure 47: Latin America Particulate Matter Monitoring Market Attractiveness Analysis by Application
  • Figure 48: Latin America Particulate Matter Monitoring Market Value Share and BPS Analysis by End-use Industry, 2025 and 2035
  • Figure 49: Latin America Particulate Matter Monitoring Market Y-o-Y Growth Comparison by End-use Industry, 2025–2035
  • Figure 50: Latin America Particulate Matter Monitoring Market Attractiveness Analysis by End-use Industry
  • Figure 51: Western Europe Particulate Matter Monitoring Market Value Share and BPS Analysis by Country, 2025 and 2035
  • Figure 52: Western Europe Particulate Matter Monitoring Market Value Share and BPS Analysis by Monitoring Type , 2025 and 2035
  • Figure 53: Western Europe Particulate Matter Monitoring Market Y-o-Y Growth Comparison by Monitoring Type , 2025–2035
  • Figure 54: Western Europe Particulate Matter Monitoring Market Attractiveness Analysis by Monitoring Type
  • Figure 55: Western Europe Particulate Matter Monitoring Market Value Share and BPS Analysis by Particle Size, 2025 and 2035
  • Figure 56: Western Europe Particulate Matter Monitoring Market Y-o-Y Growth Comparison by Particle Size, 2025–2035
  • Figure 57: Western Europe Particulate Matter Monitoring Market Attractiveness Analysis by Particle Size
  • Figure 58: Western Europe Particulate Matter Monitoring Market Value Share and BPS Analysis by Application, 2025 and 2035
  • Figure 59: Western Europe Particulate Matter Monitoring Market Y-o-Y Growth Comparison by Application, 2025–2035
  • Figure 60: Western Europe Particulate Matter Monitoring Market Attractiveness Analysis by Application
  • Figure 61: Western Europe Particulate Matter Monitoring Market Value Share and BPS Analysis by End-use Industry, 2025 and 2035
  • Figure 62: Western Europe Particulate Matter Monitoring Market Y-o-Y Growth Comparison by End-use Industry, 2025–2035
  • Figure 63: Western Europe Particulate Matter Monitoring Market Attractiveness Analysis by End-use Industry
  • Figure 64: Eastern Europe Particulate Matter Monitoring Market Value Share and BPS Analysis by Country, 2025 and 2035
  • Figure 65: Eastern Europe Particulate Matter Monitoring Market Value Share and BPS Analysis by Monitoring Type , 2025 and 2035
  • Figure 66: Eastern Europe Particulate Matter Monitoring Market Y-o-Y Growth Comparison by Monitoring Type , 2025–2035
  • Figure 67: Eastern Europe Particulate Matter Monitoring Market Attractiveness Analysis by Monitoring Type
  • Figure 68: Eastern Europe Particulate Matter Monitoring Market Value Share and BPS Analysis by Particle Size, 2025 and 2035
  • Figure 69: Eastern Europe Particulate Matter Monitoring Market Y-o-Y Growth Comparison by Particle Size, 2025–2035
  • Figure 70: Eastern Europe Particulate Matter Monitoring Market Attractiveness Analysis by Particle Size
  • Figure 71: Eastern Europe Particulate Matter Monitoring Market Value Share and BPS Analysis by Application, 2025 and 2035
  • Figure 72: Eastern Europe Particulate Matter Monitoring Market Y-o-Y Growth Comparison by Application, 2025–2035
  • Figure 73: Eastern Europe Particulate Matter Monitoring Market Attractiveness Analysis by Application
  • Figure 74: Eastern Europe Particulate Matter Monitoring Market Value Share and BPS Analysis by End-use Industry, 2025 and 2035
  • Figure 75: Eastern Europe Particulate Matter Monitoring Market Y-o-Y Growth Comparison by End-use Industry, 2025–2035
  • Figure 76: Eastern Europe Particulate Matter Monitoring Market Attractiveness Analysis by End-use Industry
  • Figure 77: East Asia Particulate Matter Monitoring Market Value Share and BPS Analysis by Country, 2025 and 2035
  • Figure 78: East Asia Particulate Matter Monitoring Market Value Share and BPS Analysis by Monitoring Type , 2025 and 2035
  • Figure 79: East Asia Particulate Matter Monitoring Market Y-o-Y Growth Comparison by Monitoring Type , 2025–2035
  • Figure 80: East Asia Particulate Matter Monitoring Market Attractiveness Analysis by Monitoring Type
  • Figure 81: East Asia Particulate Matter Monitoring Market Value Share and BPS Analysis by Particle Size, 2025 and 2035
  • Figure 82: East Asia Particulate Matter Monitoring Market Y-o-Y Growth Comparison by Particle Size, 2025–2035
  • Figure 83: East Asia Particulate Matter Monitoring Market Attractiveness Analysis by Particle Size
  • Figure 84: East Asia Particulate Matter Monitoring Market Value Share and BPS Analysis by Application, 2025 and 2035
  • Figure 85: East Asia Particulate Matter Monitoring Market Y-o-Y Growth Comparison by Application, 2025–2035
  • Figure 86: East Asia Particulate Matter Monitoring Market Attractiveness Analysis by Application
  • Figure 87: East Asia Particulate Matter Monitoring Market Value Share and BPS Analysis by End-use Industry, 2025 and 2035
  • Figure 88: East Asia Particulate Matter Monitoring Market Y-o-Y Growth Comparison by End-use Industry, 2025–2035
  • Figure 89: East Asia Particulate Matter Monitoring Market Attractiveness Analysis by End-use Industry
  • Figure 90: South Asia and Pacific Particulate Matter Monitoring Market Value Share and BPS Analysis by Country, 2025 and 2035
  • Figure 91: South Asia and Pacific Particulate Matter Monitoring Market Value Share and BPS Analysis by Monitoring Type , 2025 and 2035
  • Figure 92: South Asia and Pacific Particulate Matter Monitoring Market Y-o-Y Growth Comparison by Monitoring Type , 2025–2035
  • Figure 93: South Asia and Pacific Particulate Matter Monitoring Market Attractiveness Analysis by Monitoring Type
  • Figure 94: South Asia and Pacific Particulate Matter Monitoring Market Value Share and BPS Analysis by Particle Size, 2025 and 2035
  • Figure 95: South Asia and Pacific Particulate Matter Monitoring Market Y-o-Y Growth Comparison by Particle Size, 2025–2035
  • Figure 96: South Asia and Pacific Particulate Matter Monitoring Market Attractiveness Analysis by Particle Size
  • Figure 97: South Asia and Pacific Particulate Matter Monitoring Market Value Share and BPS Analysis by Application, 2025 and 2035
  • Figure 98: South Asia and Pacific Particulate Matter Monitoring Market Y-o-Y Growth Comparison by Application, 2025–2035
  • Figure 99: South Asia and Pacific Particulate Matter Monitoring Market Attractiveness Analysis by Application
  • Figure 100: South Asia and Pacific Particulate Matter Monitoring Market Value Share and BPS Analysis by End-use Industry, 2025 and 2035
  • Figure 101: South Asia and Pacific Particulate Matter Monitoring Market Y-o-Y Growth Comparison by End-use Industry, 2025–2035
  • Figure 102: South Asia and Pacific Particulate Matter Monitoring Market Attractiveness Analysis by End-use Industry
  • Figure 103: Middle East & Africa Particulate Matter Monitoring Market Value Share and BPS Analysis by Country, 2025 and 2035
  • Figure 104: Middle East & Africa Particulate Matter Monitoring Market Value Share and BPS Analysis by Monitoring Type , 2025 and 2035
  • Figure 105: Middle East & Africa Particulate Matter Monitoring Market Y-o-Y Growth Comparison by Monitoring Type , 2025–2035
  • Figure 106: Middle East & Africa Particulate Matter Monitoring Market Attractiveness Analysis by Monitoring Type
  • Figure 107: Middle East & Africa Particulate Matter Monitoring Market Value Share and BPS Analysis by Particle Size, 2025 and 2035
  • Figure 108: Middle East & Africa Particulate Matter Monitoring Market Y-o-Y Growth Comparison by Particle Size, 2025–2035
  • Figure 109: Middle East & Africa Particulate Matter Monitoring Market Attractiveness Analysis by Particle Size
  • Figure 110: Middle East & Africa Particulate Matter Monitoring Market Value Share and BPS Analysis by Application, 2025 and 2035
  • Figure 111: Middle East & Africa Particulate Matter Monitoring Market Y-o-Y Growth Comparison by Application, 2025–2035
  • Figure 112: Middle East & Africa Particulate Matter Monitoring Market Attractiveness Analysis by Application
  • Figure 113: Middle East & Africa Particulate Matter Monitoring Market Value Share and BPS Analysis by End-use Industry, 2025 and 2035
  • Figure 114: Middle East & Africa Particulate Matter Monitoring Market Y-o-Y Growth Comparison by End-use Industry, 2025–2035
  • Figure 115: Middle East & Africa Particulate Matter Monitoring Market Attractiveness Analysis by End-use Industry
  • Figure 116: Global Particulate Matter Monitoring Market – Tier Structure Analysis
  • Figure 117: Global Particulate Matter Monitoring Market – Company Share Analysis

Frequently Asked Questions

How big is the particulate matter monitoring market in 2025?

The global particulate matter monitoring market is estimated to be valued at USD 1.4 billion in 2025.

What will be the size of particulate matter monitoring market in 2035?

The market size for the particulate matter monitoring market is projected to reach USD 4.4 billion by 2035.

How much will be the particulate matter monitoring market growth between 2025 and 2035?

The particulate matter monitoring market is expected to grow at a 12.0% CAGR between 2025 and 2035.

What are the key product types in the particulate matter monitoring market?

The key product types in particulate matter monitoring market are manual monitoring, real-time monitoring and remote monitoring.

Which particle size segment to contribute significant share in the particulate matter monitoring market in 2025?

In terms of particle size, pm 1 (1 micrometer or less) dia segment to command 41.6% share in the particulate matter monitoring market in 2025.

Explore Similar Insights

Future Market Insights

Particulate Matter Monitoring Market

Chat With

MaRIA

Hi There, I am MaRIA, Your Market Research Intelligence Assistant. How may I help you?