Reports

- Global Locations -

Headquarters

Future Market Insights, Inc.

Christiana Corporate, 200
Continental Drive, Suite 401,
Newark, Delaware - 19713,
United States

T: +1-845-579-5705

Americas

Future Market Insights, Inc.

616 Corporate Way, Suite 2-9018,
Valley Cottage, NY 10989, United States

T: +1-347-918-3531

MEA

Future Market Insights

1602-6 Jumeirah Bay X2 Tower, Plot No: JLT-PH2-X2A,
Jumeirah Lakes Towers, Dubai,
United Arab Emirates

Europe

Future Market Insights

3rd Floor, 207 Regent Street,
W1B 3HH London
United Kingdom

T: + 44 (0) 20 8123 9659
D: +44 (0) 20 3287 4268

Asia Pacific

Future Market Insights

IndiaLand Global Tech Park, Unit UG-1, Behind Grand HighStreet, Phase 1, Hinjawadi, MH, Pune – 411057, India

Pasta Machine Market Outlook (2023 to 2033)

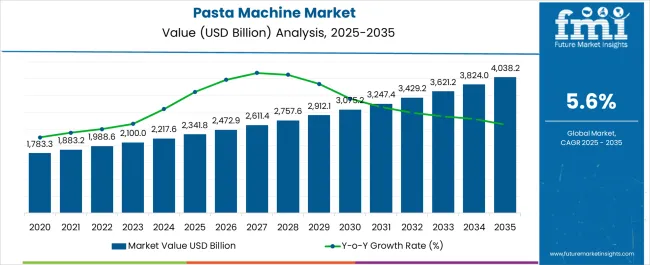
During the estimated period between 2023 and 2033, the global pasta machine market is expected to grow at a CAGR of 5.6%. The market is projected to surge from US$ 2,100 million in 2023 to US$ 3621.2 million by 2033.

As pasta is related to numerous health benefits backed by the inclusion of a high concentration of minerals and vitamins, its demand is projected to escalate quickly in the forecast period. Pasta is likely to gain immense popularity in developing nations such as China and India owing to the presence of a high millennial population, as well as the expansion of food service restaurants.

High demand for ready-to-eat products owing to busy schedules is anticipated to bode well for the global market. Companies are set to produce pasta made with quinoa and whole wheat to cater to the surging demand from health-conscious consumers.

In June 2022, for instance, ZENB, which is a renowned plant-based food provider headquartered in the United Kingdom, introduced spaghetti noodles to its existing range of grain-free pasta. The single-ingredient spaghetti is certified gluten-free, non-GMO, and vegan, as well as made of 100% yellow peas.

Flour + Water, a San Francisco-based restaurant providing handmade pasta dishes, on the other hand, introduced a novel range of packaged dry-pasta products, especially for retail. Its pasta is made from North American durum semolina and includes campanelle, penne, elbow macaroni, and spaghetti. All the varieties are made of certified organic grains.

Increasing demand for organic food items across both developed and developing countries is likely to compel key food manufacturers to launch unique products. It is expected to further push the demand for pasta machines as they are capable of extending the final product’s shelf life and lowering preparation time.

Future Market Insights, in its report, mentions that transformation in the food service industry, surging demand for healthy food, and immense popularity of convenient food items are estimated to boost sales of pasta machines across the globe. The easy availability of advanced machines that can help prepare pasta in a very short period of time is another significant factor driving the global market.

Attributes Key Insights
Pasta Machine Market Estimated Size (2023E) US$ 2,100.0 million
Projected Market Valuation (2033F) US$ 3,621.2 million
Value-based CAGR (2023 to 2033) 5.6%
Market Share of Top 3 Countries 35.6%

Don't pay for what you don't need

Customize your report by selecting specific countries or regions and save 30%!

2018 to 2022 Pasta Machine Market Outlook Compared to Demand Forecast from 2023 to 2033

As per Future Market Insights, over the past five years, the global market for pasta machines grew at a considerable pace owing to significant changes in consumption patterns. Increasing concerns about the environment are projected to decline the need for meat-based food products, which is likely to drive pasta machine sales.

Consumers are nowadays shifting towards plant-based food products and are also following a vegetarian or vegan diet. Pasta is considered to be an integral part of the vegetarian or vegan diet as it is a rich source of carbohydrates.

The rising trend for pairing pasta with other food items such as garlic bread, salads, and soups is another vital factor that is projected to drive the demand for pasta machines in the next ten years. Manufacturers are expected to focus on expanding their product portfolios by launching new product varieties infused with organic ingredients such as organic wheat to cater to market requirements.

Market-o-Nomics - Highlighting the Key Trends

Various factors have been evaluated to stir things up in the market for pasta machines. Lead analysts at Future Market Insights have evaluated the driving factors, growth opportunities, hindrances, and future challenges that can affect the global market.

The drivers, restraints, opportunities, and threats identified in the report are as follows:

DRIVERS

  • Increasing demand for ready-to-eat food products owing to rising employment and growing disposable income would drive demand.
  • The availability of pasta in high-end multi-cuisine restaurants is set to contribute to the rising demand for pasta machines.

RESTRAINTS

  • As pasta is very low in proteins and high in carbohydrates, they have been linked to a high risk of developing heart conditions, metabolic syndrome, and diabetes.
  • Pasta has high gluten content, which can lead to damage to small intestine cells in people living with celiac disease, which may hamper demand.

OPPORTUNITIES

  • High demand for chilled pasta worldwide owing to the lack of necessary nutrients in industrially produced dried pasta would aid sales.
  • Key companies are estimated to develop semolina flour as it is capable of ensuring that the texture of finished products is maintained.

THREATS

  • As one cup of cooked pasta can contain nearly 174 calories, it is not considered to be an ideal dish for people looking to lose weight.
  • Regular consumption of refined carbohydrates like pasta can cause high blood pressure, which may decline in sales.
Nandini Roy Choudhury

Principal Consultant

Talk to Analyst

Find your sweet spots for generating winning opportunities in this market.

Country-wise Insights

Why is Demand for Pasta Machines Booming in the USA?

High Demand for Pasta Salads across the USA to Push Sales of Electric Pasta Machines

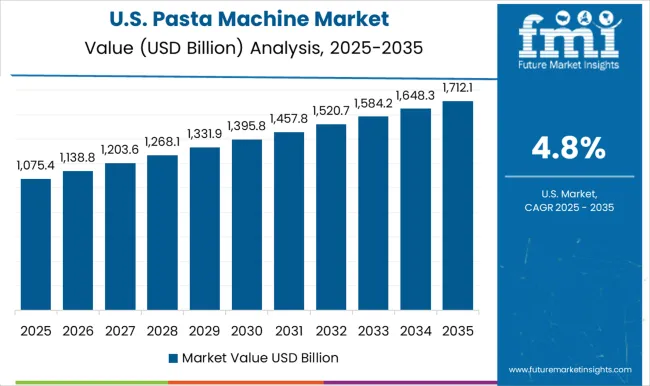
According to Future Market Insights, the pasta machine market in the USA is projected to grow at a CAGR of 68% in the next ten years and reach US$ 542.6 million by 2033. Rising consciousness about the effect of regular consumption of pasta made with new varieties of whole grains is likely to drive sales. Increasing demand for pasta salads and other new recipes is another vital factor that would propel the USA market.

Will India-based Pasta Machine Manufacturers Gain New Growth Opportunities?

Pasta Roller Machines to Witness Exponential Demand in India as Consumers Adopt Busy Lifestyles

Due to the rapidly rising population and people’s busy schedules, the demand for pasta has been increasing at regular intervals across India. It is further manipulating medium- and small-sized companies to partake in the country’s pasta machine industry. International players are looking to establish their presence in the Indian market by expanding their robust distribution channels to improve access to the local industry.
Will Germany Showcase Promising Growth in Terms of Pasta Machine Demand?

Surging Demand for Dried Pasta due to its High Freshness across Germany Would Propel Sales of Pasta Making Machines

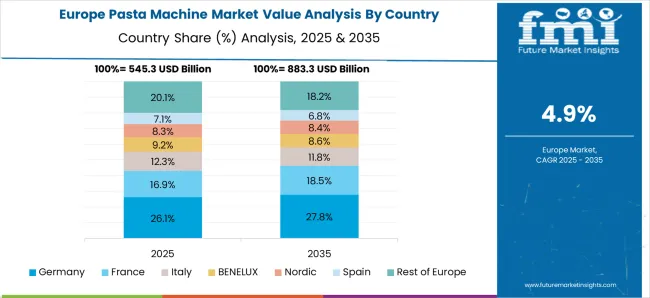
According to Future Market Insights, the pasta machine market is expected to grow at a CAGR of 5.6% across Germany. The country is projected to grow positively throughout the estimated time frame amid increasing demand for dried pasta. Dried pasta is considered to be a healthier choice, as compared to their fresh counterparts in Germany as they often undergo minimal processing. Owing to the aforementioned factors, the county is estimated to grow at a rapid pace in the forecast period.

Why is China Emerging as a High-potential Hub for Pasta Machine Companies?

High Demand for Dried Pasta in China to Propel Need for Italian Pasta Machines

According to Future Market Insights, the pasta machine market in China is expected to grow at a steady pace during the assessment period. This growth is attributed to the increasing adoption of western culture by people across China. High demand for dried pasta for home usage is anticipated to propel the need for pasta machines in the country. The availability of dried noodles for making several dishes such as spaghetti meals with meatballs, soups, and casseroles is another factor that would aid sales.

Why is the United Kingdom Showcasing Astonishing Growth?

Sales of Pasta Makers to Rise as Celebrity Chefs across the United Kingdom Collaborate with Food Delivery Platforms

During the projected period, the United Kingdom is expected to be one of the fastest-developing markets. As per Future Market Insights, the United Kingdom pasta machine market is set to surge at a valuation of around US$ 184.8 million by 2033.

The country’s pasta machine industry is set to be pushed by increasing demand for pasta in full-service restaurants, cafeterias, quick-service restaurants, and hotels. Numerous social media influencers and celebrities are expected to tie up with leading pasta brands to launch new products.

In October 2022, for instance, Jamie Oliver, a restaurateur, and chef teamed up with Taster, a renowned United Kingdom-based delivery-first kitchen group, to introduce a novel pasta concept. Pasta Dreams is set to be open for consumers to order from leading delivery platforms such as Uber Eats.
Category-wise Insights

Which is the Leading Application of Pasta Machines?

Commercial Kitchens to Witness Skyrocketing Demand for Italian Pasta Makers as Cheese-infused Recipes Gain Impetus

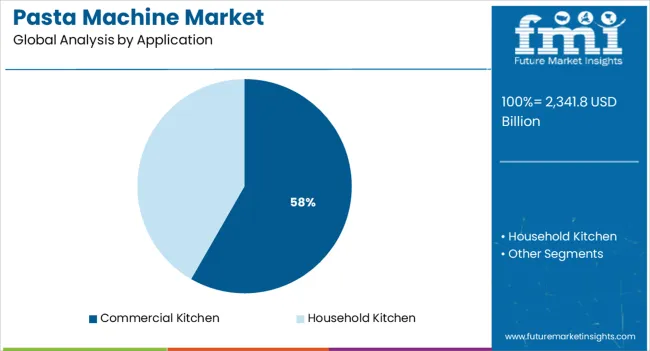
In terms of application, the commercial kitchen category is estimated to dominate the global market for pasta machines in the next ten years. Increasing demand for new recipes comprising cheese among millennials and gen z is likely to compel restaurants and cafes to expand their capacities of pasta making, which would drive sales among commercial kitchens.

In July 2022, for instance, Mumbai opened doors to the city’s latest Italian restaurant named Toast Pasta Bar. It provides negronis reminiscent of sunsets, lashings of yellow olive oil, crunchy pastry piled with parma ham, and sunny lemon meringue tarts. The launch of such unique Italian restaurants across the globe is projected to push the segment.

Get the data you need at a Fraction of the cost

Personalize your report by choosing insights you need
and save 40%!

Competitive Landscape

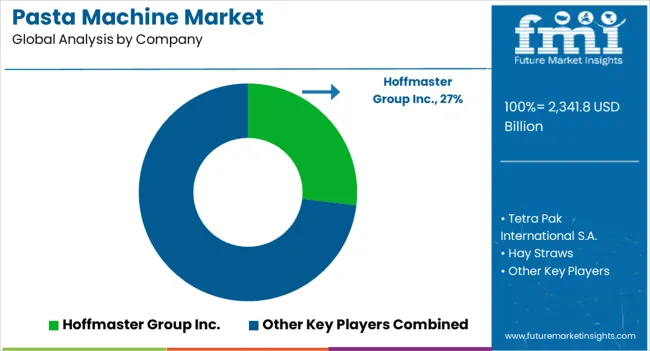
Key players in the global pasta machine market are CucinaPro Inc., Eurodib Inc., Koninklijke Philips N.V., Lakeland, Kenwood Corporation, Atlas, Imperia, Williams-Sonoma, Inc., Foodax Engineering Works, S.K. Food Equipment, and Weston Brands LLC among others.

They are constantly focusing on providing customized solutions to their clients by investing in research and development activities. They are also engaging in mergers & acquisitions, collaborations, and joint ventures to expand their product ranges and compete in the global market.

For instance,

  • In October 2022, Eurostampi Srl, an injection mold manufacturing organization based in Italy, introduced MAMMAMIA, its new brand of pasta-making machine. It was inspired by the Italian gastronomic culture and tradition for appealing to international and young audiences.

Scope of the Report

Attribute Details
Estimated Market Size (2023) US$ 2,100.0 million
Projected Market Valuation (2033) US$ 3,621.2 million
Value-based CAGR (2023 to 2033) 5.6%
Forecast Period 2023 to 2033
Historical Data Available for 2018 to 2022
Market Analysis Value (US$ million)
Key Regions Covered
  • North America
  • Latin America
  • Europe
  • Asia Pacific
  • Oceania
  • Middle East and Africa (MEA)
Key Countries Covered
  • United States of America
  • Canada
  • Mexico
  • Germany
  • United Kingdom
  • France
  • Italy
  • Spain
  • China
  • Japan
  • India
  • South Korea
  • Australia
  • Brazil
  • Argentina
  • South Africa
  • UAE
Key Segments Covered
  • Product Type
  • Model
  • Application
  • Region
Key Companies Profiled
  • CucinaPro, Inc.
  • Eurodib Inc.
  • Koninklijke Philips N.V.
  • Lakeland
  • Kenwood Corporation
  • Atlas
  • ImperiaWilliams-Sonoma, Inc.
  • Foodax Engineering Works
  • S.K. Food Equipment
  • Weston Brands LLC.
Report Coverage Market Forecast, Company Share Analysis, Competitive Landscape, Drivers, Restraints, Opportunities and Threats Analysis, Market Dynamics and Challenges, and Strategic Growth Initiatives

Pasta Machine Market Outlook by Category

By Product Type:

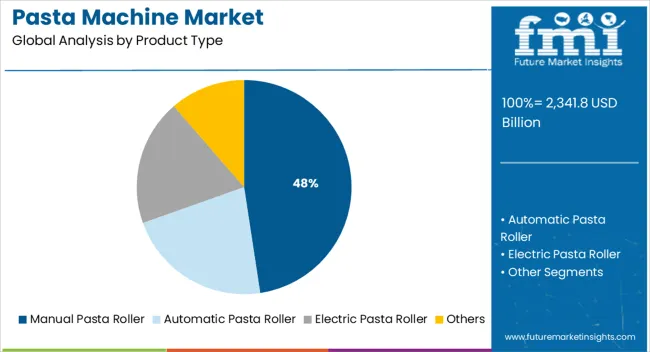
  • Manual Pasta Roller
  • Automatic Pasta Roller
  • Electric Pasta Roller
  • Others

By Application:

  • Commercial Kitchen
  • Household Kitchen

By Model:

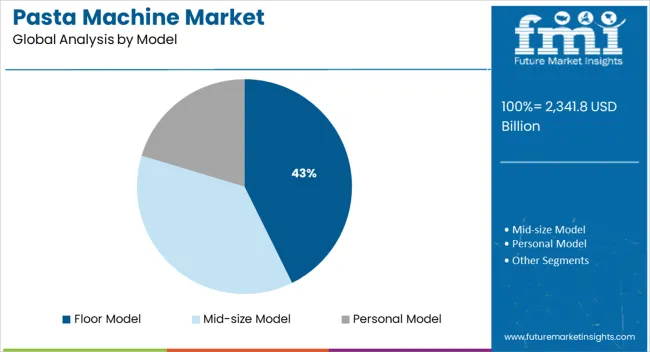
  • Floor Model
  • Mid-size Model
  • Personal Model

By Region:

  • North America
  • Latin America
  • Europe
  • East Asia
  • South Asia
  • Oceania
  • Middle East and Africa (MEA)

Frequently Asked Questions

How Big is the Pasta Machine Market?

The market is valued at US$ 2,100 million in 2023.

What is the Growth Potential of the Market?

The growth potential of the market is 5.6% through 2033.

What Opportunities Lie Ahead for the Market Players?

Great demand for chilled pasta are likely to provide growth prospects for the market players.

What Limits the Growth Potential of the Market?

Association of pasta with high blood pressure is likely to limit adoption of pasta and pasta machine.

What Key Trends are Driving the Market?

Growing demand for RTE food products may drive market growth over the coming years.

Table of Content

1. Executive Summary | Pasta Machine Market

        1.1. Global Market Outlook

        1.2. Demand-side Trends

        1.3. Supply-side Trends

        1.4. Technology Roadmap Analysis

        1.5. Analysis and Recommendations

2. Market Overview

        2.1. Market Coverage / Taxonomy

        2.2. Market Definition / Scope / Limitations

3. Market Background

        3.1. Market Dynamics

            3.1.1. Drivers

            3.1.2. Restraints

            3.1.3. Opportunity

            3.1.4. Trends

        3.2. Scenario Forecast

            3.2.1. Demand in Optimistic Scenario

            3.2.2. Demand in Likely Scenario

            3.2.3. Demand in Conservative Scenario

        3.3. Opportunity Map Analysis

        3.4. Product Life Cycle Analysis

        3.5. Supply Chain Analysis

            3.5.1. Supply Side Participants and their Roles

                3.5.1.1. Producers

                3.5.1.2. Mid-Level Participants (Traders/ Agents/ Brokers)

                3.5.1.3. Wholesalers and Distributors

            3.5.2. Value Added and Value Created at Node in the Supply Chain

            3.5.3. List of Raw Material Suppliers

            3.5.4. List of Existing and Potential Buyers

        3.6. Investment Feasibility Matrix

        3.7. Value Chain Analysis

            3.7.1. Profit Margin Analysis

            3.7.2. Wholesalers and Distributors

            3.7.3. Retailers

        3.8. PESTLE and Porter’s Analysis

        3.9. Regulatory Landscape

            3.9.1. By Key Regions

            3.9.2. By Key Countries

        3.10. Regional Parent Market Outlook

        3.11. Production and Consumption Statistics

        3.12. Import and Export Statistics

4. Global Straw Market Analysis 2017 to 2022 and Forecast, 2023 to 2033

        4.1. Historical Market Size Value (US$ Million) & Volume (Units) Analysis, 2017 to 2022

        4.2. Current and Future Market Size Value (US$ Million) & Volume (Units) Projections, 2023 to 2033

            4.2.1. Y-o-Y Growth Trend Analysis

            4.2.2. Absolute $ Opportunity Analysis

5. Global Straw Market Analysis 2017 to 2022 and Forecast 2023 to 2033, By Product Type

        5.1. Introduction / Key Findings

        5.2. Historical Market Size Value (US$ Million) & Volume (Units) Analysis By Product Type, 2017 to 2022

        5.3. Current and Future Market Size Value (US$ Million) & Volume (Units) Analysis and Forecast By Product Type, 2023 to 2033

            5.3.1. Plastic Straws

            5.3.2. Bamboo Straws

            5.3.3. Metal Straws

            5.3.4. Paper Straws

            5.3.5. Glass Straws

            5.3.6. Silicone Straws

            5.3.7. Others

        5.4. Y-o-Y Growth Trend Analysis By Product Type, 2017 to 2022

        5.5. Absolute $ Opportunity Analysis By Product Type, 2023 to 2033

6. Global Straw Market Analysis 2017 to 2022 and Forecast 2023 to 2033, By Straw Length

        6.1. Introduction / Key Findings

        6.2. Historical Market Size Value (US$ Million) & Volume (Units) Analysis By Straw Length, 2017 to 2022

        6.3. Current and Future Market Size Value (US$ Million) & Volume (Units) Analysis and Forecast By Straw Length, 2023 to 2033

            6.3.1. <9 cm Straws

            6.3.2. 9-15 cm Straws

            6.3.3. 16-20 cm Straws

            6.3.4. >20 cm Straws

        6.4. Y-o-Y Growth Trend Analysis By Straw Length, 2017 to 2022

        6.5. Absolute $ Opportunity Analysis By Straw Length, 2023 to 2033

7. Global Straw Market Analysis 2017 to 2022 and Forecast 2023 to 2033, By Sales Channel

        7.1. Introduction / Key Findings

        7.2. Historical Market Size Value (US$ Million) & Volume (Units) Analysis By Sales Channel, 2017 to 2022

        7.3. Current and Future Market Size Value (US$ Million) & Volume (Units) Analysis and Forecast By Sales Channel, 2023 to 2033

            7.3.1. Straw Manufacturers

            7.3.2. Straw Distributors

            7.3.3. Straw Retailers

            7.3.4. E-retail of Straws

        7.4. Y-o-Y Growth Trend Analysis By Sales Channel, 2017 to 2022

        7.5. Absolute $ Opportunity Analysis By Sales Channel, 2023 to 2033

8. Global Straw Market Analysis 2017 to 2022 and Forecast 2023 to 2033, By End Use

        8.1. Introduction / Key Findings

        8.2. Historical Market Size Value (US$ Million) & Volume (Units) Analysis By End Use, 2017 to 2022

        8.3. Current and Future Market Size Value (US$ Million) & Volume (Units) Analysis and Forecast By End Use, 2023 to 2033

            8.3.1. Food Service

            8.3.2. Institutional

            8.3.3. Households

        8.4. Y-o-Y Growth Trend Analysis By End Use, 2017 to 2022

        8.5. Absolute $ Opportunity Analysis By End Use, 2023 to 2033

9. Global Straw Market Analysis 2017 to 2022 and Forecast 2023 to 2033, By Region

        9.1. Introduction

        9.2. Historical Market Size Value (US$ Million) & Volume (Units) Analysis By Region, 2017 to 2022

        9.3. Current Market Size Value (US$ Million) & Volume (Units) Analysis and Forecast By Region, 2023 to 2033

            9.3.1. North America

            9.3.2. Latin America

            9.3.3. Europe

            9.3.4. East Asia

            9.3.5. South Asia

            9.3.6. Oceania

            9.3.7. Middle East and Africa (MEA)

        9.4. Market Attractiveness Analysis By Region

10. North America Straw Market Analysis 2017 to 2022 and Forecast 2023 to 2033, By Country

        10.1. Historical Market Size Value (US$ Million) & Volume (Units) Trend Analysis By Market Taxonomy, 2017 to 2022

        10.2. Market Size Value (US$ Million) & Volume (Units) Forecast By Market Taxonomy, 2023 to 2033

            10.2.1. By Country

                10.2.1.1. United States of America

                10.2.1.2. Canada

            10.2.2. By Product Type

            10.2.3. By Straw Length

            10.2.4. By Sales Channel

            10.2.5. By End Use

        10.3. Market Attractiveness Analysis

            10.3.1. By Country

            10.3.2. By Product Type

            10.3.3. By Straw Length

            10.3.4. By Sales Channel

            10.3.5. By End Use

        10.4. Key Takeaways

11. Latin America Straw Market Analysis 2017 to 2022 and Forecast 2023 to 2033, By Country

        11.1. Historical Market Size Value (US$ Million) & Volume (Units) Trend Analysis By Market Taxonomy, 2017 to 2022

        11.2. Market Size Value (US$ Million) & Volume (Units) Forecast By Market Taxonomy, 2023 to 2033

            11.2.1. By Country

                11.2.1.1. Brazil

                11.2.1.2. Mexico

                11.2.1.3. Rest of Latin America

            11.2.2. By Product Type

            11.2.3. By Straw Length

            11.2.4. By Sales Channel

            11.2.5. By End Use

        11.3. Market Attractiveness Analysis

            11.3.1. By Country

            11.3.2. By Product Type

            11.3.3. By Straw Length

            11.3.4. By Sales Channel

            11.3.5. By End Use

        11.4. Key Takeaways

12. Europe Straw Market Analysis 2017 to 2022 and Forecast 2023 to 2033, By Country

        12.1. Historical Market Size Value (US$ Million) & Volume (Units) Trend Analysis By Market Taxonomy, 2017 to 2022

        12.2. Market Size Value (US$ Million) & Volume (Units) Forecast By Market Taxonomy, 2023 to 2033

            12.2.1. By Country

                12.2.1.1. Germany

                12.2.1.2. Italy

                12.2.1.3. France

                12.2.1.4. United Kingdom

                12.2.1.5. Spain

                12.2.1.6. BENELUX

                12.2.1.7. Russia

                12.2.1.8. Rest of Europe

            12.2.2. By Product Type

            12.2.3. By Straw Length

            12.2.4. By Sales Channel

            12.2.5. By End Use

        12.3. Market Attractiveness Analysis

            12.3.1. By Country

            12.3.2. By Product Type

            12.3.3. By Straw Length

            12.3.4. By Sales Channel

            12.3.5. By End Use

        12.4. Key Takeaways

13. East Asia Straw Market Analysis 2017 to 2022 and Forecast 2023 to 2033, By Country

        13.1. Historical Market Size Value (US$ Million) & Volume (Units) Trend Analysis By Market Taxonomy, 2017 to 2022

        13.2. Market Size Value (US$ Million) & Volume (Units) Forecast By Market Taxonomy, 2023 to 2033

            13.2.1. By Country

                13.2.1.1. China

                13.2.1.2. Japan

                13.2.1.3. South Korea

            13.2.2. By Product Type

            13.2.3. By Straw Length

            13.2.4. By Sales Channel

            13.2.5. By End Use

        13.3. Market Attractiveness Analysis

            13.3.1. By Country

            13.3.2. By Product Type

            13.3.3. By Straw Length

            13.3.4. By Sales Channel

            13.3.5. By End Use

        13.4. Key Takeaways

14. South Asia Straw Market Analysis 2017 to 2022 and Forecast 2023 to 2033, By Country

        14.1. Historical Market Size Value (US$ Million) & Volume (Units) Trend Analysis By Market Taxonomy, 2017 to 2022

        14.2. Market Size Value (US$ Million) & Volume (Units) Forecast By Market Taxonomy, 2023 to 2033

            14.2.1. By Country

                14.2.1.1. India

                14.2.1.2. Thailand

                14.2.1.3. Indonesia

                14.2.1.4. Malaysia

                14.2.1.5. Rest of South Asia

            14.2.2. By Product Type

            14.2.3. By Straw Length

            14.2.4. By Sales Channel

            14.2.5. By End Use

        14.3. Market Attractiveness Analysis

            14.3.1. By Country

            14.3.2. By Product Type

            14.3.3. By Straw Length

            14.3.4. By Sales Channel

            14.3.5. By End Use

        14.4. Key Takeaways

15. Oceania Straw Market Analysis 2017 to 2022 and Forecast 2023 to 2033, By Country

        15.1. Historical Market Size Value (US$ Million) & Volume (Units) Trend Analysis By Market Taxonomy, 2017 to 2022

        15.2. Market Size Value (US$ Million) & Volume (Units) Forecast By Market Taxonomy, 2023 to 2033

            15.2.1. By Country

                15.2.1.1. Australia

                15.2.1.2. New Zealand

            15.2.2. By Product Type

            15.2.3. By Straw Length

            15.2.4. By Sales Channel

            15.2.5. By End Use

        15.3. Market Attractiveness Analysis

            15.3.1. By Country

            15.3.2. By Product Type

            15.3.3. By Straw Length

            15.3.4. By Sales Channel

            15.3.5. By End Use

        15.4. Key Takeaways

16. MEA Straw Market Analysis 2017 to 2022 and Forecast 2023 to 2033, By Country

        16.1. Historical Market Size Value (US$ Million) & Volume (Units) Trend Analysis By Market Taxonomy, 2017 to 2022

        16.2. Market Size Value (US$ Million) & Volume (Units) Forecast By Market Taxonomy, 2023 to 2033

            16.2.1. By Country

                16.2.1.1. GCC Countries

                16.2.1.2. Northern Africa

                16.2.1.3. Turkey

                16.2.1.4. South Africa

                16.2.1.5. Rest of MEA

            16.2.2. By Product Type

            16.2.3. By Straw Length

            16.2.4. By Sales Channel

            16.2.5. By End Use

        16.3. Market Attractiveness Analysis

            16.3.1. By Country

            16.3.2. By Product Type

            16.3.3. By Straw Length

            16.3.4. By Sales Channel

            16.3.5. By End Use

        16.4. Key Takeaways

17. Key Countries Straw Market Analysis

        17.1. United States of America

            17.1.1. Pricing Analysis

            17.1.2. Market Share Analysis, 2022

                17.1.2.1. By Product Type

                17.1.2.2. By Straw Length

                17.1.2.3. By Sales Channel

                17.1.2.4. By End Use

        17.2. Canada

            17.2.1. Pricing Analysis

            17.2.2. Market Share Analysis, 2022

                17.2.2.1. By Product Type

                17.2.2.2. By Straw Length

                17.2.2.3. By Sales Channel

                17.2.2.4. By End Use

        17.3. Brazil

            17.3.1. Pricing Analysis

            17.3.2. Market Share Analysis, 2022

                17.3.2.1. By Product Type

                17.3.2.2. By Straw Length

                17.3.2.3. By Sales Channel

                17.3.2.4. By End Use

        17.4. Mexico

            17.4.1. Pricing Analysis

            17.4.2. Market Share Analysis, 2022

                17.4.2.1. By Product Type

                17.4.2.2. By Straw Length

                17.4.2.3. By Sales Channel

                17.4.2.4. By End Use

        17.5. Germany

            17.5.1. Pricing Analysis

            17.5.2. Market Share Analysis, 2022

                17.5.2.1. By Product Type

                17.5.2.2. By Straw Length

                17.5.2.3. By Sales Channel

                17.5.2.4. By End Use

        17.6. Italy

            17.6.1. Pricing Analysis

            17.6.2. Market Share Analysis, 2022

                17.6.2.1. By Product Type

                17.6.2.2. By Straw Length

                17.6.2.3. By Sales Channel

                17.6.2.4. By End Use

        17.7. France

            17.7.1. Pricing Analysis

            17.7.2. Market Share Analysis, 2022

                17.7.2.1. By Product Type

                17.7.2.2. By Straw Length

                17.7.2.3. By Sales Channel

                17.7.2.4. By End Use

        17.8. United Kingdom

            17.8.1. Pricing Analysis

            17.8.2. Market Share Analysis, 2022

                17.8.2.1. By Product Type

                17.8.2.2. By Straw Length

                17.8.2.3. By Sales Channel

                17.8.2.4. By End Use

        17.9. Spain

            17.9.1. Pricing Analysis

            17.9.2. Market Share Analysis, 2022

                17.9.2.1. By Product Type

                17.9.2.2. By Straw Length

                17.9.2.3. By Sales Channel

                17.9.2.4. By End Use

        17.10. BENELUX

            17.10.1. Pricing Analysis

            17.10.2. Market Share Analysis, 2022

                17.10.2.1. By Product Type

                17.10.2.2. By Straw Length

                17.10.2.3. By Sales Channel

                17.10.2.4. By End Use

        17.11. Russia

            17.11.1. Pricing Analysis

            17.11.2. Market Share Analysis, 2022

                17.11.2.1. By Product Type

                17.11.2.2. By Straw Length

                17.11.2.3. By Sales Channel

                17.11.2.4. By End Use

        17.12. China

            17.12.1. Pricing Analysis

            17.12.2. Market Share Analysis, 2022

                17.12.2.1. By Product Type

                17.12.2.2. By Straw Length

                17.12.2.3. By Sales Channel

                17.12.2.4. By End Use

        17.13. Japan

            17.13.1. Pricing Analysis

            17.13.2. Market Share Analysis, 2022

                17.13.2.1. By Product Type

                17.13.2.2. By Straw Length

                17.13.2.3. By Sales Channel

                17.13.2.4. By End Use

        17.14. South Korea

            17.14.1. Pricing Analysis

            17.14.2. Market Share Analysis, 2022

                17.14.2.1. By Product Type

                17.14.2.2. By Straw Length

                17.14.2.3. By Sales Channel

                17.14.2.4. By End Use

        17.15. India

            17.15.1. Pricing Analysis

            17.15.2. Market Share Analysis, 2022

                17.15.2.1. By Product Type

                17.15.2.2. By Straw Length

                17.15.2.3. By Sales Channel

                17.15.2.4. By End Use

        17.16. Thailand

            17.16.1. Pricing Analysis

            17.16.2. Market Share Analysis, 2022

                17.16.2.1. By Product Type

                17.16.2.2. By Straw Length

                17.16.2.3. By Sales Channel

                17.16.2.4. By End Use

        17.17. Indonesia

            17.17.1. Pricing Analysis

            17.17.2. Market Share Analysis, 2022

                17.17.2.1. By Product Type

                17.17.2.2. By Straw Length

                17.17.2.3. By Sales Channel

                17.17.2.4. By End Use

        17.18. Malaysia

            17.18.1. Pricing Analysis

            17.18.2. Market Share Analysis, 2022

                17.18.2.1. By Product Type

                17.18.2.2. By Straw Length

                17.18.2.3. By Sales Channel

                17.18.2.4. By End Use

        17.19. Australia

            17.19.1. Pricing Analysis

            17.19.2. Market Share Analysis, 2022

                17.19.2.1. By Product Type

                17.19.2.2. By Straw Length

                17.19.2.3. By Sales Channel

                17.19.2.4. By End Use

        17.20. New Zealand

            17.20.1. Pricing Analysis

            17.20.2. Market Share Analysis, 2022

                17.20.2.1. By Product Type

                17.20.2.2. By Straw Length

                17.20.2.3. By Sales Channel

                17.20.2.4. By End Use

        17.21. GCC Countries

            17.21.1. Pricing Analysis

            17.21.2. Market Share Analysis, 2022

                17.21.2.1. By Product Type

                17.21.2.2. By Straw Length

                17.21.2.3. By Sales Channel

                17.21.2.4. By End Use

        17.22. Northern Africa

            17.22.1. Pricing Analysis

            17.22.2. Market Share Analysis, 2022

                17.22.2.1. By Product Type

                17.22.2.2. By Straw Length

                17.22.2.3. By Sales Channel

                17.22.2.4. By End Use

        17.23. Turkey 

            17.23.1. Pricing Analysis

            17.23.2. Market Share Analysis, 2022

                17.23.2.1. By Product Type

                17.23.2.2. By Straw Length

                17.23.2.3. By Sales Channel

                17.23.2.4. By End Use

        17.24. South Africa

            17.24.1. Pricing Analysis

            17.24.2. Market Share Analysis, 2022

                17.24.2.1. By Product Type

                17.24.2.2. By Straw Length

                17.24.2.3. By Sales Channel

                17.24.2.4. By End Use

18. Market Structure Analysis

        18.1. Competition Dashboard

        18.2. Competition Benchmarking

        18.3. Market Share Analysis of Top Players

            18.3.1. By Regional

            18.3.2. By Product Type

            18.3.3. By Straw Length

            18.3.4. By Sales Channel

            18.3.5. By End Use

19. Competition Analysis

        19.1. Competition Deep Dive

            19.1.1. Hoffmaster Group Inc.

                19.1.1.1. Overview

                19.1.1.2. Product Portfolio

                19.1.1.3. Profitability by Market Segments

                19.1.1.4. Sales Footprint

                19.1.1.5. Strategy Overview

                    19.1.1.5.1. Marketing Strategy

                    19.1.1.5.2. Product Strategy

                    19.1.1.5.3. Channel Strategy

            19.1.2. Tetra Pak International S.A.

                19.1.2.1. Overview

                19.1.2.2. Product Portfolio

                19.1.2.3. Profitability by Market Segments

                19.1.2.4. Sales Footprint

                19.1.2.5. Strategy Overview

                    19.1.2.5.1. Marketing Strategy

                    19.1.2.5.2. Product Strategy

                    19.1.2.5.3. Channel Strategy

            19.1.3. Hay Straws

                19.1.3.1. Overview

                19.1.3.2. Product Portfolio

                19.1.3.3. Profitability by Market Segments

                19.1.3.4. Sales Footprint

                19.1.3.5. Strategy Overview

                    19.1.3.5.1. Marketing Strategy

                    19.1.3.5.2. Product Strategy

                    19.1.3.5.3. Channel Strategy

            19.1.4. Stora Enso Oy

                19.1.4.1. Overview

                19.1.4.2. Product Portfolio

                19.1.4.3. Profitability by Market Segments

                19.1.4.4. Sales Footprint

                19.1.4.5. Strategy Overview

                    19.1.4.5.1. Marketing Strategy

                    19.1.4.5.2. Product Strategy

                    19.1.4.5.3. Channel Strategy

            19.1.5. FinalStraw

                19.1.5.1. Overview

                19.1.5.2. Product Portfolio

                19.1.5.3. Profitability by Market Segments

                19.1.5.4. Sales Footprint

                19.1.5.5. Strategy Overview

                    19.1.5.5.1. Marketing Strategy

                    19.1.5.5.2. Product Strategy

                    19.1.5.5.3. Channel Strategy

            19.1.6. Bio Agave

                19.1.6.1. Overview

                19.1.6.2. Product Portfolio

                19.1.6.3. Profitability by Market Segments

                19.1.6.4. Sales Footprint

                19.1.6.5. Strategy Overview

                    19.1.6.5.1. Marketing Strategy

                    19.1.6.5.2. Product Strategy

                    19.1.6.5.3. Channel Strategy

            19.1.7. Aardvark Straws

                19.1.7.1. Overview

                19.1.7.2. Product Portfolio

                19.1.7.3. Profitability by Market Segments

                19.1.7.4. Sales Footprint

                19.1.7.5. Strategy Overview

                    19.1.7.5.1. Marketing Strategy

                    19.1.7.5.2. Product Strategy

                    19.1.7.5.3. Channel Strategy

            19.1.8. Absolute Custom Extrusions

                19.1.8.1. Overview

                19.1.8.2. Product Portfolio

                19.1.8.3. Profitability by Market Segments

                19.1.8.4. Sales Footprint

                19.1.8.5. Strategy Overview

                    19.1.8.5.1. Marketing Strategy

                    19.1.8.5.2. Product Strategy

                    19.1.8.5.3. Channel Strategy

            19.1.9. Southeastern Liquid Analyzers

                19.1.9.1. Overview

                19.1.9.2. Product Portfolio

                19.1.9.3. Profitability by Market Segments

                19.1.9.4. Sales Footprint

                19.1.9.5. Strategy Overview

                    19.1.9.5.1. Marketing Strategy

                    19.1.9.5.2. Product Strategy

                    19.1.9.5.3. Channel Strategy

            19.1.10. Klean Kanteen

                19.1.10.1. Overview

                19.1.10.2. Product Portfolio

                19.1.10.3. Profitability by Market Segments

                19.1.10.4. Sales Footprint

                19.1.10.5. Strategy Overview

                    19.1.10.5.1. Marketing Strategy

                    19.1.10.5.2. Product Strategy

                    19.1.10.5.3. Channel Strategy

            19.1.11. Koffie Straw

                19.1.11.1. Overview

                19.1.11.2. Product Portfolio

                19.1.11.3. Profitability by Market Segments

                19.1.11.4. Sales Footprint

                19.1.11.5. Strategy Overview

                    19.1.11.5.1. Marketing Strategy

                    19.1.11.5.2. Product Strategy

                    19.1.11.5.3. Channel Strategy

            19.1.12. Simply Straws

                19.1.12.1. Overview

                19.1.12.2. Product Portfolio

                19.1.12.3. Profitability by Market Segments

                19.1.12.4. Sales Footprint

                19.1.12.5. Strategy Overview

                    19.1.12.5.1. Marketing Strategy

                    19.1.12.5.2. Product Strategy

                    19.1.12.5.3. Channel Strategy

20. Assumptions & Acronyms Used

21. Research Methodology

List of Tables

Table 1: Global Market Value (US$ Million) Forecast by Region, 2017 to 2033

Table 2: Global Market Volume (Units) Forecast by Region, 2017 to 2033

Table 3: Global Market Value (US$ Million) Forecast by Product Type, 2017 to 2033

Table 4: Global Market Volume (Units) Forecast by Product Type, 2017 to 2033

Table 5: Global Market Value (US$ Million) Forecast by Length, 2017 to 2033

Table 6: Global Market Volume (Units) Forecast by Length, 2017 to 2033

Table 7: Global Market Value (US$ Million) Forecast by Sales Channel, 2017 to 2033

Table 8: Global Market Volume (Units) Forecast by Sales Channel, 2017 to 2033

Table 9: Global Market Value (US$ Million) Forecast by End Use, 2017 to 2033

Table 10: Global Market Volume (Units) Forecast by End Use, 2017 to 2033

Table 11: North America Market Value (US$ Million) Forecast by Country, 2017 to 2033

Table 12: North America Market Volume (Units) Forecast by Country, 2017 to 2033

Table 13: North America Market Value (US$ Million) Forecast by Product Type, 2017 to 2033

Table 14: North America Market Volume (Units) Forecast by Product Type, 2017 to 2033

Table 15: North America Market Value (US$ Million) Forecast by Length, 2017 to 2033

Table 16: North America Market Volume (Units) Forecast by Length, 2017 to 2033

Table 17: North America Market Value (US$ Million) Forecast by Sales Channel, 2017 to 2033

Table 18: North America Market Volume (Units) Forecast by Sales Channel, 2017 to 2033

Table 19: North America Market Value (US$ Million) Forecast by End Use, 2017 to 2033

Table 20: North America Market Volume (Units) Forecast by End Use, 2017 to 2033

Table 21: Latin America Market Value (US$ Million) Forecast by Country, 2017 to 2033

Table 22: Latin America Market Volume (Units) Forecast by Country, 2017 to 2033

Table 23: Latin America Market Value (US$ Million) Forecast by Product Type, 2017 to 2033

Table 24: Latin America Market Volume (Units) Forecast by Product Type, 2017 to 2033

Table 25: Latin America Market Value (US$ Million) Forecast by Length, 2017 to 2033

Table 26: Latin America Market Volume (Units) Forecast by Length, 2017 to 2033

Table 27: Latin America Market Value (US$ Million) Forecast by Sales Channel, 2017 to 2033

Table 28: Latin America Market Volume (Units) Forecast by Sales Channel, 2017 to 2033

Table 29: Latin America Market Value (US$ Million) Forecast by End Use, 2017 to 2033

Table 30: Latin America Market Volume (Units) Forecast by End Use, 2017 to 2033

Table 31: Europe Market Value (US$ Million) Forecast by Country, 2017 to 2033

Table 32: Europe Market Volume (Units) Forecast by Country, 2017 to 2033

Table 33: Europe Market Value (US$ Million) Forecast by Product Type, 2017 to 2033

Table 34: Europe Market Volume (Units) Forecast by Product Type, 2017 to 2033

Table 35: Europe Market Value (US$ Million) Forecast by Length, 2017 to 2033

Table 36: Europe Market Volume (Units) Forecast by Length, 2017 to 2033

Table 37: Europe Market Value (US$ Million) Forecast by Sales Channel, 2017 to 2033

Table 38: Europe Market Volume (Units) Forecast by Sales Channel, 2017 to 2033

Table 39: Europe Market Value (US$ Million) Forecast by End Use, 2017 to 2033

Table 40: Europe Market Volume (Units) Forecast by End Use, 2017 to 2033

Table 41: East Asia Market Value (US$ Million) Forecast by Country, 2017 to 2033

Table 42: East Asia Market Volume (Units) Forecast by Country, 2017 to 2033

Table 43: East Asia Market Value (US$ Million) Forecast by Product Type, 2017 to 2033

Table 44: East Asia Market Volume (Units) Forecast by Product Type, 2017 to 2033

Table 45: East Asia Market Value (US$ Million) Forecast by Length, 2017 to 2033

Table 46: East Asia Market Volume (Units) Forecast by Length, 2017 to 2033

Table 47: East Asia Market Value (US$ Million) Forecast by Sales Channel, 2017 to 2033

Table 48: East Asia Market Volume (Units) Forecast by Sales Channel, 2017 to 2033

Table 49: East Asia Market Value (US$ Million) Forecast by End Use, 2017 to 2033

Table 50: East Asia Market Volume (Units) Forecast by End Use, 2017 to 2033

Table 51: South Asia Market Value (US$ Million) Forecast by Country, 2017 to 2033

Table 52: South Asia Market Volume (Units) Forecast by Country, 2017 to 2033

Table 53: South Asia Market Value (US$ Million) Forecast by Product Type, 2017 to 2033

Table 54: South Asia Market Volume (Units) Forecast by Product Type, 2017 to 2033

Table 55: South Asia Market Value (US$ Million) Forecast by Length, 2017 to 2033

Table 56: South Asia Market Volume (Units) Forecast by Length, 2017 to 2033

Table 57: South Asia Market Value (US$ Million) Forecast by Sales Channel, 2017 to 2033

Table 58: South Asia Market Volume (Units) Forecast by Sales Channel, 2017 to 2033

Table 59: South Asia Market Value (US$ Million) Forecast by End Use, 2017 to 2033

Table 60: South Asia Market Volume (Units) Forecast by End Use, 2017 to 2033

Table 61: Oceania Market Value (US$ Million) Forecast by Country, 2017 to 2033

Table 62: Oceania Market Volume (Units) Forecast by Country, 2017 to 2033

Table 63: Oceania Market Value (US$ Million) Forecast by Product Type, 2017 to 2033

Table 64: Oceania Market Volume (Units) Forecast by Product Type, 2017 to 2033

Table 65: Oceania Market Value (US$ Million) Forecast by Length, 2017 to 2033

Table 66: Oceania Market Volume (Units) Forecast by Length, 2017 to 2033

Table 67: Oceania Market Value (US$ Million) Forecast by Sales Channel, 2017 to 2033

Table 68: Oceania Market Volume (Units) Forecast by Sales Channel, 2017 to 2033

Table 69: Oceania Market Value (US$ Million) Forecast by End Use, 2017 to 2033

Table 70: Oceania Market Volume (Units) Forecast by End Use, 2017 to 2033

Table 71: MEA Market Value (US$ Million) Forecast by Country, 2017 to 2033

Table 72: MEA Market Volume (Units) Forecast by Country, 2017 to 2033

Table 73: MEA Market Value (US$ Million) Forecast by Product Type, 2017 to 2033

Table 74: MEA Market Volume (Units) Forecast by Product Type, 2017 to 2033

Table 75: MEA Market Value (US$ Million) Forecast by Length, 2017 to 2033

Table 76: MEA Market Volume (Units) Forecast by Length, 2017 to 2033

Table 77: MEA Market Value (US$ Million) Forecast by Sales Channel, 2017 to 2033

Table 78: MEA Market Volume (Units) Forecast by Sales Channel, 2017 to 2033

Table 79: MEA Market Value (US$ Million) Forecast by End Use, 2017 to 2033

Table 80: MEA Market Volume (Units) Forecast by End Use, 2017 to 2033

List of Charts

Figure 1: Global Straw Market Value (US$ Million) by Product Type, 2023 to 2033

Figure 2: Global Straw Market Value (US$ Million) by Straw Length, 2023 to 2033

Figure 3: Global Straw Market Value (US$ Million) by Sales Channel, 2023 to 2033

Figure 4: Global Straw Market Value (US$ Million) by End Use, 2023 to 2033

Figure 5: Global Straw Market Value (US$ Million) by Region, 2023 to 2033

Figure 6: Global Straw Market Value (US$ Million) Analysis by Region, 2017 to 2033

Figure 7: Global Straw Market Volume (Units) Analysis by Region, 2017 to 2033

Figure 8: Global Straw Market Value Share (%) and BPS Analysis by Region, 2023 to 2033

Figure 9: Global Straw Market Y-o-Y Growth (%) Projections by Region, 2023 to 2033

Figure 10: Global Straw Market Value (US$ Million) Analysis by Product Type, 2017 to 2033

Figure 11: Global Straw Market Volume (Units) Analysis by Product Type, 2017 to 2033

Figure 12: Global Straw Market Value Share (%) and BPS Analysis by Product Type, 2023 to 2033

Figure 13: Global Straw Market Y-o-Y Growth (%) Projections by Product Type, 2023 to 2033

Figure 14: Global Straw Market Value (US$ Million) Analysis by Straw Length, 2017 to 2033

Figure 15: Global Straw Market Volume (Units) Analysis by Straw Length, 2017 to 2033

Figure 16: Global Straw Market Value Share (%) and BPS Analysis by Straw Length, 2023 to 2033

Figure 17: Global Straw Market Y-o-Y Growth (%) Projections by Straw Length, 2023 to 2033

Figure 18: Global Straw Market Value (US$ Million) Analysis by Sales Channel, 2017 to 2033

Figure 19: Global Straw Market Volume (Units) Analysis by Sales Channel, 2017 to 2033

Figure 20: Global Straw Market Value Share (%) and BPS Analysis by Sales Channel, 2023 to 2033

Figure 21: Global Straw Market Y-o-Y Growth (%) Projections by Sales Channel, 2023 to 2033

Figure 22: Global Straw Market Value (US$ Million) Analysis by End Use, 2017 to 2033

Figure 23: Global Straw Market Volume (Units) Analysis by End Use, 2017 to 2033

Figure 24: Global Straw Market Value Share (%) and BPS Analysis by End Use, 2023 to 2033

Figure 25: Global Straw Market Y-o-Y Growth (%) Projections by End Use, 2023 to 2033

Figure 26: Global Straw Market Attractiveness by Product Type, 2023 to 2033

Figure 27: Global Straw Market Attractiveness by Straw Length, 2023 to 2033

Figure 28: Global Straw Market Attractiveness by Sales Channel, 2023 to 2033

Figure 29: Global Straw Market Attractiveness by End Use, 2023 to 2033

Figure 30: Global Straw Market Attractiveness by Region, 2023 to 2033

Figure 31: North America Straw Market Value (US$ Million) by Product Type, 2023 to 2033

Figure 32: North America Straw Market Value (US$ Million) by Straw Length, 2023 to 2033

Figure 33: North America Straw Market Value (US$ Million) by Sales Channel, 2023 to 2033

Figure 34: North America Straw Market Value (US$ Million) by End Use, 2023 to 2033

Figure 35: North America Straw Market Value (US$ Million) by Country, 2023 to 2033

Figure 36: North America Straw Market Value (US$ Million) Analysis by Country, 2017 to 2033

Figure 37: North America Straw Market Volume (Units) Analysis by Country, 2017 to 2033

Figure 38: North America Straw Market Value Share (%) and BPS Analysis by Country, 2023 to 2033

Figure 39: North America Straw Market Y-o-Y Growth (%) Projections by Country, 2023 to 2033

Figure 40: North America Straw Market Value (US$ Million) Analysis by Product Type, 2017 to 2033

Figure 41: North America Straw Market Volume (Units) Analysis by Product Type, 2017 to 2033

Figure 42: North America Straw Market Value Share (%) and BPS Analysis by Product Type, 2023 to 2033

Figure 43: North America Straw Market Y-o-Y Growth (%) Projections by Product Type, 2023 to 2033

Figure 44: North America Straw Market Value (US$ Million) Analysis by Straw Length, 2017 to 2033

Figure 45: North America Straw Market Volume (Units) Analysis by Straw Length, 2017 to 2033

Figure 46: North America Straw Market Value Share (%) and BPS Analysis by Straw Length, 2023 to 2033

Figure 47: North America Straw Market Y-o-Y Growth (%) Projections by Straw Length, 2023 to 2033

Figure 48: North America Straw Market Value (US$ Million) Analysis by Sales Channel, 2017 to 2033

Figure 49: North America Straw Market Volume (Units) Analysis by Sales Channel, 2017 to 2033

Figure 50: North America Straw Market Value Share (%) and BPS Analysis by Sales Channel, 2023 to 2033

Figure 51: North America Straw Market Y-o-Y Growth (%) Projections by Sales Channel, 2023 to 2033

Figure 52: North America Straw Market Value (US$ Million) Analysis by End Use, 2017 to 2033

Figure 53: North America Straw Market Volume (Units) Analysis by End Use, 2017 to 2033

Figure 54: North America Straw Market Value Share (%) and BPS Analysis by End Use, 2023 to 2033

Figure 55: North America Straw Market Y-o-Y Growth (%) Projections by End Use, 2023 to 2033

Figure 56: North America Straw Market Attractiveness by Product Type, 2023 to 2033

Figure 57: North America Straw Market Attractiveness by Straw Length, 2023 to 2033

Figure 58: North America Straw Market Attractiveness by Sales Channel, 2023 to 2033

Figure 59: North America Straw Market Attractiveness by End Use, 2023 to 2033

Figure 60: North America Straw Market Attractiveness by Country, 2023 to 2033

Figure 61: Latin America Straw Market Value (US$ Million) by Product Type, 2023 to 2033

Figure 62: Latin America Straw Market Value (US$ Million) by Straw Length, 2023 to 2033

Figure 63: Latin America Straw Market Value (US$ Million) by Sales Channel, 2023 to 2033

Figure 64: Latin America Straw Market Value (US$ Million) by End Use, 2023 to 2033

Figure 65: Latin America Straw Market Value (US$ Million) by Country, 2023 to 2033

Figure 66: Latin America Straw Market Value (US$ Million) Analysis by Country, 2017 to 2033

Figure 67: Latin America Straw Market Volume (Units) Analysis by Country, 2017 to 2033

Figure 68: Latin America Straw Market Value Share (%) and BPS Analysis by Country, 2023 to 2033

Figure 69: Latin America Straw Market Y-o-Y Growth (%) Projections by Country, 2023 to 2033

Figure 70: Latin America Straw Market Value (US$ Million) Analysis by Product Type, 2017 to 2033

Figure 71: Latin America Straw Market Volume (Units) Analysis by Product Type, 2017 to 2033

Figure 72: Latin America Straw Market Value Share (%) and BPS Analysis by Product Type, 2023 to 2033

Figure 73: Latin America Straw Market Y-o-Y Growth (%) Projections by Product Type, 2023 to 2033

Figure 74: Latin America Straw Market Value (US$ Million) Analysis by Straw Length, 2017 to 2033

Figure 75: Latin America Straw Market Volume (Units) Analysis by Straw Length, 2017 to 2033

Figure 76: Latin America Straw Market Value Share (%) and BPS Analysis by Straw Length, 2023 to 2033

Figure 77: Latin America Straw Market Y-o-Y Growth (%) Projections by Straw Length, 2023 to 2033

Figure 78: Latin America Straw Market Value (US$ Million) Analysis by Sales Channel, 2017 to 2033

Figure 79: Latin America Straw Market Volume (Units) Analysis by Sales Channel, 2017 to 2033

Figure 80: Latin America Straw Market Value Share (%) and BPS Analysis by Sales Channel, 2023 to 2033

Figure 81: Latin America Straw Market Y-o-Y Growth (%) Projections by Sales Channel, 2023 to 2033

Figure 82: Latin America Straw Market Value (US$ Million) Analysis by End Use, 2017 to 2033

Figure 83: Latin America Straw Market Volume (Units) Analysis by End Use, 2017 to 2033

Figure 84: Latin America Straw Market Value Share (%) and BPS Analysis by End Use, 2023 to 2033

Figure 85: Latin America Straw Market Y-o-Y Growth (%) Projections by End Use, 2023 to 2033

Figure 86: Latin America Straw Market Attractiveness by Product Type, 2023 to 2033

Figure 87: Latin America Straw Market Attractiveness by Straw Length, 2023 to 2033

Figure 88: Latin America Straw Market Attractiveness by Sales Channel, 2023 to 2033

Figure 89: Latin America Straw Market Attractiveness by End Use, 2023 to 2033

Figure 90: Latin America Straw Market Attractiveness by Country, 2023 to 2033

Figure 91: Europe Straw Market Value (US$ Million) by Product Type, 2023 to 2033

Figure 92: Europe Straw Market Value (US$ Million) by Straw Length, 2023 to 2033

Figure 93: Europe Straw Market Value (US$ Million) by Sales Channel, 2023 to 2033

Figure 94: Europe Straw Market Value (US$ Million) by End Use, 2023 to 2033

Figure 95: Europe Straw Market Value (US$ Million) by Country, 2023 to 2033

Figure 96: Europe Straw Market Value (US$ Million) Analysis by Country, 2017 to 2033

Figure 97: Europe Straw Market Volume (Units) Analysis by Country, 2017 to 2033

Figure 98: Europe Straw Market Value Share (%) and BPS Analysis by Country, 2023 to 2033

Figure 99: Europe Straw Market Y-o-Y Growth (%) Projections by Country, 2023 to 2033

Figure 100: Europe Straw Market Value (US$ Million) Analysis by Product Type, 2017 to 2033

Figure 101: Europe Straw Market Volume (Units) Analysis by Product Type, 2017 to 2033

Figure 102: Europe Straw Market Value Share (%) and BPS Analysis by Product Type, 2023 to 2033

Figure 103: Europe Straw Market Y-o-Y Growth (%) Projections by Product Type, 2023 to 2033

Figure 104: Europe Straw Market Value (US$ Million) Analysis by Straw Length, 2017 to 2033

Figure 105: Europe Straw Market Volume (Units) Analysis by Straw Length, 2017 to 2033

Figure 106: Europe Straw Market Value Share (%) and BPS Analysis by Straw Length, 2023 to 2033

Figure 107: Europe Straw Market Y-o-Y Growth (%) Projections by Straw Length, 2023 to 2033

Figure 108: Europe Straw Market Value (US$ Million) Analysis by Sales Channel, 2017 to 2033

Figure 109: Europe Straw Market Volume (Units) Analysis by Sales Channel, 2017 to 2033

Figure 110: Europe Straw Market Value Share (%) and BPS Analysis by Sales Channel, 2023 to 2033

Figure 111: Europe Straw Market Y-o-Y Growth (%) Projections by Sales Channel, 2023 to 2033

Figure 112: Europe Straw Market Value (US$ Million) Analysis by End Use, 2017 to 2033

Figure 113: Europe Straw Market Volume (Units) Analysis by End Use, 2017 to 2033

Figure 114: Europe Straw Market Value Share (%) and BPS Analysis by End Use, 2023 to 2033

Figure 115: Europe Straw Market Y-o-Y Growth (%) Projections by End Use, 2023 to 2033

Figure 116: Europe Straw Market Attractiveness by Product Type, 2023 to 2033

Figure 117: Europe Straw Market Attractiveness by Straw Length, 2023 to 2033

Figure 118: Europe Straw Market Attractiveness by Sales Channel, 2023 to 2033

Figure 119: Europe Straw Market Attractiveness by End Use, 2023 to 2033

Figure 120: Europe Straw Market Attractiveness by Country, 2023 to 2033

Figure 121: East Asia Straw Market Value (US$ Million) by Product Type, 2023 to 2033

Figure 122: East Asia Straw Market Value (US$ Million) by Straw Length, 2023 to 2033

Figure 123: East Asia Straw Market Value (US$ Million) by Sales Channel, 2023 to 2033

Figure 124: East Asia Straw Market Value (US$ Million) by End Use, 2023 to 2033

Figure 125: East Asia Straw Market Value (US$ Million) by Country, 2023 to 2033

Figure 126: East Asia Straw Market Value (US$ Million) Analysis by Country, 2017 to 2033

Figure 127: East Asia Straw Market Volume (Units) Analysis by Country, 2017 to 2033

Figure 128: East Asia Straw Market Value Share (%) and BPS Analysis by Country, 2023 to 2033

Figure 129: East Asia Straw Market Y-o-Y Growth (%) Projections by Country, 2023 to 2033

Figure 130: East Asia Straw Market Value (US$ Million) Analysis by Product Type, 2017 to 2033

Figure 131: East Asia Straw Market Volume (Units) Analysis by Product Type, 2017 to 2033

Figure 132: East Asia Straw Market Value Share (%) and BPS Analysis by Product Type, 2023 to 2033

Figure 133: East Asia Straw Market Y-o-Y Growth (%) Projections by Product Type, 2023 to 2033

Figure 134: East Asia Straw Market Value (US$ Million) Analysis by Straw Length, 2017 to 2033

Figure 135: East Asia Straw Market Volume (Units) Analysis by Straw Length, 2017 to 2033

Figure 136: East Asia Straw Market Value Share (%) and BPS Analysis by Straw Length, 2023 to 2033

Figure 137: East Asia Straw Market Y-o-Y Growth (%) Projections by Straw Length, 2023 to 2033

Figure 138: East Asia Straw Market Value (US$ Million) Analysis by Sales Channel, 2017 to 2033

Figure 139: East Asia Straw Market Volume (Units) Analysis by Sales Channel, 2017 to 2033

Figure 140: East Asia Straw Market Value Share (%) and BPS Analysis by Sales Channel, 2023 to 2033

Figure 141: East Asia Straw Market Y-o-Y Growth (%) Projections by Sales Channel, 2023 to 2033

Figure 142: East Asia Straw Market Value (US$ Million) Analysis by End Use, 2017 to 2033

Figure 143: East Asia Straw Market Volume (Units) Analysis by End Use, 2017 to 2033

Figure 144: East Asia Straw Market Value Share (%) and BPS Analysis by End Use, 2023 to 2033

Figure 145: East Asia Straw Market Y-o-Y Growth (%) Projections by End Use, 2023 to 2033

Figure 146: East Asia Straw Market Attractiveness by Product Type, 2023 to 2033

Figure 147: East Asia Straw Market Attractiveness by Straw Length, 2023 to 2033

Figure 148: East Asia Straw Market Attractiveness by Sales Channel, 2023 to 2033

Figure 149: East Asia Straw Market Attractiveness by End Use, 2023 to 2033

Figure 150: East Asia Straw Market Attractiveness by Country, 2023 to 2033

Figure 151: South Asia Straw Market Value (US$ Million) by Product Type, 2023 to 2033

Figure 152: South Asia Straw Market Value (US$ Million) by Straw Length, 2023 to 2033

Figure 153: South Asia Straw Market Value (US$ Million) by Sales Channel, 2023 to 2033

Figure 154: South Asia Straw Market Value (US$ Million) by End Use, 2023 to 2033

Figure 155: South Asia Straw Market Value (US$ Million) by Country, 2023 to 2033

Figure 156: South Asia Straw Market Value (US$ Million) Analysis by Country, 2017 to 2033

Figure 157: South Asia Straw Market Volume (Units) Analysis by Country, 2017 to 2033

Figure 158: South Asia Straw Market Value Share (%) and BPS Analysis by Country, 2023 to 2033

Figure 159: South Asia Straw Market Y-o-Y Growth (%) Projections by Country, 2023 to 2033

Figure 160: South Asia Straw Market Value (US$ Million) Analysis by Product Type, 2017 to 2033

Figure 161: South Asia Straw Market Volume (Units) Analysis by Product Type, 2017 to 2033

Figure 162: South Asia Straw Market Value Share (%) and BPS Analysis by Product Type, 2023 to 2033

Figure 163: South Asia Straw Market Y-o-Y Growth (%) Projections by Product Type, 2023 to 2033

Figure 164: South Asia Straw Market Value (US$ Million) Analysis by Straw Length, 2017 to 2033

Figure 165: South Asia Straw Market Volume (Units) Analysis by Straw Length, 2017 to 2033

Figure 166: South Asia Straw Market Value Share (%) and BPS Analysis by Straw Length, 2023 to 2033

Figure 167: South Asia Straw Market Y-o-Y Growth (%) Projections by Straw Length, 2023 to 2033

Figure 168: South Asia Straw Market Value (US$ Million) Analysis by Sales Channel, 2017 to 2033

Figure 169: South Asia Straw Market Volume (Units) Analysis by Sales Channel, 2017 to 2033

Figure 170: South Asia Straw Market Value Share (%) and BPS Analysis by Sales Channel, 2023 to 2033

Figure 171: South Asia Straw Market Y-o-Y Growth (%) Projections by Sales Channel, 2023 to 2033

Figure 172: South Asia Straw Market Value (US$ Million) Analysis by End Use, 2017 to 2033

Figure 173: South Asia Straw Market Volume (Units) Analysis by End Use, 2017 to 2033

Figure 174: South Asia Straw Market Value Share (%) and BPS Analysis by End Use, 2023 to 2033

Figure 175: South Asia Straw Market Y-o-Y Growth (%) Projections by End Use, 2023 to 2033

Figure 176: South Asia Straw Market Attractiveness by Product Type, 2023 to 2033

Figure 177: South Asia Straw Market Attractiveness by Straw Length, 2023 to 2033

Figure 178: South Asia Straw Market Attractiveness by Sales Channel, 2023 to 2033

Figure 179: South Asia Straw Market Attractiveness by End Use, 2023 to 2033

Figure 180: South Asia Straw Market Attractiveness by Country, 2023 to 2033

Figure 181: Oceania Straw Market Value (US$ Million) by Product Type, 2023 to 2033

Figure 182: Oceania Straw Market Value (US$ Million) by Straw Length, 2023 to 2033

Figure 183: Oceania Straw Market Value (US$ Million) by Sales Channel, 2023 to 2033

Figure 184: Oceania Straw Market Value (US$ Million) by End Use, 2023 to 2033

Figure 185: Oceania Straw Market Value (US$ Million) by Country, 2023 to 2033

Figure 186: Oceania Straw Market Value (US$ Million) Analysis by Country, 2017 to 2033

Figure 187: Oceania Straw Market Volume (Units) Analysis by Country, 2017 to 2033

Figure 188: Oceania Straw Market Value Share (%) and BPS Analysis by Country, 2023 to 2033

Figure 189: Oceania Straw Market Y-o-Y Growth (%) Projections by Country, 2023 to 2033

Figure 190: Oceania Straw Market Value (US$ Million) Analysis by Product Type, 2017 to 2033

Figure 191: Oceania Straw Market Volume (Units) Analysis by Product Type, 2017 to 2033

Figure 192: Oceania Straw Market Value Share (%) and BPS Analysis by Product Type, 2023 to 2033

Figure 193: Oceania Straw Market Y-o-Y Growth (%) Projections by Product Type, 2023 to 2033

Figure 194: Oceania Straw Market Value (US$ Million) Analysis by Straw Length, 2017 to 2033

Figure 195: Oceania Straw Market Volume (Units) Analysis by Straw Length, 2017 to 2033

Figure 196: Oceania Straw Market Value Share (%) and BPS Analysis by Straw Length, 2023 to 2033

Figure 197: Oceania Straw Market Y-o-Y Growth (%) Projections by Straw Length, 2023 to 2033

Figure 198: Oceania Straw Market Value (US$ Million) Analysis by Sales Channel, 2017 to 2033

Figure 199: Oceania Straw Market Volume (Units) Analysis by Sales Channel, 2017 to 2033

Figure 200: Oceania Straw Market Value Share (%) and BPS Analysis by Sales Channel, 2023 to 2033

Figure 201: Oceania Straw Market Y-o-Y Growth (%) Projections by Sales Channel, 2023 to 2033

Figure 202: Oceania Straw Market Value (US$ Million) Analysis by End Use, 2017 to 2033

Figure 203: Oceania Straw Market Volume (Units) Analysis by End Use, 2017 to 2033

Figure 204: Oceania Straw Market Value Share (%) and BPS Analysis by End Use, 2023 to 2033

Figure 205: Oceania Straw Market Y-o-Y Growth (%) Projections by End Use, 2023 to 2033

Figure 206: Oceania Straw Market Attractiveness by Product Type, 2023 to 2033

Figure 207: Oceania Straw Market Attractiveness by Straw Length, 2023 to 2033

Figure 208: Oceania Straw Market Attractiveness by Sales Channel, 2023 to 2033

Figure 209: Oceania Straw Market Attractiveness by End Use, 2023 to 2033

Figure 210: Oceania Straw Market Attractiveness by Country, 2023 to 2033

Figure 211: MEA Straw Market Value (US$ Million) by Product Type, 2023 to 2033

Figure 212: MEA Straw Market Value (US$ Million) by Straw Length, 2023 to 2033

Figure 213: MEA Straw Market Value (US$ Million) by Sales Channel, 2023 to 2033

Figure 214: MEA Straw Market Value (US$ Million) by End Use, 2023 to 2033

Figure 215: MEA Straw Market Value (US$ Million) by Country, 2023 to 2033

Figure 216: MEA Straw Market Value (US$ Million) Analysis by Country, 2017 to 2033

Figure 217: MEA Straw Market Volume (Units) Analysis by Country, 2017 to 2033

Figure 218: MEA Straw Market Value Share (%) and BPS Analysis by Country, 2023 to 2033

Figure 219: MEA Straw Market Y-o-Y Growth (%) Projections by Country, 2023 to 2033

Figure 220: MEA Straw Market Value (US$ Million) Analysis by Product Type, 2017 to 2033

Figure 221: MEA Straw Market Volume (Units) Analysis by Product Type, 2017 to 2033

Figure 222: MEA Straw Market Value Share (%) and BPS Analysis by Product Type, 2023 to 2033

Figure 223: MEA Straw Market Y-o-Y Growth (%) Projections by Product Type, 2023 to 2033

Figure 224: MEA Straw Market Value (US$ Million) Analysis by Straw Length, 2017 to 2033

Figure 225: MEA Straw Market Volume (Units) Analysis by Straw Length, 2017 to 2033

Figure 226: MEA Straw Market Value Share (%) and BPS Analysis by Straw Length, 2023 to 2033

Figure 227: MEA Straw Market Y-o-Y Growth (%) Projections by Straw Length, 2023 to 2033

Figure 228: MEA Straw Market Value (US$ Million) Analysis by Sales Channel, 2017 to 2033

Figure 229: MEA Straw Market Volume (Units) Analysis by Sales Channel, 2017 to 2033

Figure 230: MEA Straw Market Value Share (%) and BPS Analysis by Sales Channel, 2023 to 2033

Figure 231: MEA Straw Market Y-o-Y Growth (%) Projections by Sales Channel, 2023 to 2033

Figure 232: MEA Straw Market Value (US$ Million) Analysis by End Use, 2017 to 2033

Figure 233: MEA Straw Market Volume (Units) Analysis by End Use, 2017 to 2033

Figure 234: MEA Straw Market Value Share (%) and BPS Analysis by End Use, 2023 to 2033

Figure 235: MEA Straw Market Y-o-Y Growth (%) Projections by End Use, 2023 to 2033

Figure 236: MEA Straw Market Attractiveness by Product Type, 2023 to 2033

Figure 237: MEA Straw Market Attractiveness by Straw Length, 2023 to 2033

Figure 238: MEA Straw Market Attractiveness by Sales Channel, 2023 to 2033

Figure 239: MEA Straw Market Attractiveness by End Use, 2023 to 2033

Figure 240: MEA Straw Market Attractiveness by Country, 2023 to 203

Recommendations

Food and Beverage

Vegan Pasta Market

Published : August 2023

Food and Beverage

Canned Pasta Market

Published : July 2023

Food and Beverage

Gluten-Free Pasta Market

Published : May 2023

Food and Beverage

Vegan Pasta Sauce Market

Published : January 2023

Explore Process Automation Insights

View Reports