Reports

- Global Locations -

Headquarters

Future Market Insights, Inc.

Christiana Corporate, 200
Continental Drive, Suite 401,
Newark, Delaware - 19713,
United States

T: +1-845-579-5705

Americas

Future Market Insights, Inc.

616 Corporate Way, Suite 2-9018,
Valley Cottage, NY 10989, United States

T: +1-347-918-3531

MEA

Future Market Insights

1602-6 Jumeirah Bay X2 Tower, Plot No: JLT-PH2-X2A,
Jumeirah Lakes Towers, Dubai,
United Arab Emirates

Europe

Future Market Insights

3rd Floor, 207 Regent Street,
W1B 3HH London
United Kingdom

T: + 44 (0) 20 8123 9659
D: +44 (0) 20 3287 4268

Asia Pacific

Future Market Insights

IndiaLand Global Tech Park, Unit UG-1, Behind Grand HighStreet, Phase 1, Hinjawadi, MH, Pune – 411057, India

Pea Starch Market Snapshot

[350 Pages Report] Newly released data from pea starch market analysis by Future Market Insights shows that global consumption of pea starch enjoyed a year-on-year (YOY) growth of 5.2% in 2021 to total sales of US$ 115.9 Mn.

Dried peas have been identified to be one of the most versatile pulse alternatives, with a wide variety of end uses. The ingredient is a clean-label, gluten-free, non-GMO, all-natural, slow-digestible starch, which has made it a popular diet option for weight loss without altering the flavour of the final product. Furthermore, pea production takes place all over the world, making pea starch sourcing much easier boosting the global pea starch industry.

In addition to this, the cost-effectiveness of pea starch is also one of the key reasons behind the growth of the pea starch market. As pea starch is cost-effective as compared to the other options available in the market such as corn starch, wheat starch, and potato starch the consumers are opting for pea starch which is souring growth to the pea starch market.

Sales of pea starch will represent 0.7% of the overall demand in the global vegetable protein market. Increasing preventative healthcare and the recent outbreak of deadly viruses are boosting growth in the overall vegetable protein market triggering growth in the pea starch market.

Moreover, in the past few years, a huge consumer base around the globe are suffering from several food allergies. Thus the demand for allergen-free food is increasing as a result demand for allergen-free food ingredients such as pea starch is also gaining traction

Don't pay for what you don't need

Customize your report by selecting specific countries or regions and save 30%!

How The Market Progressed Till June 2022?

Market Statistics Details
H1,2021 (A) 5.1%
H1,2022 Projected (P) 5.2%
H1,2022 Outlook (O) 5.7%
BPS Change : H1,2022 (O) - H1,2022 (P) (+) 52 ↑
BPS Change : H1,2022 (O) - H1,2021 (A) (+) 57.2 ↑

FMI provides a half-yearly comparison study and evaluation of the worldwide market's growth rates as well as its future development potential. Under the subjective effect of macro and industry variables, certain demographic and innovation aspects dominate the market.

With 30% to 60% dry weight, pea starch functions as a possible food element. Compared to other starches, pea starches have a greater amylose content. It has several advantageous characteristics, including a strong resistance to shear-thinning, a high gelatinization temperature, a high gel elasticity, and quick retrogradation.

Food goods including gluten-free noodles, sausages, and meat products require a high degree of gel elasticity and quick retrogradation.

Furthermore, it is crucial that starch pastes withstand shear thinning at high temperatures for extruded snacks and canned meals. Pea starch is a useful raw ingredient for enhancing the consistency and texture of foods.

Some new developments that have taken place in these markets include:

  • To gain more experience in new initiatives, such as cutting-edge texture and stability solutions for the food and beverage industry, Ingredion purchased KaTech in April 2021.
  • Emsland Group committed more than USD 40.98 million to a new plant project in October 2021 for the purpose of drying and modifying pea and potato starch. To meet the growing demand for pea starch, the new initiative would enhance the production capacity of components derived from peas.
  • Roquette Frères introduced "Beaute by Roquette ST 720," a novel pea starch, for the cosmetics industry in April 2020. This launch strengthened the company's line of products.

The first half of 2021 saw growth of 5.1% in the worldwide pea starch market. But not all regions have experienced this increase equally, with the developing markets experiencing greater growth rates of 5.7% (H1 2022 Expected). This results in a difference between expected and predicted growth for H1 2022 of 57.2 BPS points.

Due to growing end-user demand in important economies and their expanding populations, the market either took off slowly or quickly over the first half of the projection period. Particularly, India and China are both experiencing growth in their consumption patterns, which is driving up demand for pea starch.

The Asia Pacific area has the biggest market for pea starch. Due to the increase in demand from major economies like China, India, Japan, and other Southeast Asian nations, it is predicted to develop at a high growth rate. One of the world's major pea processing areas in Asia.

For processing, China brought in roughly 1.8 million tonnes of dry peas in 2018. These Asia Pacific nations generally use the peas they process to produce pea starch and pea protein. In the second half of the projection period, numerous other market segments are anticipated to perform reasonably and achieve attractive development possibilities.

Despite these promising developments, the business is still expected to face significant obstacles, such as shifting customer tastes, strict trade restrictions, and a lack of security in the supply of raw materials and other production inputs.

High Starch Content in Pea is Triggering Overall Pea Starch Market

The high amount of starch in peas is a major driving factor behind the worldwide pea starch market's expansion. In addition, the global food and beverage industry's increased health consciousness, as well as changes in flavour, quality, and taste, are all contributing to growth.

The global pea starch market has recently found applications in food processing, baking and pharmaceutical products, prompting end-product manufacturers to use larger amounts of pea starch, a trend driven by the popularity of sustainable and nutrition-rich foods without sacrificing convenience, which will contribute to the pea starch market's growth.

Furthermore, due to a growing population of gluten-sensitive, health-conscious people, the gluten-free pea starch trend is doing well, resulting in the rapid growth of gluten-free pea starch in a variety of bakery products. Pea starch also performs well in baked items in terms of structure and texture, making it a popular alternative to starch derived from traditional sources like maize, tapioca and potato.

Pea starch is an excellent extender ingredient for meat products including sliced turkey, sausages, chicken nuggets, beef burgers and chicken breasts because of its gel-like qualities.

Country-Wise Analysis

Increasing Health-Related Concerns are Driving Growth in the US Pea Starch Market

According to FMI, the US is the dominating country in the North American region holding more than 80% share in 2021, but Canada is expected to witness a lucrative growth rate of CAGR 6.2% during the forecasted period.

In the past few years, the US has become one of the key markets for bakeries, snacks and savoury products. However, increasing health-related concerns among the consumer base in the US is increasing demand for bakeries, snacks and savoury products with healthy ingredients. Hence, the growing demand for healthy food ingredients is driving growth in the pea starch market.

Increasing Demand for High-Quality Pet Food Is Boosting Pea Starch Sales in Germany

Germany is expected to dominate the European pea starch market holding more than 15% share in the European region and it is expected to grow with a significant CAGR of 3.4% in the forecasted period.

Pea starch is commonly used in pet food as a source of carbohydrates to improve the feed's quality and texture. The pet food market in Germany has grown significantly in recent years. Furthermore, pet owners in Germany are concerned about their pets' health and food. As a result, rising demand for high-quality pet food is moving the pea starch market forward.

Growing Demand for Organic Products is Triggering Growth in the UK Pea Starch Market

The millennial and gen Z consumer base in the UK is key growth enabler of the UK pea starch market. Over the past few years, the Gen Z and millennial consumer base in the UK are being aware of the health benefits associated with the consumption of organic products and hence started opting for organic food products.

As a result, the key food product manufacturers started introducing the organic version of their product offerings. Thus the demand for organic versions of ingredients used in food production is gaining traction which is also propelling growth to the organic pea starch market.

Industrial Pea Starch is Promoting Pea Starch Adoption in China

According to FMI, China's pea starch market is expected to grow with a 4.7% CAGR in the forecasted period. One of the key reasons behind the growth of the china pea starch market is the increasing demand for pea starch-enriched soups and sauces. Over the past few years, China has experienced significant growth in the demand for starch-enriched food products.

Being one of the significant markets for soups and sauces, the china soup and sauces market is experiencing significant demand for starch-enriched soups and sauces which is propelling growth to the pea starch market.

Increasing Demand for Clean Label Products in the Cosmetics Industry is boosting sales of the India Pea Starch Market

Over the past few years, the consumer base in the Indian region has become aware of the cosmetic products they use and the ingredients involved in the manufacturing of their cosmetic products. Thus opting for cosmetic products with beneficial properties such as non-allergic properties. Hence cosmetic product manufacturers are using pea starch in their products owing to its non-allergic and other beneficial properties.

Nandini Roy Choudhury

Principal Consultant

Talk to Analyst

Find your sweet spots for generating winning opportunities in this market.

Category-wise Insights

Conventional Pea Starch is dominating the Global Pea Starch Market

Based on nature, Conventional pea starch is estimated to account for around 85% share in the year 2021, but organic pea starch is anticipated to witness a significant growth rate of CAGR 7.8% during the forecasted period. 

In the past few years, a huge consumer base around the globe has become aware of personal health and started opting for food products with high-quality ingredients. Thus the food product manufacturer started opting for organic food ingredients to target the health-conscious consumer base. Hence the increasing use of organic ingredients in the food industry is one of the key reasons behind the growth of the organic pea starch market.

Thickening and Binding Application is Boosting the Application Segment

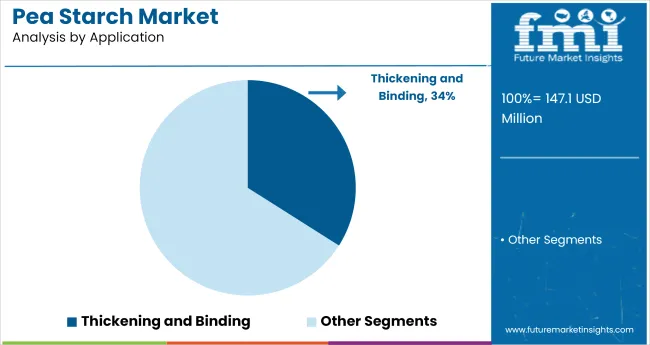
The thickening and binding application of pea starch are dominating the application segment holding more than 30% share in the year 2020 and it is expected to grow with a CAGR of 5.9% over the forecasted period. Pea starch is used as a thickening and binding agent in the food, cosmetics and pharmaceutical industries. Owing to application in so many industries thickening and binding application is dominating the application of the pea starch market.

Food Processing Industry is Triggering Growth in the Pea Starch Market

Based on end-use, the food processing industry is holding a maximum share of around 25% in the year 2021 and it is expected to grow with a CAGR of 5.1% over the forecasted period. Over the past few years the demand for

With the increasing popularity of the health benefits of pea starch, the consumer base around the globe started opting for food products containing pea starch. Thus to capture this opportunity several players involved in the food processing industry started using pea starch in their products which is triggering the overall pea starch market.

Competition Landscape: Top Pea Starch Manufacturers

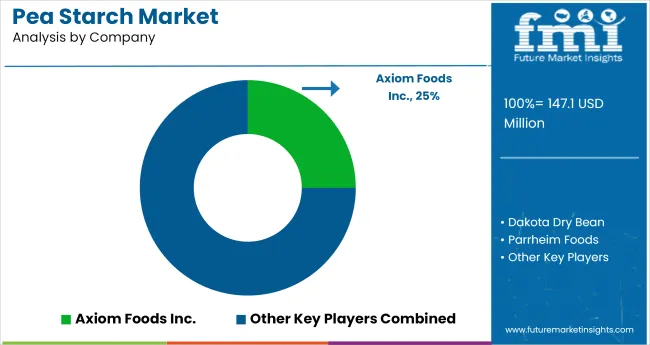
According to the market research analysis Axiom Foods Inc., Dakota Dry Bean, Parrheim Foods, American Key Products, Roquette, Emsland Group, Sanstar Bio-Polymers, Cargill Inc., Vestkorn, are identified as key players in the pea starch market.

The use of pea starch is widely increasing among a wide variety of industries such as food, pet food, cosmetics and pharmaceuticals. Due to increasing demand for pea starch from several industries, pea starch manufacturers are focusing on introducing newer products and also increasing the production capacity to make the supply chain more efficient as well as to reduce the chances of shortage of pea starch-based products.

Get the data you need at a Fraction of the cost

Personalize your report by choosing insights you need
and save 40%!

Scope of Report

Attribute Details
Market Size Value in 2020 US$ 108.9 Million
Market Forecast Value in 2031 US$ 199.3 Million
Global Growth Rate 7.2
Forecast Period 2021 to 2031
Historical Data Available for 2016 to 2020
Market Analysis MT for Volume and US$ Mn for Value
Key Regions Covered North America, Latin America, Europe, Japan, APEJ and MEA
Key Countries Covered United States, Canada, Brazil, Mexico, Argentina, EU5, Russia, Poland, China, ASEAN, Australia and New Zealand, Japan, GCC countries, Ethiopia, North Africa, South Africa, and others.
Key Market Segments Covered Nature, Grade, Application, End-Use and Regions
Key Companies Profiled
  • Axiom Foods Inc.
  • Dakota Dry Bean
  • Parrheim Foods
  • Cargill Inc.
  • Vestkorn
  • Roquette
  • Sanstar Bio-Polymers
  • Emsland Group
  • American Key Products
  • Others

Market Segments Covered in Pea Starch Industry Analysis

By Nature :

  • Organic
  • Conventional

By Application :

  • Thickening and Binding
  • Gelling
  • Texturizing
  • Others

By Grade :

  • Feed Grade
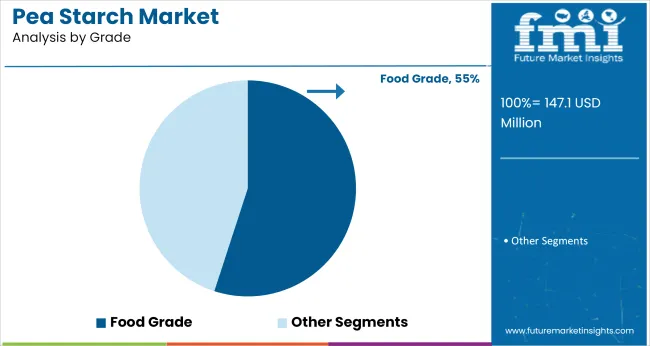
  • Food Grade
  • Industrial Grade

By End-Use :

  • Soups and Sauces
  • Snacks and Savory
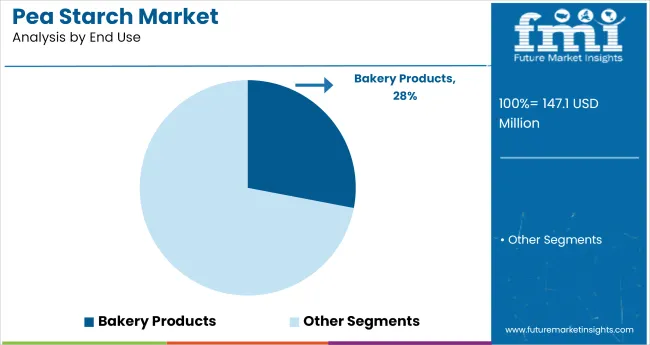
  • Bakery Products
  • Food Processing Industry
  • Cosmetics
  • Pharmaceuticals
  • Pet Food Industry

By Region :

  • North America
  • Latin America
  • Europe
  • Japan
  • APEJ
  • MEA

Frequently Asked Questions

What may be the Y-O-Y Growth for the Market?

The consumption of pea starch increased by 5.2% year over year (YOY).

What is the Estimated Value for the Market through 2031?

The market is anticipated to generate US$ 115.9 million through 2031.

What is the Share of Pea Starch in the Global Vegetable Protein Demand?

Pea starch sales are to account for 0.7% of the total demand for vegetable proteins.

Which Country is Expected to Hold a Dominant Position in North America’s Market in 2031?

With more than 80% of the market, the United States is the dominant country in North America.

What is the Projected CAGR for Germany in the Forecasted Period?

Germany is expected to control Europe’s pea starch market, which may expand at a notable CAGR of 3.4 through 2031

Table of Content

1. Market Overview

    1.1. Market Coverage / Taxonomy

    1.2. Market Definition / Scope / Limitations

2. The Massive Impact of the Crisis

    2.1. Global Market Forecast Scenario Comparison of Annual Growth Rates for short Term (2021-2025) and Long Term (2026-2031)

        2.1.1. Optimistic Scenario

        2.1.2. Likely Scenario

        2.1.3. Pessimistic Scenario

    2.2. Key Factors Impacting the Market

    Note: Market Assessment shall be Provided for Likely Scenario

3. Market Dynamics

    3.1. Drivers

        3.1.1. Supply Side Drivers

        3.1.2. Demand Side drivers

        3.1.3. Economic Side Drivers

    3.2. Restraints

    3.3. Opportunity

    3.4. Market trends By Region

    3.5. Product Launches

    3.6. Product Claims & Nutritional Information Scan by Buyers

    3.7. Macro-Economic Factors

    3.8. Forecast Factors - Relevance & Impact

    3.9. Consumers Survey Analysis

4. Key Regulations

    4.1. Packaging & Labelling Regulations

    4.2. Certifications and Certifying Agency Overview

    4.3. Import/Export Policies

5. Value Chain Analysis

    5.1. Operating margins at each node of supply chain

    5.2. List of Active Market Participants

        5.2.1. Raw Material Suppliers

        5.2.2. Product Manufacturers

        5.2.3. Key Brands

6. Global Market Demand Analysis 2016-2020 and Forecast, 2021-2031

    6.1. Historical Market Volume (Metric Tons) Analysis, 2016-2020

    6.2. Current and Future Market Volume (Metric Tons) Projections, 2021-2031

    6.3. Y-o-Y Growth Trend Analysis

7. Global Market - Pricing Analysis

    7.1. Regional Pricing Analysis (US$/Metric Tons) By Nature

    7.2. Pricing Break-up By category

    7.3. Global Average Pricing Analysis Benchmark

8. Global Market Demand (Size in US$ Mn) Analysis 2016-2020 and Forecast, 2021-2031

    8.1. Historical Market Value (US$ Mn) Analysis, 2016-2020

    8.2. Current and Future Market Value (US$ Mn) Projections, 2021-2031

        8.2.1. Y-o-Y Growth Trend Analysis

        8.2.2. Absolute $ Opportunity Analysis

9. Global Market Analysis 2016-2020 and Forecast 2021-2031, By Nature

    9.1. Introduction / Key Findings

    9.2. Historical Market Size (US$ Mn) and Volume Analysis By Nature, 2016 - 2020

    9.3. Current and Future Market Size (US$ Mn) and Volume Analysis and Forecast By Nature, 2021-2031

        9.3.1. Organic

        9.3.2. Conventional

    9.4. Market Attractiveness Analysis By Nature

10. Global Market Analysis 2016-2020 and Forecast 2021-2031, By Grade

    10.1. Introduction / Key Findings

    10.2. Historical Market Size (US$ Mn) and Volume Analysis By Grade, 2016 - 2020

    10.3. Current and Future Market Size (US$ Mn) and Volume Analysis and Forecast By Grade, 2021-2031

        10.3.1. Food Grade

        10.3.2. Feed Grade

        10.3.3. Industrial Grade

    10.4. Market Attractiveness Analysis By Grade

11. Global Market Analysis 2016-2020 and Forecast 2021-2031, By Application

    11.1. Introduction / Key Findings

    11.2. Historical Market Size (US$ Mn) and Volume Analysis By Application, 2016 - 2020

    11.3. Current and Future Market Size (US$ Mn) and Volume Analysis and Forecast By Application, 2021-2031

        11.3.1. Thickening and Binding

        11.3.2. Texturizing

        11.3.3. Gelling

        11.3.4. Others

    11.4. Market Attractiveness Analysis By Application

12. Global Market Analysis 2016-2020 and Forecast 2021-2031, By End-User

    12.1. Introduction / Key Findings

    12.2. Historical Market Size (US$ Mn) and Volume Analysis By End-User, 2016 - 2020

    12.3. Current and Future Market Size (US$ Mn) and Volume Analysis and Forecast By End-User, 2021-2031

        12.3.1. Soups and Sauces

        12.3.2. Snacks and Savoury

        12.3.3. Bakery Products

        12.3.4. Food Processing Industry

        12.3.5. Pet Food Industry

        12.3.6. Pharmaceuticals

        12.3.7. Cosmetics

    12.4. Market Attractiveness Analysis By End-User

13. Global Market Analysis 2016-2020 and Forecast 2021-2031, By Region

    13.1. Introduction

    13.2. Historical Market Size (US$ Mn) and Volume Analysis By Region, 2016 - 2020

    13.3. Current Market Size (US$ Mn) and Volume Analysis and Forecast By Region, 2021-2031

        13.3.1. North America

        13.3.2. Latin America

        13.3.3. Europe

        13.3.4. Japan

        13.3.5. APEJ

        13.3.6. Middle East and Africa (MEA)

    13.4. Market Attractiveness Analysis By Region

14. North America Market Analysis 2016-2020 and Forecast 2021-2031

    14.1. Introduction

    14.2. Pricing Analysis

    14.3. Historical Market Size (US$ Mn) and Volume Trend Analysis By Market Taxonomy, 2016 - 2020

    14.4. Market Size (US$ Mn) and Volume Forecast By Market Taxonomy, 2021 - 2031

        14.4.1.  By Country

            14.4.1.1. U.S.

            14.4.1.2. Canada

        14.4.2. By Nature

        14.4.3. By Grade

        14.4.4. By Application

        14.4.5. By End-User

    14.5. Market Attractiveness Analysis

        14.5.1. By Nature

        14.5.2. By Grade

        14.5.3. By Application

        14.5.4. By End-User

    14.6. Market Trends

    14.7. Key Market Participants - Intensity Mapping

    14.8. Drivers and Restraints - Impact Analysis

15. Latin America Market Analysis 2016-2020 and Forecast 2021-2031

    15.1. Introduction

    15.2. Pricing Analysis

    15.3. Historical Market Size (US$ Mn) and Volume Trend Analysis By Market Taxonomy, 2016 - 2020

    15.4. Market Size (US$ Mn) and Volume Forecast By Market Taxonomy, 2021 - 2031

        15.4.1.  By Country

            15.4.1.1. Brazil

            15.4.1.2. Mexico

            15.4.1.3. Argentina

            15.4.1.4. Rest of Latin America

        15.4.1. By Nature

        15.4.2. By Grade

        15.4.3. By Application

        15.4.4. By End-User

    15.5. Market Attractiveness Analysis

        15.5.1. By Nature

        15.5.2. By Grade

        15.5.3. By Application

        15.5.4. By End-User

    15.6. Market Attractiveness Analysis

    15.7. Market Trends

    15.8. Key Market Participants - Intensity Mapping

    15.9. Drivers and Restraints - Impact Analysis

16. Europe Market Analysis 2016-2020 and Forecast 2021-2031

    16.1. Introduction

    16.2. Pricing Analysis

    16.3. Historical Market Size (US$ Mn) and Volume Trend Analysis By Market Taxonomy, 2016 - 2020

    16.4. Market Size (US$ Mn) and Volume Forecast By Market Taxonomy, 2021 - 2031

        16.4.1.  By Country

            16.4.1.1. EU5

            16.4.1.2. Russia

            16.4.1.3. Poland

            16.4.1.4. Rest of Europe

        16.4.2. By Nature

        16.4.3. By Grade

        16.4.4. By Application

        16.4.5. By End-User

    16.5. Market Attractiveness Analysis

        16.5.1. By Nature

        16.5.2. By Grade

        16.5.3. By Application

        16.5.4. By End-User

    16.6. Market Attractiveness Analysis

    16.7. Market Trends

    16.8. Key Market Participants - Intensity Mapping

    16.9. Drivers and Restraints - Impact Analysis

17. Japan Market Analysis 2016-2020 and Forecast 2021-2031

    17.1. Introduction

    17.2. Pricing Analysis

    17.3. Historical Market Size (US$ Mn) and Volume Trend Analysis By Market Taxonomy, 2016 - 2020

    17.4. Market Size (US$ Mn) and Volume Forecast By Market Taxonomy, 2021 - 2031

        17.4.1. By Nature

        17.4.2. By Grade

        17.4.3. By Application

        17.4.4. By End-User

    17.5. Market Attractiveness Analysis

        17.5.1. By Nature

        17.5.2. By Grade

        17.5.3. By Application

        17.5.4. By End-User

    17.6. Market Attractiveness Analysis

    17.7. Market Trends

    17.8. Key Market Participants - Intensity Mapping

    17.9. Drivers and Restraints - Impact Analysis

18. APEJ Market Analysis 2016-2020 and Forecast 2021-2031

    18.1. Introduction

    18.2. Pricing Analysis

    18.3. Historical Market Size (US$ Mn) and Volume Trend Analysis By Market Taxonomy, 2016 - 2020

    18.4. Market Size (US$ Mn) and Volume Forecast By Market Taxonomy, 2021 - 2031

        18.4.1.  By Country

            18.4.1.1. China

            18.4.1.2. India

            18.4.1.3. ASEAN

            18.4.1.4. Australia & New Zealand

            18.4.1.5. Rest of APEJ

        18.4.2. By Nature

        18.4.3. By Grade

        18.4.4. By Application

        18.4.5. By End-Use

    18.5. Market Attractiveness Analysis

        18.5.1. By Nature

        18.5.2. By Grade

        18.5.3. By Application

        18.5.4. By End-Use

    18.6. Market Attractiveness Analysis

    18.7. Market Trends

    18.8. Key Market Participants - Intensity Mapping

    18.9. Drivers and Restraints - Impact Analysis

19. Middle East and Africa Market Analysis 2016-2020 and Forecast 2021-2031

    19.1. Introduction

    19.2. Pricing Analysis

    19.3. Historical Market Size (US$ Mn) and Volume Trend Analysis By Market Taxonomy, 2016 - 2020

    19.4. Market Size (US$ Mn) and Volume Forecast By Market Taxonomy, 2021 - 2031

        19.4.1.  By Country

            19.4.1.1. GCC Countries

            19.4.1.2. Ethopia

            19.4.1.3. North Africa

            19.4.1.4. South Africa

            19.4.1.5. Rest of MEA

        19.4.2. By Nature

        19.4.3. By Grade

        19.4.4. By Application

        19.4.5. By End-Use

    19.5. Market Attractiveness Analysis

        19.5.1. By Nature

        19.5.2. By Grade

        19.5.3. By Application

        19.5.4. By End-Use

    19.6. By End-Use Market Attractiveness Analysis

    19.7. Market Trends

    19.8. Key Market Participants - Intensity Mapping

    19.9. Drivers and Restraints - Impact Analysis

20. Key Countries Market Analysis 2016–2020 and Forecast 2021–2031

    20.1. U.S.

        20.1.1. Introduction

        20.1.2. Pricing Analysis (2016, 2021, 2031)

        20.1.3. Market Value and Volume Analysis 2016–2020 and Forecast 2021–2031

            20.1.3.1. By Nature

            20.1.3.2. By Grade

            20.1.3.3. By Application

            20.1.3.4. By End-Use

    20.2. Canada

        20.2.1. Pricing Analysis (2016, 2021, 2031)

        20.2.2. Market Value and Volume Analysis 2016–2020 and Forecast 2021–2031

            20.2.2.1. By Nature

            20.2.2.2. By Grade

            20.2.2.3. By Application

            20.2.2.4. By End-Use

    20.3. Brazil

        20.3.1. Pricing Analysis (2016, 2021, 2031)

        20.3.2. Market Value and Volume Analysis 2016–2020 and Forecast 2021–2031

            20.3.2.1. By Nature

            20.3.2.2. By Grade

            20.3.2.3. By Application

            20.3.2.4. By End-Use

    20.4. Mexico

        20.4.1. Pricing Analysis (2016, 2021, 2031)

        20.4.2. Market Value and Volume Analysis 2016–2020 and Forecast 2021–2031

            20.4.2.1. By Nature

            20.4.2.2. By Grade

            20.4.2.3. By Application

            20.4.2.4. By End-Use

    20.5. Argentina

        20.5.1. Pricing Analysis (2016, 2021, 2031)

        20.5.2. Market Value and Volume Analysis 2016–2020 and Forecast 2021–2031

            20.5.2.1. By Nature

            20.5.2.2. By Grade

            20.5.2.3. By Application

            20.5.2.4. By End-Use

    20.6. Chile

        20.6.1. Pricing Analysis (2016, 2021, 2031)

        20.6.2. Market Value and Volume Analysis 2016–2020 and Forecast 2021–2031

            20.6.2.1. By Nature

            20.6.2.2. By Grade

            20.6.2.3. By Application

            20.6.2.4. By End-Use

    20.7. Germany

        20.7.1. Pricing Analysis (2016, 2021, 2031)

        20.7.2. Market Value and Volume Analysis 2016–2020 and Forecast 2021–2031

            20.7.2.1. By Nature

            20.7.2.2. By Grade

            20.7.2.3. By Application

            20.7.2.4. By End-Use

    20.8. Italy

        20.8.1. Pricing Analysis (2016, 2021, 2031)

        20.8.2. Market Value and Volume Analysis 2016–2020 and Forecast 2021–2031

            20.8.2.1. By Nature

            20.8.2.2. By Grade

            20.8.2.3. By Application

            20.8.2.4. By End-Use

    20.9. France

        20.9.1. Pricing Analysis (2016, 2021, 2031)

        20.9.2. Market Value and Volume Analysis 2016–2020 and Forecast 2021–2031

            20.9.2.1. By Nature

            20.9.2.2. By Grade

            20.9.2.3. By Application

            20.9.2.4. By End-Use

    20.10. U.K.

        20.10.1. Pricing Analysis (2016, 2021, 2031)

        20.10.2. Market Value and Volume Analysis 2016–2020 and Forecast 2021–2031

            20.10.2.1. By Nature

            20.10.2.2. By Grade

            20.10.2.3. By Application

            20.10.2.4. By End-Use

    20.11. Spain

        20.11.1. Pricing Analysis (2016, 2021, 2031)

        20.11.2. Market Value and Volume Analysis 2016–2020 and Forecast 2021–2031

            20.11.2.1. By Nature

            20.11.2.2. By Grade

            20.11.2.3. By Application

            20.11.2.4. By End-Use

    20.12. Benelux

        20.12.1. Pricing Analysis (2016, 2021, 2031)

        20.12.2. Market Value and Volume Analysis 2016–2020 and Forecast 2021–2031

            20.12.2.1. By Nature

            20.12.2.2. By Grade

            20.12.2.3. By Application

            20.12.2.4. By End-Use

    20.13. Russia

        20.13.1. Pricing Analysis (2016, 2021, 2031)

        20.13.2. Market Value and Volume Analysis 2016–2020 and Forecast 2021–2031

            20.13.2.1. By Nature

            20.13.2.2. By Grade

            20.13.2.3. By Application

            20.13.2.4. By End-Use

    20.14. India

        20.14.1. Pricing Analysis (2016, 2021, 2031)

        20.14.2. Market Value and Volume Analysis 2016–2020 and Forecast 2021–2031

            20.14.2.1. By Nature

            20.14.2.2. By Grade

            20.14.2.3. By Application

            20.14.2.4. By End-Use

    20.15. Thailand

        20.15.1. Pricing Analysis (2016, 2021, 2031)

        20.15.2. Market Value and Volume Analysis 2016–2020 and Forecast 2021–2031

            20.15.2.1. By Nature

            20.15.2.2. By Grade

            20.15.2.3. By Application

            20.15.2.4. By End-Use

    20.16. Indonesia

        20.16.1. Pricing Analysis (2016, 2021, 2031)

        20.16.2. Market Value and Volume Analysis 2016–2020 and Forecast 2021–2031

            20.16.2.1. By Nature

            20.16.2.2. By Grade

            20.16.2.3. By Application

            20.16.2.4. By End-Use

    20.17. Malaysia

        20.17.1. Pricing Analysis (2016, 2021, 2031)

        20.17.2. Market Value and Volume Analysis 2016–2020 and Forecast 2021–2031

            20.17.2.1. By Nature

            20.17.2.2. By Grade

            20.17.2.3. By Application

            20.17.2.4. By End-Use

    20.18. China

        20.18.1. Pricing Analysis (2016, 2021, 2031)

        20.18.2. Market Value and Volume Analysis 2016–2020 and Forecast 2021–2031

            20.18.2.1. By Nature

            20.18.2.2. By Grade

            20.18.2.3. By Application

            20.18.2.4. By End-Use

    20.19. Japan

        20.19.1. Pricing Analysis (2016, 2021, 2031)

        20.19.2. Market Value and Volume Analysis 2016–2020 and Forecast 2021–2031

            20.19.2.1. By Nature

            20.19.2.2. By Grade

            20.19.2.3. By Application

            20.19.2.4. By End-Use

    20.20. South Korea

        20.20.1. Pricing Analysis (2016, 2021, 2031)

        20.20.2. Market Value and Volume Analysis 2016–2020 and Forecast 2021–2031

            20.20.2.1. By Nature

            20.20.2.2. By Grade

            20.20.2.3. By Application

            20.20.2.4. By End-Use

    20.21. Australia

        20.21.1. Pricing Analysis (2016, 2021, 2031)

        20.21.2. Market Value and Volume Analysis 2016–2020 and Forecast 2021–2031

            20.21.2.1. By Nature

            20.21.2.2. By Grade

            20.21.2.3. By Application

            20.21.2.4. By End-Use

    20.22. New Zealand

        20.22.1. Pricing Analysis (2016, 2021, 2031)

        20.22.2. Market Value and Volume Analysis 2016–2020 and Forecast 2021–2031

            20.22.2.1. By Nature

            20.22.2.2. By Grade

            20.22.2.3. By Application

            20.22.2.4. By End-Use

    20.23. GCC Countries

        20.23.1. Pricing Analysis (2016, 2021, 2031)

        20.23.2. Market Value and Volume Analysis 2016–2020 and Forecast 2021–2031

            20.23.2.1. By Nature

            20.23.2.2. By Grade

            20.23.2.3. By Application

            20.23.2.4. By End-Use

    20.24. Central Africa

        20.24.1. Pricing Analysis (2016, 2021, 2031)

        20.24.2. Market Value and Volume Analysis 2016–2020 and Forecast 2021–2031

            20.24.2.1. By Nature

            20.24.2.2. By Grade

            20.24.2.3. By Application

            20.24.2.4. By End-Use

    20.25. Northern Africa

        20.25.1. Pricing Analysis (2016, 2021, 2031)

        20.25.2. Market Value and Volume Analysis 2016–2020 and Forecast 2021–2031

            20.25.2.1. By Nature

            20.25.2.2. By Grade

            20.25.2.3. By Application

            20.25.2.4. By End-Use

    20.26. South Africa

        20.26.1. Pricing Analysis (2016, 2021, 2031)

        20.26.2. Market Value and Volume Analysis 2016–2020 and Forecast 2021–2031

            20.26.2.1. By Nature

            20.26.2.2. By Grade

            20.26.2.3. By Application

            20.26.2.4. By End-Use

21. Competition Analysis

    21.1. Market Analysis by Tier of Companies

    21.2. Company Share Analysis of Top Players

    21.3. Market Presence Analysis

22. Company Profiles

    22.1. Competition Dashboard

    22.2. Competition Deep Dive (Tentative List)

            22.2.1.1. Axiom Foods Inc.

            22.2.1.2. Overview

            22.2.1.3. Product Portfolio

            22.2.1.4. Profitability by Market Segments (Product/Channel/Region)

            22.2.1.5. Sales Footprint

            22.2.1.6. Strategy Overview

                22.2.1.6.1. Marketing Strategy

                22.2.1.6.2. Product Strategy

        22.2.2. Dakota Dry Bean

            22.2.2.1. Overview

            22.2.2.2. Product Portfolio

            22.2.2.3. Profitability by Market Segments (Product/Channel/Region)

            22.2.2.4. Sales Footprint

            22.2.2.5. Strategy Overview

                22.2.2.5.1. Marketing Strategy

                22.2.2.5.2. Product Strategy

        22.2.3. Parrheim Foods

            22.2.3.1. Overview

            22.2.3.2. Product Portfolio

            22.2.3.3. Profitability by Market Segments (Product/Channel/Region)

            22.2.3.4. Sales Footprint

            22.2.3.5. Strategy Overview

                22.2.3.5.1. Marketing Strategy

                22.2.3.5.2. Product Strategy

        22.2.4. Cargill Inc.

            22.2.4.1. Overview

            22.2.4.2. Product Portfolio

            22.2.4.3. Profitability by Market Segments (Product/Channel/Region)

            22.2.4.4. Sales Footprint

            22.2.4.5. Strategy Overview

                22.2.4.5.1. Marketing Strategy

                22.2.4.5.2. Product Strategy

        22.2.5. Vestkorn

            22.2.5.1. Overview

            22.2.5.2. Product Portfolio

            22.2.5.3. Profitability by Market Segments (Product/Channel/Region)

            22.2.5.4. Sales Footprint

            22.2.5.5. Strategy Overview

                22.2.5.5.1. Marketing Strategy

                22.2.5.5.2. Product Strategy

        22.2.6. Roquette

            22.2.6.1. Overview

            22.2.6.2. Product Portfolio

            22.2.6.3. Profitability by Market Segments (Product/Channel/Region)

            22.2.6.4. Sales Footprint

            22.2.6.5. Strategy Overview

                22.2.6.5.1. Marketing Strategy

                22.2.6.5.2. Product Strategy

        22.2.7. Sanstar Bio-Polymers

            22.2.7.1. Overview

            22.2.7.2. Product Portfolio

            22.2.7.3. Profitability by Market Segments (Product/Channel/Region)

            22.2.7.4. Sales Footprint

            22.2.7.5. Strategy Overview

                22.2.7.5.1. Marketing Strategy

                22.2.7.5.2. Product Strategy

        22.2.8. Emsland Group

            22.2.8.1. Overview

            22.2.8.2. Product Portfolio

            22.2.8.3. Profitability by Market Segments (Product/Channel/Region)

            22.2.8.4. Sales Footprint

            22.2.8.5. Strategy Overview

                22.2.8.5.1. Marketing Strategy

                22.2.8.5.2. Product Strategy

        22.2.9. American Key Products

            22.2.9.1. Overview

            22.2.9.2. Product Portfolio

            22.2.9.3. Profitability by Market Segments (Product/Channel/Region)

            22.2.9.4. Sales Footprint

            22.2.9.5. Strategy Overview

                22.2.9.5.1. Marketing Strategy

                22.2.9.5.2. Product Strategy

        22.2.10. Other Players (On Additional Requests)

            22.2.10.1. Overview

            22.2.10.2. Product Portfolio

            22.2.10.3. Profitability by Market Segments (Product/Channel/Region)

            22.2.10.4. Sales Footprint

            22.2.10.5. Strategy Overview

                22.2.10.5.1. Marketing Strategy

                22.2.10.5.2. Product Strategy

23. Assumptions and Acronyms Used

24. Research Methodology

Don't pay for what you don't need

Customize your report by selecting specific countries or regions and save 30%!

List of Tables

Table 01: Global Market Historical Value (US$ Mn) Analysis by Nature, 2016-2020

Table 02: Global Market Historical Volume (MT) Analysis by Nature, 2016-2020

Table 03: Global Market forecast Value (US$ Mn) Analysis by Nature, 2021-2031

Table 04: Global -Market Forecast Volume (MT) Analysis by Nature, 2021-2031

Table 05: Global Market Historical Value (US$ Mn) Analysis by Grade, 2016-2020

Table 06: Global Market Historical Volume (MT) Analysis by Grade, 2016-2020

Table 07: Global Market forecast Value (US$ Mn) Analysis by Grade, 2021-2031

Table 08: Global -Market Forecast Volume (MT) Analysis by Grade, 2021-2031

Table 09: Global Market Historical Value (US$ Mn) Analysis by Application, 2016-2020

Table 10: Global Market Historical Volume (MT) Analysis by Application, 2016-2020

Table 11: Global Market forecast Value (US$ Mn) Analysis by Application, 2021-2031

Table 12: Global -Market Forecast Volume (MT) Analysis by Application, 2021-2031

Table 13: Global Market Historical Value (US$ Mn) Analysis by End-Use, 2016-2020

Table 14: Global Market Historical Volume (MT) Analysis by End-Use, 2016-2020

Table 15: Global Market forecast Value (US$ Mn) Analysis by End-Use, 2021-2031

Table 16: Global -Market Forecast Volume (MT) Analysis by End-Use, 2021-2031

Table 17: Global Market Historical Value (US$ Mn) Analysis by Region, 2016-2020

Table 18: Global Market Historical Volume (MT) Analysis by Region, 2016-2020

Table 19: Global Market forecast Value (US$ Mn) Analysis by Region, 2021-2031

Table 20: Global -Market Forecast Volume (MT) Analysis by Region, 2021-2031

Table 21: North America Market Historical Value (US$ Mn) Analysis by Nature, 2016-2020

Table 22: North America Market Historical Volume (MT) Analysis by Nature, 2016-2020

Table 23: North America Market forecast Value (US$ Mn) Analysis by Nature, 2021-2031

Table 24: North America -Market Forecast Volume (MT) Analysis by Nature, 2021-2031

Table 25: North America Market Historical Value (US$ Mn) Analysis by Grade, 2016-2020

Table 26: North America Market Historical Volume (MT) Analysis by Grade, 2016-2020

Table 27: North America Market forecast Value (US$ Mn) Analysis by Grade, 2021-2031

Table 28: North America -Market Forecast Volume (MT) Analysis by Grade, 2021-2031

Table 29: North America Market Historical Value (US$ Mn) Analysis by Application, 2016-2020

Table 30: North America Market Historical Volume (MT) Analysis by Application, 2016-2020

Table 31: North America Market forecast Value (US$ Mn) Analysis by Application, 2021-2031

Table 32: North America -Market Forecast Volume (MT) Analysis by Application, 2021-2031

Table 33: North America Market Historical Value (US$ Mn) Analysis by End-Use, 2016-2020

Table 34: North America Market Historical Volume (MT) Analysis by End-Use, 2016-2020

Table 35: North America Market forecast Value (US$ Mn) Analysis by End-Use, 2021-2031

Table 36: North America -Market Forecast Volume (MT) Analysis by End-Use, 2021-2031

Table 37: North America Market Historical Value (US$ Mn) Analysis by Region, 2016-2020

Table 38: North America Market Historical Volume (MT) Analysis by Region, 2016-2020

Table 39: North America Market forecast Value (US$ Mn) Analysis by Region, 2021-2031

Table 40: North America -Market Forecast Volume (MT) Analysis by Region, 2021-2031

Table 41: Latin America Market Historical Value (US$ Mn) Analysis by Nature, 2016-2020

Table 42: Latin America Market Historical Volume (MT) Analysis by Nature, 2016-2020

Table 43: Latin America Market forecast Value (US$ Mn) Analysis by Nature, 2021-2031

Table 44: Latin America -Market Forecast Volume (MT) Analysis by Nature, 2021-2031

Table 45: Latin America Market Historical Value (US$ Mn) Analysis by Grade, 2016-2020

Table 46: Latin America Market Historical Volume (MT) Analysis by Grade, 2016-2020

Table 47: Latin America Market forecast Value (US$ Mn) Analysis by Grade, 2021-2031

Table 48: Latin America -Market Forecast Volume (MT) Analysis by Grade, 2021-2031

Table 49: Latin America Market Historical Value (US$ Mn) Analysis by Application, 2016-2020

Table 50: Latin America Market Historical Volume (MT) Analysis by Application, 2016-2020

Table 51: Latin America Market forecast Value (US$ Mn) Analysis by Application, 2021-2031

Table 52: Latin America -Market Forecast Volume (MT) Analysis by Application, 2021-2031

Table 53: Latin America Market Historical Value (US$ Mn) Analysis by End-Use, 2016-2020

Table 54: Latin America Market Historical Volume (MT) Analysis by End-Use, 2016-2020

Table 55: Latin America Market forecast Value (US$ Mn) Analysis by End-Use, 2021-2031

Table 56: Latin America -Market Forecast Volume (MT) Analysis by End-Use, 2021-2031

Table 57: Latin America Market Historical Value (US$ Mn) Analysis by Region, 2016-2020

Table 58: Latin America Market Historical Volume (MT) Analysis by Region, 2016-2020

Table 59: Latin America Market forecast Value (US$ Mn) Analysis by Region, 2021-2031

Table 60: Latin America -Market Forecast Volume (MT) Analysis by Region, 2021-2031

Table 61: Europe Market Historical Value (US$ Mn) Analysis by Nature, 2016-2020

Table 62: Europe Market Historical Volume (MT) Analysis by Nature, 2016-2020

Table 63: Europe Market forecast Value (US$ Mn) Analysis by Nature, 2021-2031

Table 64: Europe -Market Forecast Volume (MT) Analysis by Nature, 2021-2031

Table 65: Europe Market Historical Value (US$ Mn) Analysis by Grade, 2016-2020

Table 66: Europe Market Historical Volume (MT) Analysis by Grade, 2016-2020

Table 67: Europe Market forecast Value (US$ Mn) Analysis by Grade, 2021-2031

Table 68: Europe -Market Forecast Volume (MT) Analysis by Grade, 2021-2031

Table 69: Europe Market Historical Value (US$ Mn) Analysis by Application, 2016-2020

Table 70: Europe Market Historical Volume (MT) Analysis by Application, 2016-2020

Table 71: Europe Market forecast Value (US$ Mn) Analysis by Application, 2021-2031

Table 72: Europe -Market Forecast Volume (MT) Analysis by Application, 2021-2031

Table 73: Europe Market Historical Value (US$ Mn) Analysis by End-Use, 2016-2020

Table 74: Europe Market Historical Volume (MT) Analysis by End-Use, 2016-2020

Table 75: Europe Market forecast Value (US$ Mn) Analysis by End-Use, 2021-2031

Table 76: Europe -Market Forecast Volume (MT) Analysis by End-Use, 2021-2031

Table 77: Europe Market Historical Value (US$ Mn) Analysis by Region, 2016-2020

Table 78: Europe Market Historical Volume (MT) Analysis by Region, 2016-2020

Table 79: Europe Market forecast Value (US$ Mn) Analysis by Region, 2021-2031

Table 80: Europe -Market Forecast Volume (MT) Analysis by Region, 2021-2031

Table 81: Japan Market Historical Value (US$ Mn) Analysis by Nature, 2016-2020

Table 82: Japan Market Historical Volume (MT) Analysis by Nature, 2016-2020

Table 83: Japan Market forecast Value (US$ Mn) Analysis by Nature, 2021-2031

Table 84: Japan -Market Forecast Volume (MT) Analysis by Nature, 2021-2031

Table 85: Japan Market Historical Value (US$ Mn) Analysis by Grade, 2016-2020

Table 86: Japan Market Historical Volume (MT) Analysis by Grade, 2016-2020

Table 87: Japan Market forecast Value (US$ Mn) Analysis by Grade, 2021-2031

Table 88: Japan –Market Forecast Volume (MT) Analysis by Grade, 2021-2031

Table 89: Japan Market Historical Value (US$ Mn) Analysis by Application, 2016-2020

Table 90: Japan Market Historical Volume (MT) Analysis by Application, 2016-2020

Table 91: Japan Market forecast Value (US$ Mn) Analysis by Application, 2021-2031

Table 92: Japan -Market Forecast Volume (MT) Analysis by Application, 2021-2031

Table 93: Japan Market Historical Value (US$ Mn) Analysis by End-Use, 2016-2020

Table 94: Japan Market Historical Volume (MT) Analysis by End-Use, 2016-2020

Table 95: Japan Market forecast Value (US$ Mn) Analysis by End-Use, 2021-2031

Table 96: Japan -Market Forecast Volume (MT) Analysis by End-Use, 2021-2031

Table 97: Japan Market Historical Value (US$ Mn) Analysis by Region, 2016-2020

Table 98: Japan Market Historical Volume (MT) Analysis by Region, 2016-2020

Table 99: Japan Market forecast Value (US$ Mn) Analysis by Region, 2021-2031

Table 100: Japan -Market Forecast Volume (MT) Analysis by Region, 2021-2031

Table 101: MEA Market Historical Value (US$ Mn) Analysis by Nature, 2016-2020

Table 102: MEA Market Historical Volume (MT) Analysis by Nature, 2016-2020

Table 103: MEA Market forecast Value (US$ Mn) Analysis by Nature, 2021-2031

Table 104: MEA -Market Forecast Volume (MT) Analysis by Nature, 2021-2031

Table 105: MEA Market Historical Value (US$ Mn) Analysis by Grade, 2016-2020

Table 106: MEA Market Historical Volume (MT) Analysis by Grade, 2016-2020

Table 107: MEA Market forecast Value (US$ Mn) Analysis by Grade, 2021-2031

Table 108: MEA –Market Forecast Volume (MT) Analysis by Grade, 2021-2031

Table 109: MEA Market Historical Value (US$ Mn) Analysis by Application, 2016-2020

Table 110: MEA Market Historical Volume (MT) Analysis by Application, 2016-2020

Table 111: MEA Market forecast Value (US$ Mn) Analysis by Application, 2021-2031

Table 112: MEA Market Forecast Volume (MT) Analysis by Application, 2021-2031

Table 113: MEA Market Historical Value (US$ Mn) Analysis by End-Use, 2016-2020

Table 114: MEA Market Historical Volume (MT) Analysis by End-Use, 2016-2020

Table 115: MEA Market forecast Value (US$ Mn) Analysis by End-Use, 2021-2031

Table 116: MEA -Market Forecast Volume (MT) Analysis by End-Use, 2021-2031

Table 117: MEA Market Historical Value (US$ Mn) Analysis by Region, 2016-2020

Table 118: MEA Market Historical Volume (MT) Analysis by Region, 2016-2020

Table 119: MEA Market forecast Value (US$ Mn) Analysis by Region, 2021-2031

Table 120: MEA -Market Forecast Volume (MT) Analysis by Region, 2021-2031
Nandini Roy Choudhury

Principal Consultant

Talk to Analyst

Find your sweet spots for generating winning opportunities in this market.

List of Charts

Figure 1: Global Market Value Y-o-Y Growth and Forecast, 2016-2031

Figure 2: Global Market Incremental $ Opportunity, 2021-2031

Figure 3: Global Market Incremental Volume (MT), 2021-2031

Figure 4: Global Market Value Y-o-Y Growth and Forecast, by Region, 2016-2031

Figure 5: Global Market Incremental $ Opportunity, by Region, 2021-2031

Figure 6: Global Market Attractiveness Index, by Region, 2021-2031

Figure 7: Global Market Value Y-o-Y Growth and Forecast, by Nature, 2016-2031

Figure 8: Global Market Incremental $ Opportunity, by Nature, 2021-2031

Figure 7: Global Market Value Y-o-Y Growth and Forecast, by Nature, 2016-2031

Figure 8: Global Market Incremental $ Opportunity, by Grade, 2021-2031

Figure 9: Global Market Attractiveness Index, by Grade, 2021-2031

Figure 10: Global Market Value Y-o-Y Growth and Forecast, by Application, 2016-2031

Figure 11: Global Market Incremental $ Opportunity, by Application, 2021-2031

Figure 12: Global Market Value Y-o-Y Growth and Forecast, by Application, 2016-2031

Figure 13: Global Market Value Y-o-Y Growth and Forecast, by End-Use, 2016-2031

Figure 14: Global Market Incremental $ Opportunity, by End-Use, 2021-2031

Figure 15: Global Market Value Y-o-Y Growth and Forecast, by End-Use, 2016-2031

Figure 16: North America Market Value Y-o-Y Growth and Forecast, by Country, 2016-2031

Figure 17: North America Market Incremental $ Opportunity, by Country, 2021-2031

Figure 18: North America Market Attractiveness Index, by Country, 2021-2031

Figure 19: North America Market Value Y-o-Y Growth and Forecast, by Nature, 2016-2031

Figure 20: North America Market Incremental $ Opportunity, by Nature, 2021-2031

Figure 21: North America Market Value Y-o-Y Growth and Forecast, by Nature, 2016-2031

Figure 22: North America Market Incremental $ Opportunity, by Grade, 2021-2031

Figure 23: North America Market Attractiveness Index, by Grade, 2021-2031

Figure 24: North America Market Value Y-o-Y Growth and Forecast, by Application, 2016-2031

Figure 25: North America Market Incremental $ Opportunity, by Application, 2021-2031

Figure 26: North America Market Value Y-o-Y Growth and Forecast, by Application, 2016-2031

Figure 27: North America Market Value Y-o-Y Growth and Forecast, by End-Use, 2016-2031

Figure 28: North America Market Incremental $ Opportunity, by End-Use, 2021-2031

Figure 29: North America Market Value Y-o-Y Growth and Forecast, by End-Use, 2016-2031

Figure 30: Latin America Market Value Y-o-Y Growth and Forecast, by Country, 2016-2031

Figure 31: Latin America Market Incremental $ Opportunity, by Country, 2021-2031

Figure 32: Latin America Market Attractiveness Index, by Country, 2021-2031

Figure 33: Latin America Market Value Y-o-Y Growth and Forecast, by Nature, 2016-2031

Figure 34: Latin America Market Incremental $ Opportunity, by Nature, 2021-2031

Figure 35: Latin America Market Value Y-o-Y Growth and Forecast, by Nature, 2016-2031

Figure 36: Latin America Market Incremental $ Opportunity, by Grade, 2021-2031

Figure 37: Latin America Market Attractiveness Index, by Grade, 2021-2031

Figure 38: Latin America Market Value Y-o-Y Growth and Forecast, by Application, 2016-2031

Figure 39: Latin America Market Incremental $ Opportunity, by Application, 2021-2031

Figure 40:Latin America Market Value Y-o-Y Growth and Forecast, by Application, 2016-2031

Figure 41: Latin America Market Value Y-o-Y Growth and Forecast, by End-Use, 2016-2031

Figure 42: Latin America Market Incremental $ Opportunity, by End-Use, 2021-2031

Figure 43: Latin America Market Value Y-o-Y Growth and Forecast, by End-Use, 2016-2031

Figure 44: Europe Market Value Y-o-Y Growth and Forecast, by Country, 2016-2031

Figure 45: Europe Market Incremental $ Opportunity, by Country, 2021-2031

Figure 46: Europe Market Attractiveness Index, by Country, 2021-2031

Figure 47: Europe Market Value Y-o-Y Growth and Forecast, by Nature, 2016-2031

Figure 48: Europe Market Incremental $ Opportunity, by Nature, 2021-2031

Figure 49: Europe Market Value Y-o-Y Growth and Forecast, by Nature, 2016-2031

Figure 50: Europe Market Incremental $ Opportunity, by Grade, 2021-2031

Figure 51: Europe Market Attractiveness Index, by Grade, 2021-2031

Figure 52: Europe Market Value Y-o-Y Growth and Forecast, by Application, 2016-2031

Figure 53: Europe Market Incremental $ Opportunity, by Application, 2021-2031

Figure 54: Europe Market Value Y-o-Y Growth and Forecast, by Application, 2016-2031

Figure 55: Europe Market Value Y-o-Y Growth and Forecast, by End-Use, 2016-2031

Figure 56: Europe Market Incremental $ Opportunity, by End-Use, 2021-2031

Figure 57: Europe Market Value Y-o-Y Growth and Forecast, by End-Use, 2016-2031

Figure 58: Japan Market Value Y-o-Y Growth and Forecast, by Country, 2016-2031

Figure 59: Japan Market Incremental $ Opportunity, by Country, 2021-2031

Figure 60: Japan Market Attractiveness Index, by Country, 2021-2031

Figure 61: Japan Market Value Y-o-Y Growth and Forecast, by Nature, 2016-2031

Figure 62: Japan Market Incremental $ Opportunity, by Nature, 2021-2031

Figure 63: Japan Market Value Y-o-Y Growth and Forecast, by Nature, 2016-2031

Figure 64: Japan Market Incremental $ Opportunity, by Grade, 2021-2031

Figure 65: Japan Market Attractiveness Index, by Grade, 2021-2031

Figure 66: Japan Market Value Y-o-Y Growth and Forecast, by Application, 2016-2031

Figure 67: Japan Market Incremental $ Opportunity, by Application, 2021-2031

Figure 68: Japan Market Value Y-o-Y Growth and Forecast, by Application, 2016-2031

Figure 69: Japan Market Value Y-o-Y Growth and Forecast, by End-Use, 2016-2031

Figure 70: Japan Market Incremental $ Opportunity, by End-Use, 2021-2031

Figure 71: Japan Market Value Y-o-Y Growth and Forecast, by End-Use, 2016-2031

Figure 72: APEJ Market Value Y-o-Y Growth and Forecast, by Country, 2016-2031

Figure 73: APEJ Market Incremental $ Opportunity, by Country, 2021-2031

Figure 74: APEJ Market Attractiveness Index, by Country, 2021-2031

Figure 75: APEJ Market Value Y-o-Y Growth and Forecast, by Nature, 2016-2031

Figure 76: APEJ Market Incremental $ Opportunity, by Nature, 2021-2031

Figure 77: APEJ Market Value Y-o-Y Growth and Forecast, by Nature, 2016-2031

Figure 78: APEJ Market Incremental $ Opportunity, by Grade, 2021-2031

Figure 79: APEJ Market Attractiveness Index, by Grade, 2021-2031

Figure 80: APEJ Market Value Y-o-Y Growth and Forecast, by Application, 2016-2031

Figure 81: APEJ Market Incremental $ Opportunity, by Application, 2021-2031

Figure 82: APEJ Market Value Y-o-Y Growth and Forecast, by Application, 2016-2031

Figure 83: APEJ Market Value Y-o-Y Growth and Forecast, by End-Use, 2016-2031

Figure 84: APEJ Market Incremental $ Opportunity, by End-Use, 2021-2031

Figure 85: APEJ Market Value Y-o-Y Growth and Forecast, by End-Use, 2016-2031

Figure 86: MEA Market Value Y-o-Y Growth and Forecast, by Country, 2016-2031

Figure 87: MEA Market Incremental $ Opportunity, by Country, 2021-2031

Figure 88: MEA Market Attractiveness Index, by Country, 2021-2031

Figure 89: MEA Market Value Y-o-Y Growth and Forecast, by Nature, 2016-2031

Figure 90: MEA Market Incremental $ Opportunity, by Nature, 2021-2031

Figure 91: MEA Market Value Y-o-Y Growth and Forecast, by Nature, 2016-2031

Figure 92: MEA Market Incremental $ Opportunity, by Grade, 2021-2031

Figure 93: MEA Market Attractiveness Index, by Grade, 2021-2031

Figure 94: MEA Market Value Y-o-Y Growth and Forecast, by Application, 2016-2031

Figure 95: MEA Market Incremental $ Opportunity, by Application, 2021-2031

Figure 96: MEA Market Value Y-o-Y Growth and Forecast, by Application, 2016-2031

Figure 97: MEA Market Value Y-o-Y Growth and Forecast, by End-Use, 2016-2031

Figure 98: MEA Market Incremental $ Opportunity, by End-Use, 2021-2031

Figure 99: MEA Market Value Y-o-Y Growth and Forecast, by End-Use, 2016-2031

Recommendations

Food and Beverage

Gluten-free Product Market

Published : March 2024

Food and Beverage

Allergen Free Food Market

Published : February 2024

Food and Beverage

Clean Label Ingredients Market

Published : September 2023

Food and Beverage

Texturized Vegetable Protein Market

Published : February 2021

Explore Food and Beverage Insights

View Reports