Plug-in Pump Alarm Market Size, Share, and Forecast Outlook 2025 to 2035

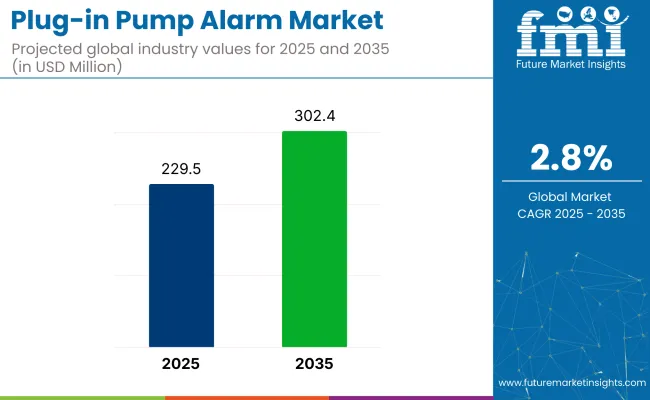
The plug-in pump alarm market is forecast to expand from USD 229.5 million in 2025 to USD 302.4 million by 2035, registering a CAGR of 2.8% over the assessment period. The steady growth is being supported by rising demand in residential, commercial, and light industrial settings, where real-time water level monitoring and early leak detection are becoming increasingly critical.
Quick Stats in Plug-in Pump Alarm Market

  • Market Value (2025): USD 229.5 million
  • Forecast Value (2035): USD 302.4 million
  • Forecast CAGR: 2.8%
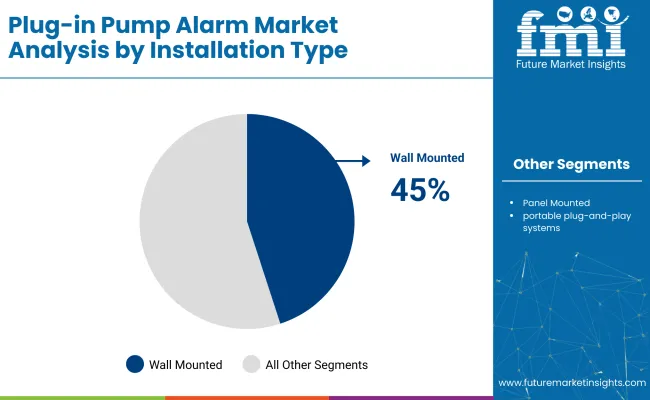
  • Top Installation Type: Wall Mounted (45% market share in 2025)
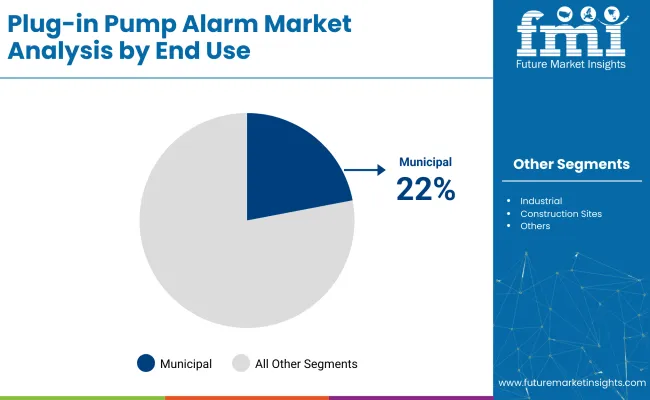
  • Leading End Use: Municipal (22% market share in 2025)
  • Key Growth Country: India (3.9% CAGR)

Plug In Pump Alarm Market

Metric Value
Market Size 2025 USD 229.5 million
Market Size 2035 USD 302.4 million
CAGR (2025 to 2035) 2.8%

As of 2025, the plug-in pump alarm market holds a niche yet functionally important share across several broader parent markets. Within the global water pump market, it contributes around 2-3%, serving as an essential accessory for pump failure detection and protection. In the smart home devices market, its share is smaller, at about 0.5-1%, as it represents a specialized utility within the broader home automation ecosystem.

Within the industrial monitoring equipment market, the contribution stands at 1-2%, particularly in facilities using sump or utility pumps. In the home safety and security market, it makes up around 1-1.5%, helping to prevent water damage. In the building automation systems market, plug-in pump alarms contribute roughly 1-2%, supporting integrated water management systems.

The market operates within a tightly integrated supply chain, beginning with raw material suppliers providing sensors, enclosures, circuit boards, and wiring components. OEMs then manufacture and assemble plug-in alarm systems tailored for sump pumps, sewage ejectors, and utility pumps. These alarms are integrated with float switches and audio-visual alert systems to signal pump failure or water level rise.

Distributors and wholesalers play a key role in supplying the finished products to hardware stores, online platforms, and plumbing suppliers. Contractors, plumbers, and DIY homeowners form the end-user base, often relying on plug-and-play models for ease of installation.

Growing concerns over basement flooding, smart home integration, and real-time monitoring drive demand. The supply chain is increasingly influenced by IoT adoption, quality certifications, and regulatory standards for residential water management.

Analyzing Plug-in Pump Alarm Market by Top Investment Segments

Wall-mounted plug-in pump alarms are expected to dominate the installation type segment with a 45% share by 2025, while float switch mechanisms are projected to lead the sensing mechanism segment at 40%.

Wall-Mounted Installations to Lead Installation Type Segment with 45% Market Share

Wall-mounted plug-in pump alarms are projected to lead the installation type segment, capturing 45% of the global market share by 2025. Their fixed positioning ensures reliable performance in water control systems.
  • Wall-mounted configurations have been widely adopted in residential, commercial, and industrial settings where stable installation and continuous visibility are required.
  • The increasing implementation of basement sump systems, sewage management systems, and industrial water tanks has reinforced demand. Users prefer these models for their ease of installation, safety compliance, and consistent monitoring capabilities in wet environments.

Plug In Pump Alarm Market Analysis By Installation Type

Float Switch to Lead Sensing Mechanism Segment with 40% Market Share

Float switch sensing mechanisms are expected to dominate the sensing mechanism segment with a 40% share in 2025. These mechanisms have been favored for their simplicity, reliability, and cost-effectiveness.

  • Designed to detect liquid levels, float switches activate alarms when abnormal conditions arise, reducing the risk of overflow or system failure.
  • Demand has risen across septic systems and water reservoirs where float switches are preferred due to their low maintenance and effective operation. Their compatibility with a wide range of liquids and resistance to harsh conditions enhances their appeal across both residential and commercial markets.

Municipal Segment to Lead End-Use Segment with 22% Market Share

The municipal sector is expected to dominate the end-use segment with a 22% share by 2025. Plug-in pump alarms have been integrated into public water systems to prevent failures and improve overall infrastructure reliability.
  • Municipal authorities have increasingly adopted alarm systems for storm water, sewage, and drinking water networks to ensure consistent system performance.
  • Upgrades in urban infrastructure and government initiatives promoting smart monitoring systems have strengthened market demand. Plug-in models with remote alarm capabilities are being used for round-the-clock supervision, supporting operational efficiency and water safety in public utilities.

Plug In Pump Alarm Market Analysis By End Use

Top Plug-in Pump Alarm Market Dynamics

The market is growing steadily as water damage prevention becomes a priority across residential, commercial, and industrial settings. These alarms are used to detect sump pump failures, rising water levels, and backup situations. With increasing awareness of flood risks and plumbing failures, demand is rising for easy-to-install, reliable, and battery-backed alarm systems.

Growing Use in Commercial and Light Industrial Water Management

In commercial buildings, restaurants, data centers, and light manufacturing facilities, plug-in pump alarms are used to prevent water damage around utility pumps and wastewater systems. Facilities management teams rely on these devices to ensure uninterrupted pump operation and timely maintenance. Alarms with visual indicators, remote alerts, and backup power are in high demand.

  • Used to monitor sump and utility pumps in commercial settings.
  • Alarms with visual signals and remote notifications support facility safety.
  • Backup battery features ensure continued operation during power outages.

Product Innovation Focused on Connectivity and Long-Term Reliability

Manufacturers are integrating advanced features such as app-based notifications, moisture sensors, and extended battery life into modern plug-in pump alarms. There is also growing interest in models with self-testing capabilities and corrosion-resistant housing to support long-term reliability in damp environments. Compact designs and multi-zone monitoring options are gaining popularity.
  • New models offer app alerts, self-testing, and multiple sensor support.
  • Corrosion-resistant enclosures enhance performance in wet environments.
  • Compact and multi-zone alarms cater to broader monitoring needs.

Top Countries Manufacturing, Integrating, Distributing, and Driving Demand for Plug-in Pump Alarm Systems

Country Wise Analysis Of Plug In Pump Alarm Market

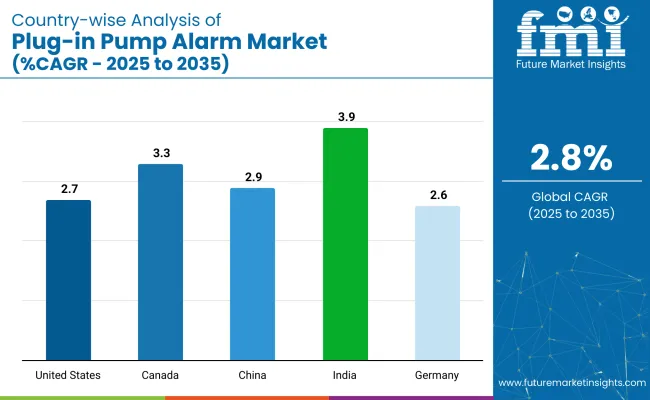
Countries CAGR (2025 to 2035)
India 3.9%
Canada 3.3%
China 2.9%
United States 2.7%
Germany 2.6%

India’s momentum is being driven by monsoon-related flooding, widespread urban construction, and public sector investments in drainage systems. Canada is advancing the use of plug-in alarms in flood-prone basements and is promoting integration through home insurance incentives and provincial mandates. In contrast, mature economies such as China (2.9%), the United States (2.7%), and Germany (2.6%) are expanding steadily at 0.92-1.03x rates.

China focuses on integrating alarms into bundled water monitoring kits within large-scale housing projects. The USA emphasizes smart-home applications and retrofitting solutions for flood-prone regions. Germany supports growth through compliance-based upgrades in municipal infrastructure and energy-efficient building basements. As the market grows steadily through 2035, both volume-driven and regulation-led countries are shaping its evolution.

The report provides insights across 40+ countries. The five below are highlighted for their strategic influence and growth trajectory.

In-depth Analysis of Plug-in Pump Alarm Market in India

Indian market is projected to grow at a CAGR of 3.9% through 2035. Rising urban flooding, weak drainage systems, and the construction of underground facilities are contributing to demand. Plug-in alarms are being installed in apartment complexes, metro stations, and public sector utility chambers. Affordable, dual-sensor models are being produced locally to support wide deployment. Smart city programs in states such as Maharashtra and Tamil Nadu are including sump monitoring units in their planning.

  • Plug-in alarms adopted in metro tunnels and basement reservoirs
  • Smart city tenders including alarms in infrastructure packages
  • Local manufacturers offering cost-efficient sensor variants

Sales Analysis of Plug-in Pump Alarm Market in Canada

Canada is expected to grow at a CAGR of 3.3% through 2035. Basement water intrusion caused by snowmelt and groundwater has made alarm installation common in residential properties. Several provinces are promoting alarm use through building code updates and home insurance rebate programs.

Off-grid communities in Alberta and British Columbia are adopting alarms with battery backup for reliability during blackouts. Demand is concentrated in single-family suburban housing, with growing adoption in multi-unit residential basements.

  • Sump alarms promoted through provincial insurance incentives
  • Battery-supported units used in remote and off-grid housing
  • Building codes mandating alarms in new residential construction

Demand Outlook for Plug-in Pump Alarm Market in China

China’s market is projected to expand at a CAGR of 2.9% from 2025 to 2035. Growth is supported by rapid urbanization, residential tower construction, and increased drainage load in industrial zones. Tier 1 and Tier 2 cities are embedding alarms in basement utility shafts and wastewater pump rooms. Local OEMs are bundling alarms with smart building control kits to meet evolving regulations. Plug-in alarms are also being deployed in temporary construction housing and mobile infrastructure.

  • Alarm kits bundled with urban housing safety packages
  • Industrial parks adopting plug-in sensors for overflow control
  • Tiered government policies supporting retrofit installation

Growth Forecast for Plug-in Pump Alarm Market in the United States

The USA market is forecast to grow at a CAGR of 2.7% through 2035. Retrofits in older homes, smart home integration, and increased flood risks are sustaining demand. Homeowners in flood-prone regions such as the Midwest and Northeast are using sump alarms to prevent basement damage. Product sales are dominated by models with app-based alerts, battery backup, and Wi-Fi compatibility. Builders are incorporating alarms into new construction packages in FEMA-designated flood zones.

  • Alarms with smart alerts used in flood-prone regions
  • App-based sump alarm models dominating new installations
  • FEMA guidelines prompting use in vulnerable housing markets

Opportunity Analysis of Plug-in Pump Alarm Market in Germany

Germany is expected to grow at a CAGR of 2.6% during the forecast period. Energy-efficient commercial buildings and public garages are integrating plug-in alarms into automated drainage systems. The market is influenced by environmental compliance rules under the EU Floods Directive. German OEMs are developing silent, low-energy alarm models compatible with centralized building management systems. Retrofit installations are also occurring in schools, hospitals, and logistics facilities.

  • Alarm integration driven by EU climate resilience policies
  • OEMs offering silent alarms with long operating life
  • Public infrastructure upgrades using modular alarm kits

Leading Plug-in Pump Alarm Manufacturers

The market is moderately fragmented, with key players such as Sulzer, Xylem, and Grundfos driving innovation through smart sensor integration and user-friendly interfaces. Sulzer offers high-reliability alarm systems tailored for critical wastewater and dewatering applications. Xylem emphasizes intelligent monitoring and remote alert technologies through its brands like Flygt and Goulds Water Technology.

Grundfos supports plug-and-play alarms with advanced diagnostics to prevent basement flooding and pump failures in residential and commercial settings. Other manufacturers include Zoeller Pump Company and Liberty Pumps, known for rugged, easy-install alarms suitable for sump and sewage pump applications. Tsurumi Pump continues to strengthen its presence in the industrial segment with weatherproof, high-decibel alert solutions.

Recent Plug-in Pump Alarm Industry News

In January 2025, Dura Pump technical director John Calder stated that remote monitoring and smart, sensor-enabled pumps will become widespread in the pump sector this year. He emphasized the importance of early fault detection, including reduced flow, blockages, and temperature fluctuations, to minimize downtime and maintenance costs.

Leading Players in Plug-in Pump Alarm Market

  • Sulzer
  • Xylem
  • Grundfos
  • Zoeller Pump Company
  • Tsurumi Pump
  • Liberty Pumps

Report Coverage and Scope Summary

Report Attributes Details
Market Size (2025) USD 229.5 million
Projected Market Size (2035) USD 302.4 million
CAGR (2025 to 2035) 2.8%
Base Year for Estimation 2024
Historical Period 2020 to 2024
Projections Period 2025 to 2035
Quantitative Units USD million for market value
Installation Types Analyzed (Segment 1) Wall Mounted, Panel Mounted, Portable Plug-and-Play Systems
End Uses Analyzed (Segment 2) Residential, Municipal, Industrial, Construction Sites, Agriculture & Irrigation
Sensing Mechanisms Analyzed (Segment 3) Float Switch, Probes, Sensors, Other Detection Technologies
Regions Covered North America, Latin America, Eastern Europe, Western Europe, South Asia & Pacific, East Asia, Middle East & Africa
Countries Covered United States, Canada, Germany, United Kingdom, France, Japan, China, India, South Korea, Brazil
Key Players Sulzer, Xylem, Grundfos, Zoeller Pump Company, Tsurumi Pump, Liberty Pumps
Additional Attributes Dollar sales by installation and sensing type, steady demand in water control systems, growing use in flood-prone areas, and product innovation in plug-and-play alarm technologies.

Key Segments

By Installation Type:

The market is segmented by installation type into wall-mounted, panel-mounted, and portable plug-and-play systems.

By End Use:

Based on end use, the market serves residential, municipal, industrial, construction sites, and agriculture & irrigation applications.

By Sensing Mechanism:

By sensing mechanism, the market includes float switches, probes, sensors, and other detection technologies.

By Region:

Regionally, the market is distributed across North America, Latin America, Eastern Europe, Western Europe, South Asia & Pacific, East Asia, and the Middle East & Africa.

Table of Content

  1. Executive Summary
    • Global Market Outlook
    • Demand-side Trends
    • Supply-side Trends
    • Technology Roadmap Analysis
    • Analysis and Recommendations
  2. Market Overview
    • Market Coverage/Taxonomy
    • Market Definition/Scope/Limitations
  3. Market Background
    • Market Dynamics
      • Drivers
      • Restraints
      • Opportunity
      • Trends
    • Scenario Forecast
      • Demand in Optimistic Scenario
      • Demand in Likely Scenario
      • Demand in Conservative Scenario
    • Opportunity Map Analysis
    • Product Life Cycle Analysis
    • Supply Chain Analysis
      • Supply Side Participants and their Roles
        • Producers
        • Mid-Level Participants (Traders/ Agents/ Brokers)
        • Wholesalers and Distributors
      • Value Added and Value Created at Node in the Supply Chain
      • List of Raw Material Suppliers
      • List of Existing and Potential Buyer’s
    • Investment Feasibility Matrix
    • Value Chain Analysis
      • Profit Margin Analysis
      • Wholesalers and Distributors
      • Retailers
    • PESTLE and Porter’s Analysis
    • Regulatory Landscape
      • By Key Regions
      • By Key Countries
    • Regional Parent Market Outlook
    • Production and Consumption Statistics
    • Import and Export Statistics
  4. Global Market Analysis 2020 to 2024 and Forecast, 2025 to 2035
    • Historical Market Size Value (USD Million) & Volume (Units) Analysis, 2020 to 2024
    • Current and Future Market Size Value (USD Million) & Volume (Units) Projections, 2025 to 2035
      • Y-o-Y Growth Trend Analysis
      • Absolute $ Opportunity Analysis
  5. Global Market Pricing Analysis 2020 to 2024 and Forecast 2025 to 2035
  6. Global Market Analysis 2020 to 2024 and Forecast 2025 to 2035, By Installation Type
    • Introduction/Key Findings
    • Historical Market Size Value (USD Million) & Volume (Units) Analysis By Installation Type, 2020 to 2024
    • Current and Future Market Size Value (USD Million) & Volume (Units) Analysis and Forecast By Installation Type, 2025 to 2035
      • Wall Mounted
      • Panel Mounted
      • Portable Plug and Play
    • Y-o-Y Growth Trend Analysis By Installation Type, 2020 to 2024
    • Absolute $ Opportunity Analysis By Installation Type, 2025 to 2035
  7. Global Market Analysis 2020 to 2024 and Forecast 2025 to 2035, By End Use
    • Introduction/Key Findings
    • Historical Market Size Value (USD Million) & Volume (Units) Analysis By End Use, 2020 to 2024
    • Current and Future Market Size Value (USD Million) & Volume (Units) Analysis and Forecast By End Use, 2025 to 2035
      • Residential
      • Municipal
      • Industrial
      • Construction Sites
      • Agriculture & Irrigation
    • Y-o-Y Growth Trend Analysis By End Use, 2020 to 2024
    • Absolute $ Opportunity Analysis By End Use, 2025 to 2035
  8. Global Market Analysis 2020 to 2024 and Forecast 2025 to 2035, By Sensing Mechanism
    • Introduction/Key Findings
    • Historical Market Size Value (USD Million) & Volume (Units) Analysis By Sensing Mechanism, 2020 to 2024
    • Current and Future Market Size Value (USD Million) & Volume (Units) Analysis and Forecast By Sensing Mechanism, 2025 to 2035
      • Float Switch
      • Probes
      • Sensors
      • Others
    • Y-o-Y Growth Trend Analysis By Sensing Mechanism, 2020 to 2024
    • Absolute $ Opportunity Analysis By Sensing Mechanism, 2025 to 2035
  9. Global Market Analysis 2020 to 2024 and Forecast 2025 to 2035, By Region
    • Introduction
    • Historical Market Size Value (USD Million) & Volume (Units) Analysis By Region, 2020 to 2024
    • Current Market Size Value (USD Million) & Volume (Units) Analysis and Forecast By Region, 2025 to 2035
      • North America
      • Latin America
      • Western Europe
      • Eastern Europe
      • East Asia
      • South Asia & Pacific
      • Middle East and Africa
    • Market Attractiveness Analysis By Region
  10. North America Market Analysis 2020 to 2024 and Forecast 2025 to 2035, By Country
    • Historical Market Size Value (USD Million) & Volume (Units) Trend Analysis By Market Taxonomy, 2020 to 2024
    • Market Size Value (USD Million) & Volume (Units) Forecast By Market Taxonomy, 2025 to 2035
      • By Country
        • USA
        • Canada
        • Mexico
      • By Installation Type
      • By End Use
      • By Sensing Mechanism
    • Market Attractiveness Analysis
      • By Country
      • By Installation Type
      • By End Use
      • By Sensing Mechanism
    • Key Takeaways
  11. Latin America Market Analysis 2020 to 2024 and Forecast 2025 to 2035, By Country
    • Historical Market Size Value (USD Million) & Volume (Units) Trend Analysis By Market Taxonomy, 2020 to 2024
    • Market Size Value (USD Million) & Volume (Units) Forecast By Market Taxonomy, 2025 to 2035
      • By Country
        • Brazil
        • Argentina
        • Rest of LATAM
      • By Installation Type
      • By End Use
      • By Sensing Mechanism
    • Market Attractiveness Analysis
      • By Country
      • By Installation Type
      • By End Use
      • By Sensing Mechanism
    • Key Takeaways
  12. Western Europe Market Analysis 2020 to 2024 and Forecast 2025 to 2035, By Country
    • Historical Market Size Value (USD Million) & Volume (Units) Trend Analysis By Market Taxonomy, 2020 to 2024
    • Market Size Value (USD Million) & Volume (Units) Forecast By Market Taxonomy, 2025 to 2035
      • By Country
        • Germany
        • Italy
        • France
        • UK
        • Spain
        • BENELUX
        • Nordic
        • Rest of W.Europe
      • By Installation Type
      • By End Use
      • By Sensing Mechanism
    • Market Attractiveness Analysis
      • By Country
      • By Installation Type
      • By End Use
      • By Sensing Mechanism
    • Key Takeaways
  13. Eastern Europe Market Analysis 2020 to 2024 and Forecast 2025 to 2035, By Country
    • Historical Market Size Value (USD Million) & Volume (Units) Trend Analysis By Market Taxonomy, 2020 to 2024
    • Market Size Value (USD Million) & Volume (Units) Forecast By Market Taxonomy, 2025 to 2035
      • By Country
        • Russia
        • Hungary
        • Poland
        • Balkan & Baltics
        • Rest of E. Europe
      • By Installation Type
      • By End Use
      • By Sensing Mechanism
    • Market Attractiveness Analysis
      • By Country
      • By Installation Type
      • By End Use
      • By Sensing Mechanism
    • Key Takeaways
  14. East Asia Market Analysis 2020 to 2024 and Forecast 2025 to 2035, By Country
    • Historical Market Size Value (USD Million) & Volume (Units) Trend Analysis By Market Taxonomy, 2020 to 2024
    • Market Size Value (USD Million) & Volume (Units) Forecast By Market Taxonomy, 2025 to 2035
      • By Country
        • China
        • Japan
        • South Korea
      • By Installation Type
      • By End Use
      • By Sensing Mechanism
    • Market Attractiveness Analysis
      • By Country
      • By Installation Type
      • By End Use
      • By Sensing Mechanism
    • Key Takeaways
  15. South Asia & Pacific Market Analysis 2020 to 2024 and Forecast 2025 to 2035, By Country
    • Historical Market Size Value (USD Million) & Volume (Units) Trend Analysis By Market Taxonomy, 2020 to 2024
    • Market Size Value (USD Million) & Volume (Units) Forecast By Market Taxonomy, 2025 to 2035
      • By Country
        • India
        • Australia & New Zealand
        • ASEAN
        • Rest of SAP
      • By Installation Type
      • By End Use
      • By Sensing Mechanism
    • Market Attractiveness Analysis
      • By Country
      • By Installation Type
      • By End Use
      • By Sensing Mechanism
    • Key Takeaways
  16. Middle East and Africa Market Analysis 2020 to 2024 and Forecast 2025 to 2035, By Country
    • Historical Market Size Value (USD Million) & Volume (Units) Trend Analysis By Market Taxonomy, 2020 to 2024
    • Market Size Value (USD Million) & Volume (Units) Forecast By Market Taxonomy, 2025 to 2035
      • By Country
        • GCC Countries
        • Northern Africa
        • South Africa
        • Turkiye
        • Rest of MEA
      • By Installation Type
      • By End Use
      • By Sensing Mechanism
    • Market Attractiveness Analysis
      • By Country
      • By Installation Type
      • By End Use
      • By Sensing Mechanism
    • Key Takeaways
  17. Key Countries Market Analysis
    • USA
      • Pricing Analysis
      • Market Share Analysis, 2024
        • By Installation Type
        • By End Use
        • By Sensing Mechanism
    • Canada
      • Pricing Analysis
      • Market Share Analysis, 2024
        • By Installation Type
        • By End Use
        • By Sensing Mechanism
    • Brazil
      • Pricing Analysis
      • Market Share Analysis, 2024
        • By Installation Type
        • By End Use
        • By Sensing Mechanism
    • Mexico
      • Pricing Analysis
      • Market Share Analysis, 2024
        • By Installation Type
        • By End Use
        • By Sensing Mechanism
    • Argentina
      • Pricing Analysis
      • Market Share Analysis, 2024
        • By Installation Type
        • By End Use
        • By Sensing Mechanism
  18. Market Structure Analysis
    • Competition Dashboard
    • Competition Benchmarking
    • Market Share Analysis of Top Players
      • By Regional
      • By Installation Type
      • By End Use
      • By Sensing Mechanism
  19. Competition Analysis
    • Competition Deep Dive
      • Sulzer
        • Overview
        • Product Portfolio
        • Profitability by Market Segments (Product/Age /Sales Channel/Region)
        • Sales Footprint
        • Strategy Overview
          • Marketing Strategy
          • Product Strategy
          • Channel Strategy
      • Xylem
        • Overview
        • Product Portfolio
        • Profitability by Market Segments (Product/Age /Sales Channel/Region)
        • Sales Footprint
        • Strategy Overview
          • Marketing Strategy
          • Product Strategy
          • Channel Strategy
      • Grundfos
        • Overview
        • Product Portfolio
        • Profitability by Market Segments (Product/Age /Sales Channel/Region)
        • Sales Footprint
        • Strategy Overview
          • Marketing Strategy
          • Product Strategy
          • Channel Strategy
      • Zoeller Pump Company
        • Overview
        • Product Portfolio
        • Profitability by Market Segments (Product/Age /Sales Channel/Region)
        • Sales Footprint
        • Strategy Overview
          • Marketing Strategy
          • Product Strategy
          • Channel Strategy
      • Tsurumi Pump
        • Overview
        • Product Portfolio
        • Profitability by Market Segments (Product/Age /Sales Channel/Region)
        • Sales Footprint
        • Strategy Overview
          • Marketing Strategy
          • Product Strategy
          • Channel Strategy
      • Liberty Pumps
        • Overview
        • Product Portfolio
        • Profitability by Market Segments (Product/Age /Sales Channel/Region)
        • Sales Footprint
        • Strategy Overview
          • Marketing Strategy
          • Product Strategy
          • Channel Strategy
  20. Assumptions & Acronyms Used
  21. Research Methodology

List of Tables

  • Table 1: Global Market Value (USD Million) Forecast by Region, 2020-2035
  • Table 2: Global Market Volume (Units) Forecast by Region, 2020-2035
  • Table 3: Global Market Value (USD Million) Forecast By Installation Type, 2020-2035
  • Table 4: Global Market Volume (Units) Forecast by Installation Type, 2020-2035
  • Table 5: Global Market Value (USD Million) Forecast By End Use, 2020-2035
  • Table 6: Global Market Volume (Units) Forecast By End Use, 2020-2035
  • Table 7: Global Market Value (USD Million) Forecast By Sensing Mechanism, 2020-2035
  • Table 8: Global Market Volume (Units) Forecast By Sensing Mechanism, 2020-2035
  • Table 9: North America Market Value (USD Million) Forecast by Country, 2020-2035
  • Table 10: North America Market Volume (Units) Forecast by Country, 2020-2035
  • Table 11: North America Market Value (USD Million) Forecast By Installation Type, 2020-2035
  • Table 12: North America Market Volume (Units) Forecast By Installation Type, 2020-2035
  • Table 13: North America Market Value (USD Million) Forecast By End Use, 2020-2035
  • Table 14: North America Market Volume (Units) Forecast By End Use, 2020-2035
  • Table 15: North America Market Value (USD Million) Forecast By Sensing Mechanism, 2020-2035
  • Table 16: North America Market Volume (Units) Forecast By Sensing Mechanism, 2020-2035
  • Table 17: Latin America Market Value (USD Million) Forecast by Country, 2020-2035
  • Table 18: Latin America Market Volume (Units) Forecast by Country, 2020-2035
  • Table 19: Latin America Market Value (USD Million) Forecast By Installation Type, 2020-2035
  • Table 20: Latin America Market Volume (Units) Forecast By Installation Type, 2020-2035
  • Table 21: Latin America Market Value (USD Million) Forecast By End Use, 2020-2035
  • Table 22: Latin America Market Volume (Units) Forecast By End Use, 2020-2035
  • Table 23: Latin America Market Value (USD Million) Forecast By Sensing Mechanism, 2020-2035
  • Table 24: Latin America Market Volume (Units) Forecast By Sensing Mechanism, 2020-2035
  • Table 25: Western Europe Market Value (USD Million) Forecast by Country, 2020-2035
  • Table 26: Western Europe Market Volume (Units) Forecast by Country, 2020-2035
  • Table 27: Western Europe Market Value (USD Million) Forecast By Installation Type, 2020-2035
  • Table 28: Western Europe Market Volume (Units) Forecast By Installation Type, 2020-2035
  • Table 29: Western Europe Market Value (USD Million) Forecast By End Use, 2020-2035
  • Table 30: Western Europe Market Volume (Units) Forecast By End Use, 2020-2035
  • Table 31: Western Europe Market Value (USD Million) Forecast By Sensing Mechanism, 2020-2035
  • Table 32: Western Europe Market Volume (Units) Forecast By Sensing Mechanism, 2020-2035
  • Table 33: Eastern Europe Market Value (USD Million) Forecast by Country, 2020-2035
  • Table 34: Eastern Europe Market Volume (Units) Forecast by Country, 2020-2035
  • Table 35: Eastern Europe Market Value (USD Million) Forecast By Installation Type, 2020-2035
  • Table 36: Eastern Europe Market Volume (Units) Forecast By Installation Type, 2020-2035
  • Table 37: Eastern Europe Market Value (USD Million) Forecast By End Use, 2020-2035
  • Table 38: Eastern Europe Market Volume (Units) Forecast By End Use, 2020-2035
  • Table 39: Eastern Europe Market Value (USD Million) Forecast By Sensing Mechanism, 2020-2035
  • Table 40: Eastern Europe Market Volume (Units) Forecast By Sensing Mechanism, 2020-2035
  • Table 41: East Asia Market Value (USD Million) Forecast by Country, 2020-2035
  • Table 42: East Asia Market Volume (Units) Forecast by Country, 2020-2035
  • Table 43: East Asia Market Value (USD Million) Forecast By Installation Type, 2020-2035
  • Table 44: East Asia Market Volume (Units) Forecast By Installation Type, 2020-2035
  • Table 45: East Asia Market Value (USD Million) Forecast By End Use, 2020-2035
  • Table 46: East Asia Market Volume (Units) Forecast By End Use, 2020-2035
  • Table 47: East Asia Market Value (USD Million) Forecast By Sensing Mechanism, 2020-2035
  • Table 48: East Asia Market Volume (Units) Forecast By Sensing Mechanism, 2020-2035
  • Table 49: South Asia & Pacific Market Value (USD Million) Forecast by Country, 2020-2035
  • Table 50: South Asia & Pacific Market Volume (Units) Forecast by Country, 2020-2035
  • Table 51: South Asia & Pacific Market Value (USD Million) Forecast By Installation Type, 2020-2035
  • Table 52: South Asia & Pacific Market Volume (Units) Forecast By Installation Type, 2020-2035
  • Table 53: South Asia & Pacific Market Value (USD Million) Forecast By End Use, 2020-2035
  • Table 54: South Asia & Pacific Market Volume (Units) Forecast By End Use, 2020-2035
  • Table 55: South Asia & Pacific Market Value (USD Million) Forecast By Sensing Mechanism, 2020-2035
  • Table 56: South Asia & Pacific Market Volume (Units) Forecast By Sensing Mechanism, 2020-2035
  • Table 57: Middle East and Africa Market Value (USD Million) Forecast by Country, 2020-2035
  • Table 58: Middle East and Africa Market Volume (Units) Forecast by Country, 2020-2035
  • Table 59: Middle East and Africa Market Value (USD Million) Forecast By Installation Type, 2020-2035
  • Table 60: Middle East and Africa Market Volume (Units) Forecast By Installation Type, 2020-2035
  • Table 61: Middle East and Africa Market Value (USD Million) Forecast By End Use, 2020-2035
  • Table 62: Middle East and Africa Market Volume (Units) Forecast By End Use, 2020-2035
  • Table 63: Middle East and Africa Market Value (USD Million) Forecast By Sensing Mechanism, 2020-2035
  • Table 64: Middle East and Africa Market Volume (Units) Forecast By Sensing Mechanism, 2020-2035

List of Figures

  • Figure 1: Global Market Volume (Units) Forecast 2020-2035
  • Figure 2: Global Market Pricing Analysis
  • Figure 3: Global Market Value (USD Million) Forecast 2020-2035
  • Figure 4: Global Market Value Share and BPS Analysis By Installation Type, 2025 and 2035
  • Figure 5: Global Market Y-o-Y Growth Comparison By Installation Type, 2025-2035
  • Figure 6: Global Market Attractiveness Analysis By Installation Type
  • Figure 7: Global Market Value Share and BPS Analysis By End Use, 2025 and 2035
  • Figure 8: Global Market Y-o-Y Growth Comparison By End Use, 2025-2035
  • Figure 9: Global Market Attractiveness Analysis By End Use
  • Figure 10: Global Market Value Share and BPS Analysis By Sensing Mechanism, 2025 and 2035
  • Figure 11: Global Market Y-o-Y Growth Comparison By Sensing Mechanism, 2025-2035
  • Figure 12: Global Market Attractiveness Analysis By Sensing Mechanism
  • Figure 13: Global Market Value (USD Million) Share and BPS Analysis by Region, 2025 and 2035
  • Figure 14: Global Market Y-o-Y Growth Comparison by Region, 2025-2035
  • Figure 15: Global Market Attractiveness Analysis by Region
  • Figure 16: North America Market Incremental $ Opportunity, 2025-2035
  • Figure 17: Latin America Market Incremental $ Opportunity, 2025-2035
  • Figure 18: Western Europe Market Incremental $ Opportunity, 2025-2035
  • Figure 19: Eastern Europe Market Incremental $ Opportunity, 2025-2035
  • Figure 20: East Asia Market Incremental $ Opportunity, 2025-2035
  • Figure 21: South Asia & Pacific Market Incremental $ Opportunity, 2025-2035
  • Figure 22: Middle East and Africa Market Incremental $ Opportunity, 2025-2035
  • Figure 23: North America Market Value Share and BPS Analysis by Country, 2025 and 2035
  • Figure 24: North America Market Value Share and BPS Analysis By Installation Type, 2025 and 2035
  • Figure 25: North America Market Y-o-Y Growth Comparison By Installation Type, 2025-2035
  • Figure 26: North America Market Attractiveness Analysis By Installation Type
  • Figure 27: North America Market Value Share and BPS Analysis By End Use, 2025 and 2035
  • Figure 28: North America Market Y-o-Y Growth Comparison By End Use, 2025-2035
  • Figure 29: North America Market Attractiveness Analysis By End Use
  • Figure 30: North America Market Value Share and BPS Analysis By Sensing Mechanism, 2025 and 2035
  • Figure 31: North America Market Y-o-Y Growth Comparison By Sensing Mechanism, 2025-2035
  • Figure 32: North America Market Attractiveness Analysis By Sensing Mechanism
  • Figure 33: Latin America Market Value Share and BPS Analysis by Country, 2025 and 2035
  • Figure 34: Latin America Market Value Share and BPS Analysis By Installation Type, 2025 and 2035
  • Figure 35: Latin America Market Y-o-Y Growth Comparison By Installation Type, 2025-2035
  • Figure 36: Latin America Market Attractiveness Analysis By Installation Type
  • Figure 37: Latin America Market Value Share and BPS Analysis By End Use, 2025 and 2035
  • Figure 38: Latin America Market Y-o-Y Growth Comparison By End Use, 2025-2035
  • Figure 39: Latin America Market Attractiveness Analysis By End Use
  • Figure 40: Latin America Market Value Share and BPS Analysis By Sensing Mechanism, 2025 and 2035
  • Figure 41: Latin America Market Y-o-Y Growth Comparison By Sensing Mechanism, 2025-2035
  • Figure 42: Latin America Market Attractiveness Analysis By Sensing Mechanism
  • Figure 43: Western Europe Market Value Share and BPS Analysis by Country, 2025 and 2035
  • Figure 44: Western Europe Market Value Share and BPS Analysis By Installation Type, 2025 and 2035
  • Figure 45: Western Europe Market Y-o-Y Growth Comparison By Installation Type, 2025-2035
  • Figure 46: Western Europe Market Attractiveness Analysis By Installation Type
  • Figure 47: Western Europe Market Value Share and BPS Analysis By End Use, 2025 and 2035
  • Figure 48: Western Europe Market Y-o-Y Growth Comparison By End Use, 2025-2035
  • Figure 49: Western Europe Market Attractiveness Analysis By End Use
  • Figure 50: Western Europe Market Value Share and BPS Analysis By Sensing Mechanism, 2025 and 2035
  • Figure 51: Western Europe Market Y-o-Y Growth Comparison By Sensing Mechanism, 2025-2035
  • Figure 52: Western Europe Market Attractiveness Analysis By Sensing Mechanism
  • Figure 53: Eastern Europe Market Value Share and BPS Analysis by Country, 2025 and 2035
  • Figure 54: Eastern Europe Market Value Share and BPS Analysis By Installation Type, 2025 and 2035
  • Figure 55: Eastern Europe Market Y-o-Y Growth Comparison By Installation Type, 2025-2035
  • Figure 56: Eastern Europe Market Attractiveness Analysis By Installation Type
  • Figure 57: Eastern Europe Market Value Share and BPS Analysis By End Use, 2025 and 2035
  • Figure 58: Eastern Europe Market Y-o-Y Growth Comparison By End Use, 2025-2035
  • Figure 59: Eastern Europe Market Attractiveness Analysis By End Use
  • Figure 60: Eastern Europe Market Value Share and BPS Analysis By Sensing Mechanism, 2025 and 2035
  • Figure 61: Eastern Europe Market Y-o-Y Growth Comparison By Sensing Mechanism, 2025-2035
  • Figure 62: Eastern Europe Market Attractiveness Analysis By Sensing Mechanism
  • Figure 63: East Asia Market Value Share and BPS Analysis by Country, 2025 and 2035
  • Figure 64: East Asia Market Value Share and BPS Analysis By Installation Type, 2025 and 2035
  • Figure 65: East Asia Market Y-o-Y Growth Comparison By Installation Type, 2025-2035
  • Figure 66: East Asia Market Attractiveness Analysis By Installation Type
  • Figure 67: East Asia Market Value Share and BPS Analysis By End Use, 2025 and 2035
  • Figure 68: East Asia Market Y-o-Y Growth Comparison By End Use, 2025-2035
  • Figure 69: East Asia Market Attractiveness Analysis By End Use
  • Figure 70: East Asia Market Value Share and BPS Analysis By Sensing Mechanism, 2025 and 2035
  • Figure 71: East Asia Market Y-o-Y Growth Comparison By Sensing Mechanism, 2025-2035
  • Figure 72: East Asia Market Attractiveness Analysis By Sensing Mechanism
  • Figure 73: South Asia & Pacific Market Value Share and BPS Analysis by Country, 2025 and 2035
  • Figure 74: South Asia & Pacific Market Value Share and BPS Analysis By Installation Type, 2025 and 2035
  • Figure 75: South Asia & Pacific Market Y-o-Y Growth Comparison By Installation Type, 2025-2035
  • Figure 76: South Asia & Pacific Market Attractiveness Analysis By Installation Type
  • Figure 77: South Asia & Pacific Market Value Share and BPS Analysis By End Use, 2025 and 2035
  • Figure 78: South Asia & Pacific Market Y-o-Y Growth Comparison By End Use, 2025-2035
  • Figure 79: South Asia & Pacific Market Attractiveness Analysis By End Use
  • Figure 80: South Asia & Pacific Market Value Share and BPS Analysis By Sensing Mechanism, 2025 and 2035
  • Figure 81: South Asia & Pacific Market Y-o-Y Growth Comparison By Sensing Mechanism, 2025-2035
  • Figure 82: South Asia & Pacific Market Attractiveness Analysis By Sensing Mechanism
  • Figure 83: Middle East and Africa Market Value Share and BPS Analysis by Country, 2025 and 2035
  • Figure 84: Middle East and Africa Market Value Share and BPS Analysis By Installation Type, 2025 and 2035
  • Figure 85: Middle East and Africa Market Y-o-Y Growth Comparison By Installation Type, 2025-2035
  • Figure 86: Middle East and Africa Market Attractiveness Analysis By Installation Type
  • Figure 87: Middle East and Africa Market Value Share and BPS Analysis By End Use, 2025 and 2035
  • Figure 88: Middle East and Africa Market Y-o-Y Growth Comparison By End Use, 2025-2035
  • Figure 89: Middle East and Africa Market Attractiveness Analysis By End Use
  • Figure 90: Middle East and Africa Market Value Share and BPS Analysis By Sensing Mechanism, 2025 and 2035
  • Figure 91: Middle East and Africa Market Y-o-Y Growth Comparison By Sensing Mechanism, 2025-2035
  • Figure 92: Middle East and Africa Market Attractiveness Analysis By Sensing Mechanism
  • Figure 93: Global Market - Tier Structure Analysis
  • Figure 94: Global Market - Company Share Analysis

Frequently Asked Questions

What is the estimated market size of the plug-in pump alarm market in 2025?

The market is valued at USD 229.5 million in 2025.

How large is the plug-in pump alarm market expected to be in 2035?

It is projected to reach USD 302.4 million by 2035.

What is the expected CAGR for the plug-in pump alarm market between 2025 and 2035?

The market is anticipated to grow at a CAGR of 2.8% during the forecast period.

Which installation type segment is projected to lead the plug-in pump alarm market?

Wall-mounted plug-in pump alarms are expected to lead with a 45% market share in 2025.

Which sensing mechanism segment is expected to dominate the market?

Float switch mechanisms are projected to dominate with a 40% market share in 2025.

Which end-use segment will hold the highest share in 2025?

The municipal sector is forecasted to hold the largest share at 22% in 2025.

Explore Similar Insights

Future Market Insights

Plug-in Pump Alarm Market