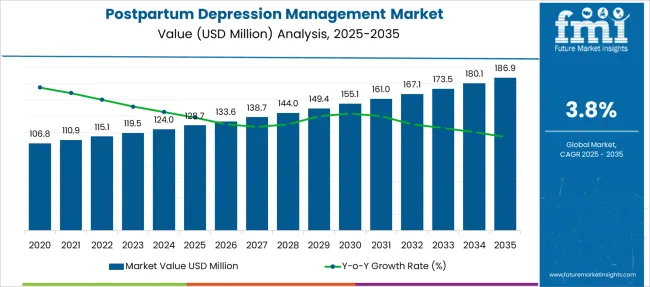
The Postpartum Depression Management Market is estimated to be valued at USD 128.7 million in 2025 and is projected to reach USD 186.9 million by 2035, registering a compound annual growth rate (CAGR) of 3.8% over the forecast period.
| Metric | Value |
|---|---|
| Postpartum Depression Management Market Estimated Value in (2025 E) | USD 128.7 million |
| Postpartum Depression Management Market Forecast Value in (2035 F) | USD 186.9 million |
| Forecast CAGR (2025 to 2035) | 3.8% |
The postpartum depression management market is expanding steadily, fueled by increased awareness of maternal mental health and improved screening practices. Growing recognition of postpartum depression as a significant public health concern has driven demand for effective treatment options and supportive care services.
Healthcare providers have emphasized early diagnosis and intervention to improve outcomes for mothers and families. Advances in pharmacological therapies, especially in anti-depressant medications, have enhanced treatment efficacy while efforts to reduce stigma have encouraged more women to seek help.
Distribution channels such as hospital pharmacies have played a vital role in ensuring timely access to prescribed medications. Additionally, expanding healthcare infrastructure and postpartum care programs have facilitated broader treatment coverage. As maternal health initiatives continue to prioritize mental well-being, the market outlook remains positive with opportunities to integrate newer therapies and digital health solutions. Segmental growth is expected to be led by Anti-Depressant Drugs in treatment and Hospital Pharmacies as the primary distribution channel.
The market is segmented by Treatment and Distribution Channel and region. By Treatment, the market is divided into Anti-Depressant Drugs, New Anti-Depressant Drugs, SAGE-547, Bupropion, Escitalopram, Fluoxetine, Paroxetine, Sertraline, Old Anti-Depressant Drugs, Amitriptyline, Desipramine, and Others. In terms of Distribution Channel, the market is classified into Hospital Pharmacies, Retail Pharmacies, Drug Stores, and E-commerce. Regionally, the market is classified into North America, Latin America, Western Europe, Eastern Europe, Balkan & Baltic Countries, Russia & Belarus, Central Asia, East Asia, South Asia & Pacific, and the Middle East & Africa.
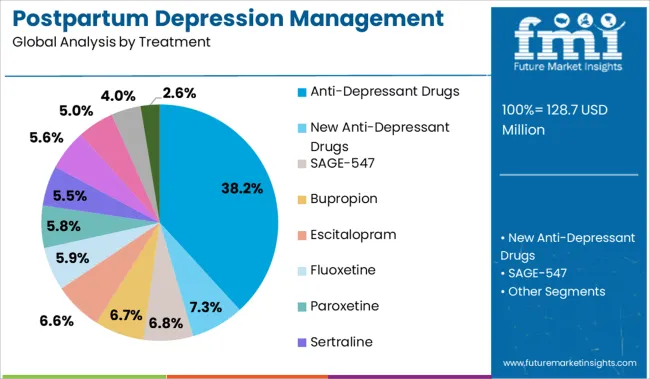
The Anti-Depressant Drugs segment is projected to hold 38.2% of the postpartum depression management market revenue in 2025, maintaining its leadership in treatment options. This segment’s growth is driven by the proven effectiveness of anti-depressants in alleviating depressive symptoms and improving maternal mood and functioning.
Physicians and psychiatrists often recommend these medications as a first-line therapy, supported by clinical guidelines and treatment protocols. Increased research has focused on developing drugs with improved safety profiles suitable for postpartum women, enhancing patient compliance.
Accessibility through healthcare facilities and growing awareness among patients have further supported adoption. As the need for standardized postpartum depression care grows, anti-depressant drugs are expected to remain the cornerstone of pharmacological management.
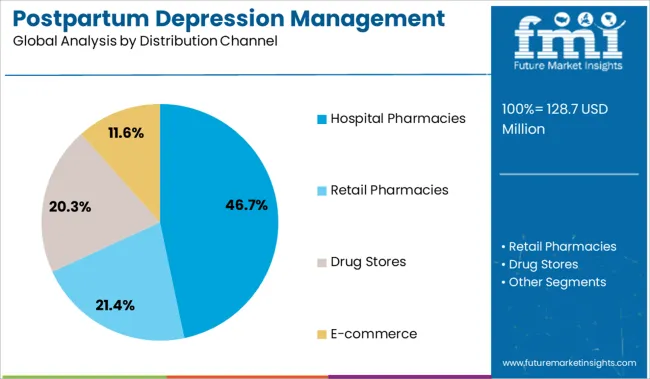
The Hospital Pharmacies segment is projected to account for 46.7% of the postpartum depression management market revenue in 2025, solidifying its position as the leading distribution channel. Hospital pharmacies serve as a critical point of access for patients requiring immediate and ongoing treatment.
Their role extends beyond dispensing medication to include patient counseling, medication management, and coordination with healthcare providers. The availability of anti-depressant drugs through hospital pharmacies ensures adherence to prescribed therapies and supports integration with overall maternal health care plans.
Additionally, hospital pharmacies benefit from established healthcare infrastructure, regulatory compliance, and insurance reimbursements that facilitate patient access. As postpartum care models evolve to emphasize comprehensive treatment, hospital pharmacies will continue to play a central role in delivering postpartum depression management solutions.
The growing demand for antidepressant drugs and talk therapies by expectant pregnant mothers is projecting the growth of the postpartum depression management market. Therefore, spending on postpartum depression management is increasing over time.
The postpartum depression management market is growing worldwide as women across the globe are lately experiencing postpartum depression as they find it difficult to cope with new responsibilities. The postpartum depression management market includes various home remedies that involve maintaining healthy lifestyle choices, avoiding isolation, to set realistic expectations.
Based on treatment type, anti-depressants are the most commonly used treatment methods over therapies as anti-depressants provide fast treatment and promising results in less time as compared with psychotherapies.
The anti-depressants treatment segment thus accounts for the largest revenue share in the postpartum depression management market. The segment is anticipated to follow the same trend in the postpartum depression management market over the next few years. As a result, women prefer it over psychotherapies to achieve faster results.
Some of the key factors driving the growth of the postpartum depression management market include the rise in risk factors associated with postpartum depression. These include the growing preference of women for the treatment of postpartum depression.
Women have become more aware of postpartum depression management and are more inclined to seek early treatment and therapies, which is further driving the global market for postpartum depression management.
It is expected that postpartum depression management market growth will be constrained by negligence and unacceptance of the condition, along with an inability to detect depression.
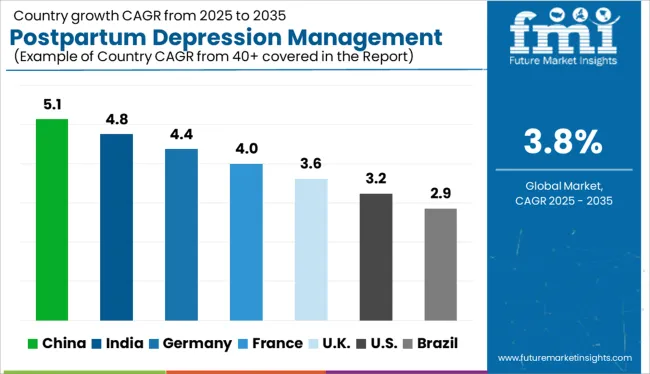
The demand for postpartum depression management has increased in the North American region. North America is anticipated to control a postpartum depression management market share of 37.5% in 2025.
In the last decade, North America has held the largest revenue share in the global postpartum depression management market on account of rising awareness among women regarding postpartum depression. It also enhanced decision-making by women with high educational attainment and easy availability of psychotherapy sessions with specialized doctors.
Europe's Postpartum Depression Management is predicted to experience significant growth and hold a market share of 29% in 2025. Mental health awareness is increasing among individuals and major companies are investing in countries in this region, which is driving revenues in the Europe postpartum depression market.
The market for postpartum depression in Europe is expected to be driven by an increasing number of initiatives to treat postpartum depression through telemedicine virtual support over calls and online counseling, as well as an increasing number of support groups and mental health communities for mothers.
The start-up ecosystem in the postpartum depression management market is clouded by several pharmaceutical companies, including Marinus Pharma and others, who are actively developing therapies to grow the postpartum depression management market share. In addition, they manufacture novel therapies to transform the treatment paradigm of the postpartum depression management market.
Sage Therapeutics and Marinus Pharmaceuticals are two major players developing therapies for postpartum depression (PPD). There will be a significant impact on the postpartum depression (PPD) market from the launch of new therapies such as SAGE-217 and Ganaxolone.
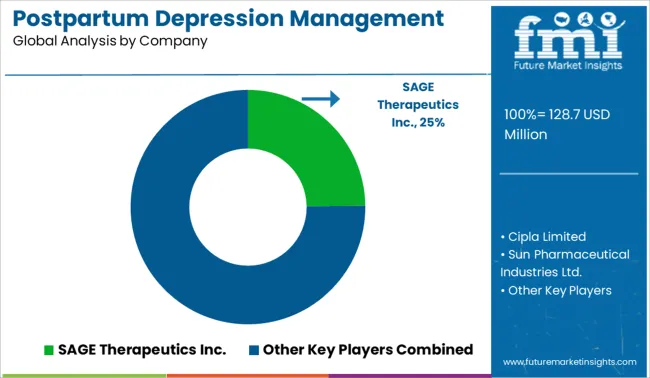
The postpartum depression management market is consolidated with a presence of a few strong players from around the globe. Some of the key players present in the global postpartum depression management market are Sage Therapeutics Inc., Cipla Limited, Sun Pharmaceutical Industries Ltd., Anikem Laboratories, Intas Pharmaceuticals Ltd., Mylan N.V., Sumika Fine Chemicals Co Ltd., and others.
emerging trends in the postpartum depression management market are brought about as a result of the major players' adoption of several growth strategies, including product launches, acquisitions, and collaborations.
Some of the recent developments in the Postpartum Depression Management market are as follows:
| Report Attribute | Details |
|---|---|
| Growth Rate | CAGR of 3.8% from 2025 to 2035 |
| Base Year for Estimation | 2025 |
| Historical Data | 2020 to 2024 |
| Forecast Period | 2025 to 2035 |
| Quantitative Units | Revenue in USD Million and CAGR from 2025 to 2035 |
| Report Coverage | Revenue Forecast, Volume Forecast, Company Ranking, Competitive Landscape, Growth Factors, Trends, and Pricing Analysis |
| Segments Covered | Treatment Type, Distribution Channel, Region |
| Regions Covered | North America; Latin America; Western Europe; Eastern Europe; The Asia Pacific excluding Japan; Japan; The Middle East and Africa |
| Key Countries Profiled | The USA, Canada, Brazil, Argentina, Germany, The UK, France, Spain, Italy, Nordics, BENELUX, Australia & New Zealand, China, India, GCC Countries, South Africa |
| Key Companies Profiled | Sage Therapeutics Inc.; Cipla Limited; Sun Pharmaceutical Industries Ltd.; Anikem Laboratories; Intas Pharmaceuticals Ltd.; Mylan N.V.; Sumika Fine Chemicals Co Ltd. |
| Customization | Available Upon Request |
The global postpartum depression management market is estimated to be valued at USD 128.7 million in 2025.
The market size for the postpartum depression management market is projected to reach USD 186.9 million by 2035.
The postpartum depression management market is expected to grow at a 3.8% CAGR between 2025 and 2035.
The key product types in postpartum depression management market are anti-depressant drugs, new anti-depressant drugs, sage-547, bupropion, escitalopram, fluoxetine, paroxetine, sertraline, old anti-depressant drugs, amitriptyline, desipramine and others.
In terms of distribution channel, hospital pharmacies segment to command 46.7% share in the postpartum depression management market in 2025.


Full Research Suite comprises of:
Market outlook & trends analysis
Interviews & case studies
Strategic recommendations
Vendor profiles & capabilities analysis
5-year forecasts
8 regions and 60+ country-level data splits
Market segment data splits
12 months of continuous data updates
DELIVERED AS:
PDF EXCEL ONLINE
Postpartum Health Supplements Market Size and Share Forecast Outlook 2025 to 2035
Depression And Seasonal Affective Disorder Therapeutics Market Size and Share Forecast Outlook 2025 to 2035
Depression Treatment Market Insights - Trends & Forecast 2024 to 2034
Depression Drugs Market
Drug Free Depression Treatment Market Size and Share Forecast Outlook 2025 to 2035
Treatment-Resistant Depression Treatment Market Size and Share Forecast Outlook 2025 to 2035
Anxiety Disorders And Depression Treatment Market Size and Share Forecast Outlook 2025 to 2035
Opioid-Induced Respiratory Depression Market
Tax Management Market Size and Share Forecast Outlook 2025 to 2035
Key Management as a Service Market
Cash Management Supplies Packaging Market Size and Share Forecast Outlook 2025 to 2035
Fuel Management Software Market Size and Share Forecast Outlook 2025 to 2035
Risk Management Market Size and Share Forecast Outlook 2025 to 2035
SBOM Management and Software Supply Chain Compliance Market Analysis - Size, Share, and Forecast Outlook 2025 to 2035
Case Management Software (CMS) Market Size and Share Forecast Outlook 2025 to 2035
Farm Management Software Market Size and Share Forecast Outlook 2025 to 2035
Lead Management Market Size and Share Forecast Outlook 2025 to 2035
Pain Management Devices Market Growth - Trends & Forecast 2025 to 2035
Data Management Platforms Market Analysis and Forecast 2025 to 2035, By Type, End User, and Region
Cash Management Services Market – Trends & Forecast 2025 to 2035

Thank you!
You will receive an email from our Business Development Manager. Please be sure to check your SPAM/JUNK folder too.
Chat With
MaRIA