

- Market Size (2026)
- USD 1.2 Bn
- Forecast (2036)
- USD 2.7 Bn
- CAGR (2026 to 2036)
- 8.6%
Private Label Greens Powder Market Size, Forecast and Outlook By FMI
The private label greens powder market is forecast to grow from USD 1.1 billion in 2025 to USD 2.7 billion by 2036 at 8.6% CAGR as brand owners shift from building their own blending capacity toward contract-made organic formulas. E-commerce brands are projected to represent 51.3% share in 2026 as smaller wellness sellers rely on ready manufacturing partners before they invest in plants. Custom blends are expected to secure 48.6% share in 2026 since product owners want ingredient control without managing organic sourcing themselves.
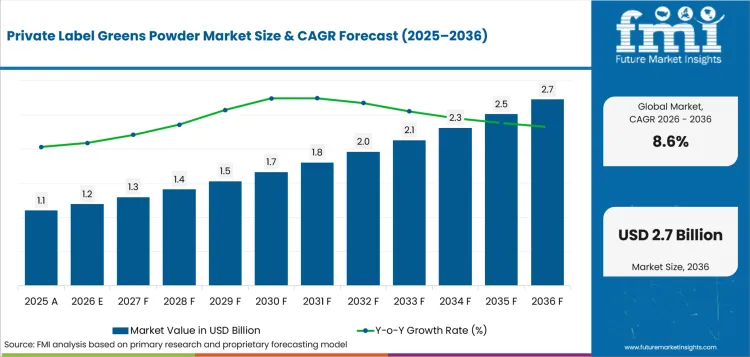
Key Takeaways, Market Size, and Forecast
- 2026 Market Size: USD 1.2 billion
- 2036 Market Size: USD 2.7 billion
- Forecast CAGR: 8.6% from 2026 to 2036
- Leading Sales Channel: E-Commerce Brands
- E-Commerce Brands Share in 2026: 51.3%
- Leading Formulation Scope: Custom Blends
- Custom Blends Share in 2026: 48.6%
- Fastest-growing Country: South Korea
- South Korea CAGR: 10.2% by 2036
Summary of Private Label Greens Powder Market
- Demand and Growth Drivers
- Brand owners are using private-label partners to avoid plant investment while testing organic greens products online.
- Retailers prefer suppliers that can provide organic records and repeatable powder blending.
- Contract manufacturers are adding stock greens formulas that reduce launch lead time for small wellness brands.
- Product and Segment View
- E-commerce brands are projected to represent 51.3% share in 2026 due to direct-response product launches and subscription packaging.
- Custom blends are forecast to hold 48.6% share in 2026 as brand owners seek formula ownership.
- Tubs are expected to secure 46.5% share in 2026 due to lower filling complexity and familiar pantry use.
- Geography and Competitive Outlook
- South Korea is projected to record 10.2% CAGR by 2036 with beauty-wellness sellers moving into functional powder lines.
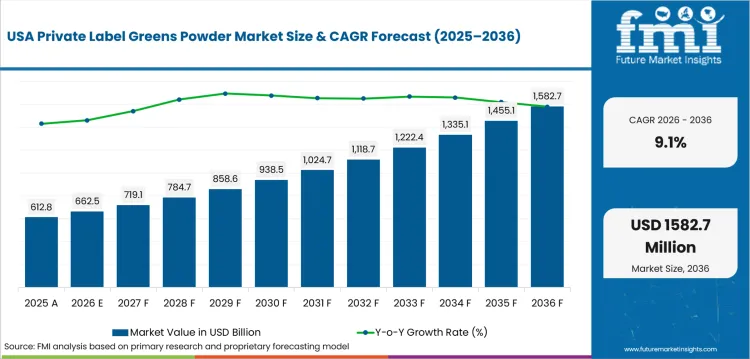
- The United States is expected to expand at 9.1% CAGR through 2036 due to DTC supplement scale and organic certification depth.
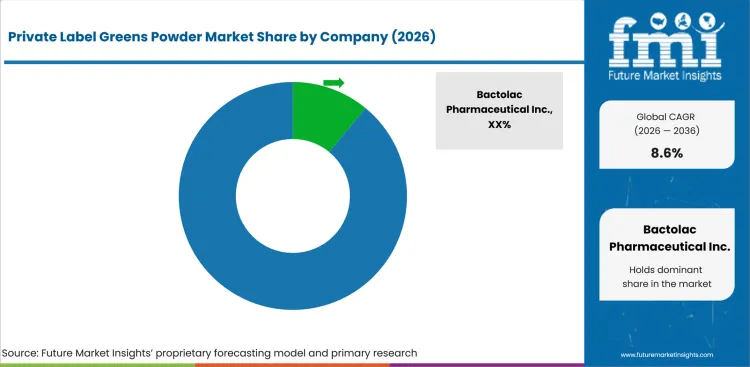
- Bactolac and Makers Nutrition compete by powder capacity and brand support services.
- Vitaquest and SMP Nutra stand out with custom formula support and contract manufacturing depth for powder-based supplements.
- Analyst Opinion
- Nandini Roy Choudhury, Principal Consultant for Food and Beverage at FMI, observes, "Private label greens powders have moved beyond being a simple shortcut for small wellness brands. Today’s buyers prioritize proof such as organic credentials and flexible fill formats. Suppliers who make these effortless are the ones winning repeat orders."
- Private Label Greens Powder Market Value Analysis
- Market value is supported by finished organic powder revenue before brand owners add retail margin and media spending.
- Supplier pricing reflects ingredient certification and testing costs before flavor systems affect repeat buying.
- Revenue improves when DTC brands reorder the same formula through subscription-led inventory planning.
- Private label demand is predicted to rise as retailers need store-brand wellness products without owning supplement plants.
The private label greens powder market is gaining momentum as retailers and digital wellness brands use owned label products to test demand without investing in full scale manufacturing. The USA Census Bureau reported in May 2026 that first quarter e-commerce sales rose 9.7% from the same period in 2025. These sales accounted for 16.8% of total retail activity. This trend supports private label greens powders as trial purchases and subscriptions are easily managed through online storefronts. Repeat replenishment is also driven through marketplace programs.
Quality screening is becoming a critical purchase factor after the FDA issued a 2025 warning letter to Valentine Enterprises. The letter raised concerns about label comparisons for vitamins and zinc in 8Greens Super Greens Powder. Vitaquest released a powdered greens guide in April 2025 that highlights supplier side priorities. The guide points to ingredient sourcing as a core requirement. It also highlights manufacturing processes and packaging design as key decision factors. Demand is now shifting toward manufacturers that offer fast private label launch support. These manufacturers must also provide traceable ingredient inputs and strong finished product documentation.
Why is the Private Label Greens Powder Market Growing?
- Organic greens brands are outsourcing blending so they can test product fit before making plant investments.
- Contract manufacturers are adding powder lines that support tubs, sachets, and stick packs for different channels.
- Buyers are placing more weight on organic documents and finished product testing before approving repeat batches.
Growth is becoming more structured as private-label sellers use established green supplement categories to test daily nutrition claims without owning production plants. The shift is visible in the way supplement buyers ask for shorter launch timelines and stronger release documents. The Council for Responsible Nutrition reported in October 2024 that 75.0% of Americans used dietary supplements. That broad user base gives brand owners a reason to test greens powders as daily use products. USDA reported in March 2025 that USA organic imports reached USD 5.7 billion in 2024. This supply base supports imported organic botanicals, but it also raises the need for cleaner supplier records. Private label suppliers that already serve the dietary supplement space can reuse compliance systems across powder lines and reduce buyer onboarding work.
Market Segmentation Analysis
- With an estimated 51.3% share in 2026, e-commerce brands are expected to lead sales channel demand as subscription launches need flexible production.
- Custom blends are projected to account for 48.6% share in 2026 since formula ownership helps brands avoid direct product matching.
- Tubs are anticipated to hold 46.5% of packaging format revenue in 2026 as filling cost stays lower than stick packs.
- DTC brands are forecast to represent 44.2% of buyer type revenue in 2026 through social commerce and subscription programs.
- Organic multi-greens blends are projected to account for 38.4% share in 2026 with buyers seeking one powder that covers several plant sources.
The private label greens powder industry is segmented by product type, buyer type, formulation scope, packaging format, sales channel, and region. Product type covers organic multi-greens blends and algae-led products. Buyer type covers DTC brands and retailer labels. Formulation scope separates custom blends from stock formulas. Packaging format matters because tubs are cheaper to fill than stick packs. Sales channel matters because DTC brands and retailer labels buy private-label programs differently.
Insights into Private Label Greens Powder Market by Product Type
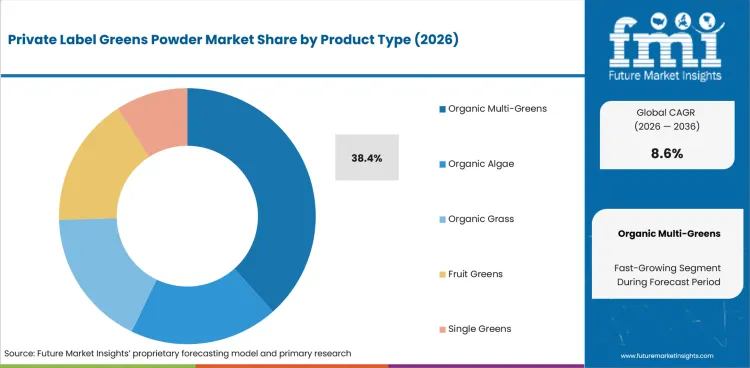
- Organic multi-greens blends are projected to account for 38.4% share in 2026 as buyers prefer one formula that combines grasses and algae.
- Single greens remain useful for clean-label brands that want fewer ingredients and easier allergen review.
Insights into Private Label Greens Powder Market by Buyer Type
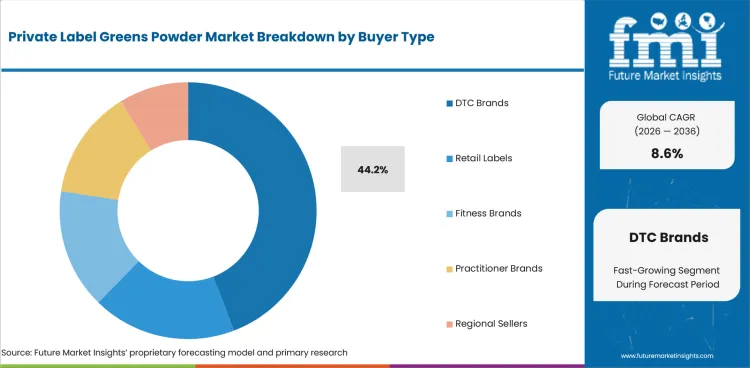
- DTC brands are forecast to hold 44.2% share in 2026 since small wellness sellers use private label supply to avoid plant ownership.
- Retail labels place larger orders but often require tougher proof around organic handling and label review.
Insights into Private Label Greens Powder Market by Formulation Scope
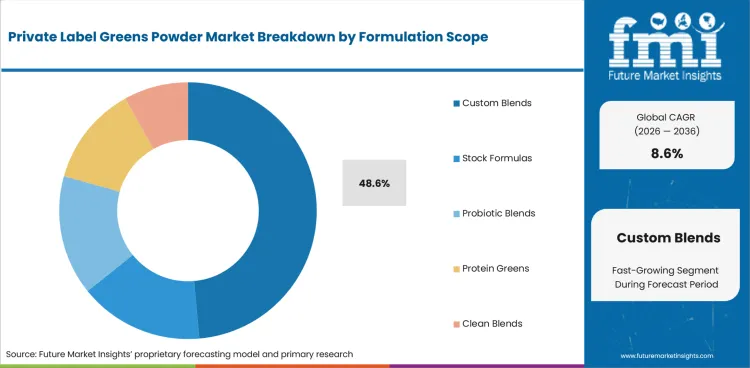
- Custom blends are anticipated to secure 48.6% share in 2026 through formula ownership and better brand separation.
- Stock formulas continue to serve launch-stage sellers that need lower order size and faster commercial timing.
Insights into Private Label Greens Powder Market by Packaging Format
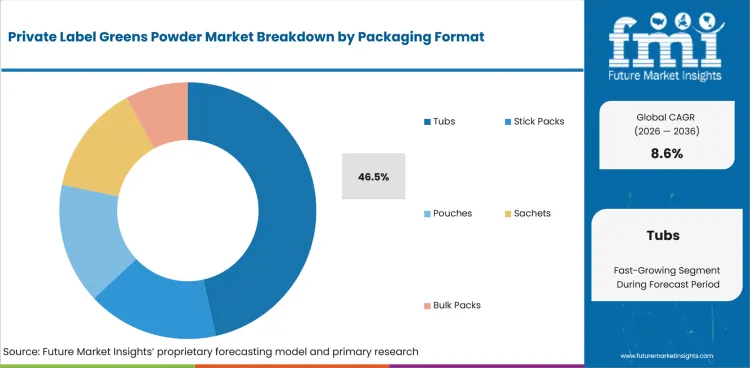
- Tubs are expected to represent 46.5% share in 2026 as brands choose lower filling cost and familiar kitchen storage.
- Stick packs gain value in travel and trial packs where serving control matters more than lowest unit cost.
Insights into Private Label Greens Powder Market by Sales Channel
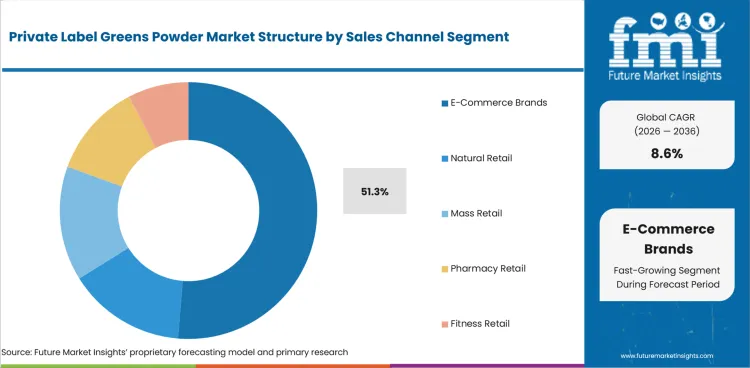
- E-commerce brands are projected to hold 51.3% share in 2026 as subscription pages can test flavors before retail rollout.
- Natural retail stores still matter for shoppers who compare organic claims and ingredient panels at shelf level.
Private Label Greens Powder Market Drivers, Restraints, and Opportunities
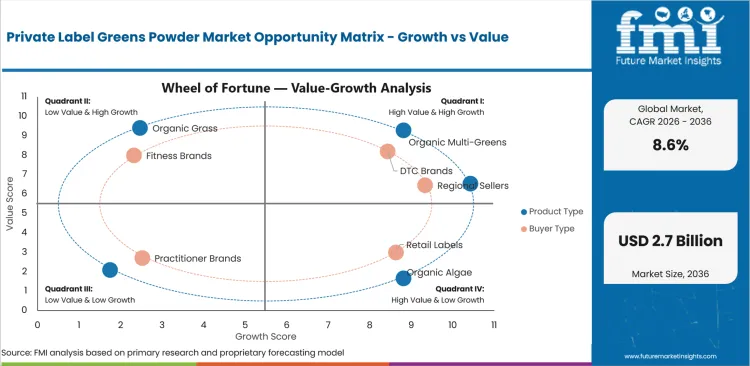
- Driver: DTC wellness brands are using contract manufacturers to launch organic greens lines without blending rooms and label staff.
- Restraint: Organic ingredient traceability can delay product release when suppliers cannot match lot records to finished batches.
- Opportunity: Retail private labels can use certified powder partners to add wellness products without building supplement factories.
Private label growth is supported by upstream vegetable powders supply as dehydrated plant ingredients move into daily nutrition formulas. The demand case is practical rather than promotional. Brand owners need products that can be launched quickly and repeated without formulation drift. FDA current good manufacturing practice rules for dietary supplements require written procedures and qualified staff. That raises the value of suppliers with finished powder records already in place. The main constraint is the same paperwork burden. When organic documentation is incomplete, product owners must delay labels or accept a narrower claim set. Some brands attach greens powders to adjacent protein powder portfolios so that existing sports nutrition buyers can test daily plant blends.
Consumer Segmentation and Purchase Behavior Analysis
Consumer segmentation is centered on adults who buy daily wellness products through subscriptions and natural retail shelves. The National Center for Health Statistics reported that 60.2% of USA adults used any dietary supplement during August 2021 to August 2023. This level of use gives greens powder brands a large audience, but it does not remove the need for trust. Private label sellers must explain organic status, serving size and taste in simple terms. Repeat buying is more likely when product pages make the daily routine easy to understand. Brands that link greens blends with vegan protein products can reach shoppers already using plant-based powders each week.
Voice of Customer and Decision-driver Analysis
Purchase decisions depend on trust before flavor becomes the final reason to repeat. Buyers compare organic logos, ingredient panels, and customer reviews before they compare grams of each botanical. For brand owners, the same logic applies to supplier choice. They ask whether a manufacturer can source certified ingredients and support label review. Low minimum order size matters during launch, but it is less important once a formula starts to reorder. The supplier decision then shifts toward stable batch release and pack consistency. Buyer trust in botanical claims also connects private-label greens with the wider herbal supplements category where ingredient identity is central to repeat sales.
Analysis of Private Label Greens Powder Market by Key Countries
.webp "Top Country Growth Comparison Private Label Greens Powder Market Cagr (2026 2036)")
| Country | CAGR |
|---|---|
| South Korea | 10.2% |
| United States | 9.1% |
| United Kingdom | 8.9% |
| Australia | 8.6% |
| Canada | 8.3% |
| Germany | 7.8% |
| Japan | 7.4% |
Source: Future Market Insights, 2026.
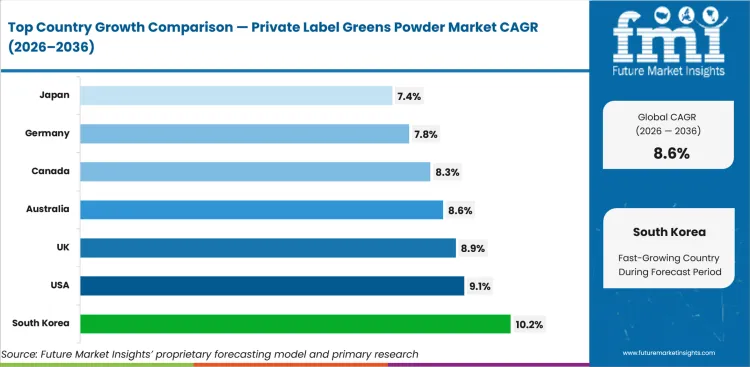
Private Label Greens Powder Market CAGR Analysis by Country
- South Korea is projected to record a 10.2% CAGR through 2036 as beauty-wellness sellers expand powder-based nutrition lines.
- The United States is expected to expand at 9.1% CAGR through 2036 since DTC supplement brands use contract plants at scale.
- The United Kingdom is forecast to grow at 8.9% CAGR through 2036 with organic retail recovery supporting new greens launches.
- Australia is expected to advance at 8.6% CAGR through 2036 where natural health channels favor certified powder formats.
- Canada is projected to rise at 8.3% CAGR through 2036 with online wellness brands using domestic and USA suppliers.
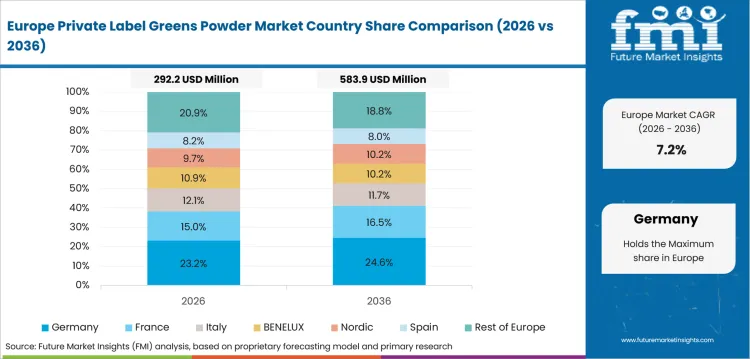
- Germany is forecast at 7.8% CAGR through 2036 given drugstore private labels and organic store brands shape purchasing.
- Japan is expected to post 7.4% CAGR through 2036 with functional food buyers moving cautiously into organic powder blends.
Sales Outlook for Private Label Greens Powder Market in South Korea
Beauty-wellness commerce and contract supplement manufacturing center · 2026 to 2036
Country Market Snapshot Table
| Parameter | Value |
|---|---|
| Market Size in 2025 (Value) | USD 72.6 million |
| Market Size in 2026 (Value) | USD 80.0 million |
| Market Forecast in 2036 (Value) | USD 211.3 million |
| CAGR (2026 to 2036) | 10.2% |
| Years Considered | 2021 to 2036 |
| Base Year | 2025 |
| Forecast Period | 2026 to 2036 |
| Units Considered | Value (USD million) |
| Leading Sub-Region | Seoul and online wellness brand corridors |
South Korea Private Label Greens Powder Market Outlook
- South Korea private label greens powder demand is influenced by beauty-wellness brands that sell functional nutrition through online channels. Local supplement makers can support small production runs before a brand scales into retail.
Key Growth Drivers
- Korean wellness sellers use powder formats to test beauty-from-within claims before launching larger supplement ranges.
- Local CDMOs support smaller brands with formulation and packaging support that lowers setup friction.
- Organic positioning fits export-minded brands that want to sell into the United States and Japan.
- E-commerce routines support monthly replenishment packs that fit greens powder use.
Key Restraints
- Organic raw material sourcing can remain import-dependent and raise landed costs for algae and grass powders.
- Functional claims need careful review because health-positioned foods face stricter wording in Korea.
- Taste masking can limit repeat purchase when high botanical loads create grassy notes.
What makes South Korea unique
South Korea is unique due to beauty-led wellness branding and CDMO capacity built around health functional food launches.
Key Companies
-
Kolmar BNH Co. Ltd.
- Cosmax NBT Inc.
- Novarex Co. Ltd.
- Natural F&P Co. Ltd.
- Suheung Co. Ltd.
- Huons Natural Co. Ltd.
- Raphas Co. Ltd.
Sales & Marketing Channels
- Online malls
- Beauty retail
- Pharmacy chains
- Health stores
- TV commerce
- Export distributors
Market Taxonomy and Sub-Regions Covered
| Segment | Sub-Segments |
|---|---|
| By Product Type | Organic Multi-Greens · Organic Algae · Organic Grass · Fruit Greens · Single Greens |
| By Buyer Type | DTC Brands · Retail Labels · Fitness Brands · Practitioner Brands · Regional Sellers |
| By Formulation Scope | Custom Blends · Stock Formulas · Probiotic Blends · Protein Greens · Clean Blends |
| By Packaging Format | Tubs · Stick Packs · Pouches · Sachets · Bulk Packs |
| By Sales Channel | E-Commerce Brands · Natural Retail · Mass Retail · Pharmacy Retail · Fitness Retai |
| Key Sub-Regions Covered, Retail and Online Corridors | Seoul · Incheon · Gyeonggi · Busan · Daegu · Daejeon |
Frequently Asked Questions
How fast is South Korea private label greens powder market growing?
Sales in South Korea are forecast to grow at 10.2% CAGR from 2026 to 2036 through certified powder supply and online wellness selling.
Who leads South Korea private label greens powder market?
Kolmar BNH Co. Ltd., Cosmax NBT Inc., and Novarex Co. Ltd. compete through local manufacturing access and label support.
What is driving adoption in South Korea private label greens powder market?
Organic claim discipline and contract manufacturing access are moving brand owners toward private-label greens powder supply.
Demand Outlook for Private Label Greens Powder Market in the United States
DTC brand scale and organic certification center · 2026 to 2036
Country Market Snapshot Table
| Parameter | Value |
|---|---|
| Market Size in 2025 (Value) | USD 330.0 million |
| Market Size in 2026 (Value) | USD 360.0 million |
| Market Forecast in 2036 (Value) | USD 860.1 million |
| CAGR (2026 to 2036) | 9.1% |
| Years Considered | 2021 to 2036 |
| Base Year | 2025 |
| Forecast Period | 2026 to 2036 |
| Units Considered | Value (USD million) |
| Leading Sub-Region | California, New York, Florida, and national DTC corridors |
United States Private Label Greens Powder Market Outlook
- United States demand is shaped by high supplement use and a deep base of contract manufacturers. Brand owners can compare low minimum order suppliers and high-capacity powder plants in the same market.
- USDA Organic enforcement gives buyers a clear reason to check supplier paperwork before launch. Brands with clean batch records and direct fulfillment support can move faster from test launch to subscription scale.
Key Growth Drivers
- USDA reported organic imports at USD 5.7 billion in 2024, which shows a broad certified ingredient supply base.
- CRN reported 75.0% USA supplement use in October 2024, giving greens brands a large user pool.
- DTC sellers use subscription programs to plan reorder cycles before moving into retail.
- Domestic suppliers offer tub filling and custom flavoring that reduces first-launch complexity.
Key Restraints
- FDA rules make batch records and qualified staff mandatory, raising compliance costs for smaller suppliers.
- Organic claims can be challenged when imported ingredient files are incomplete or inconsistent.
- Paid acquisition costs can pressure new brands before repeat purchases stabilize.
What makes the United States unique
The United States is unique due to DTC supplement scale, organic import depth, and a large contract manufacturing base.
Key Companies
- Bactolac Pharmaceutical Inc.
- Makers Nutrition LLC
- SMP Nutra LLC
- Vitaquest International LLC
- NutraScience Labs Inc.
- NutraPak USA LLC
- Vox Nutrition Inc.
Sales & Marketing Channels
- Direct websites
- Amazon stores
- Natural retail
- Mass retail
- Subscription channels
- Practitioner stores
Market Taxonomy and Sub-Regions Covered
| Segment | Sub-Segments |
|---|---|
| By Product Type | Organic Multi-Greens · Organic Algae · Organic Grass · Fruit Greens · Single Greens |
| By Buyer Type | DTC Brands · Retail Labels · Fitness Brands · Practitioner Brands · Regional Sellers |
| By Formulation Scope | Custom Blends · Stock Formulas · Probiotic Blends · Protein Greens · Clean Blends |
| By Packaging Format | Tubs · Stick Packs · Pouches · Sachets · Bulk Packs |
| By Sales Channel | E-Commerce Brands · Natural Retail · Mass Retail · Pharmacy Retail · Fitness Retail |
| Key Sub-Regions Covered, Retail and Online Corridors | California · New York · Florida · Texas · New Jersey · Utah |
Frequently Asked Questions
How fast is United States private label greens powder market growing?
Sales in United States are forecast to grow at 9.1% CAGR from 2026 to 2036 through certified powder supply and online wellness selling.
Who leads United States private label greens powder market?
Bactolac Pharmaceutical Inc., Makers Nutrition LLC, and SMP Nutra LLC compete through local manufacturing access and label support.
What is driving adoption in United States private label greens powder market?
Organic claim discipline and contract manufacturing access are moving brand owners toward private-label greens powder supply.
Growth Outlook for Private Label Greens Powder Market in the United Kingdom
Organic retail recovery and online supplement launch center · 2026 to 2036
Country Market Snapshot Table
| Parameter | Value |
|---|---|
| Market Size in 2025 (Value) | USD 96.4 million |
| Market Size in 2026 (Value) | USD 105.0 million |
| Market Forecast in 2036 (Value) | USD 246.3 million |
| CAGR (2026 to 2036) | 8.9% |
| Years Considered | 2021 to 2036 |
| Base Year | 2025 |
| Forecast Period | 2026 to 2036 |
| Units Considered | Value (USD million) |
| Leading Sub-Region | London, Manchester, Birmingham, and online wellness retail |
United Kingdom Private Label Greens Powder Market Outlook
United Kingdom demand is supported by organic retail recovery and a large base of online supplement sellers. Buyers often compare supplier support for label wording and pouch formats before choosing a manufacturer. Suppliers that can serve both tubs and sachets should hold stronger channel fit.
Key Growth Drivers
- Soil Association reported 8.0% growth for organic supermarket sales in 2025, supporting organic claim visibility.
- UK wellness brands use online launches to test greens blends before wholesale listings.
- Local manufacturers offer sachet and pouch options that fit trial and travel formats.
- Retailers prefer clear label wording where organic and nutrition claims appear together.
Key Restraints
- The UK has only 3.0% organic farmland, which keeps the country reliant on imported inputs.
- Claim wording needs careful review across food supplement and nutrition rules.
- Small brands can face higher unit costs when they choose sachets before volume is proven.
What makes the United Kingdom unique
The United Kingdom is unique due to organic retail recovery and a supplier base that serves online wellness brands.
Key Companies
- ParkAcre Enterprises Limited
- Supplement Factory Limited
- Bee Health Limited
- Power Body Nutrition Limited
- Private Label Nutrition Limited
- Natures Aid Limited
- Oxford Contract Manufacturing Limited
Sales & Marketing Channels
- Brand websites
- Organic stores
- Pharmacies
- Gym retail
- Subscription stores
- Marketplace sellers
Market Taxonomy and Sub-Regions Covered
| Segment | Sub-Segments |
|---|---|
| By Product Type | Organic Multi-Greens · Organic Algae · Organic Grass · Fruit Greens · Single Greens |
| By Buyer Type | DTC Brands · Retail Labels · Fitness Brands · Practitioner Brands · Regional Sellers |
| By Formulation Scope | Custom Blends · Stock Formulas · Probiotic Blends · Protein Greens · Clean Blends |
| By Packaging Format | Tubs · Stick Packs · Pouches · Sachets · Bulk Packs |
| By Sales Channel | E-Commerce Brands · Natural Retail · Mass Retail · Pharmacy Retail · Fitness Retail |
| Key Sub-Regions Covered, Retail and Online Corridors | London · Manchester · Birmingham · Leeds · Glasgow · Bristol |
Frequently Asked Questions
How fast is United Kingdom private label greens powder market growing?
Sales in United Kingdom are forecast to grow at 8.9% CAGR from 2026 to 2036 through certified powder supply and online wellness selling.
Who leads United Kingdom private label greens powder market?
ParkAcre Enterprises Limited, Supplement Factory Limited, and Bee Health Limited compete through local manufacturing access and label support.
What is driving adoption in United Kingdom private label greens powder market?
Organic claim discipline and contract manufacturing access are moving brand owners toward private-label greens powder supply.
Opportunity Analysis for Private Label Greens Powder Market in Australia
Natural health retail and organic certification center · 2026 to 2036
Country Market Snapshot Table
| Parameter | Value |
|---|---|
| Market Size in 2025 (Value) | USD 69.1 million |
| Market Size in 2026 (Value) | USD 75.0 million |
| Market Forecast in 2036 (Value) | USD 171.1 million |
| CAGR (2026 to 2036) | 8.6% |
| Years Considered | 2021 to 2036 |
| Base Year | 2025 |
| Forecast Period | 2026 to 2036 |
| Units Considered | Value (USD million) |
| Leading Sub-Region | Sydney, Melbourne, Brisbane, and natural health retail |
Australia Private Label Greens Powder Market Outlook
- Australia private label greens powder demand is concentrated in natural health retail and online wellness brands. Buyers place weight on certification credibility because domestic organic claims have drawn public scrutiny. Australian organic sector bodies noted the need for clearer industry data and certification alignment in 2025. That context favors suppliers able to prove organic status and keep batch files clean for local retailers.
Key Growth Drivers
- Australian Organic Limited noted the sector generates about AUD 2.6 billion each year for the economy.
- Natural health retailers give greens powders shelf space when brands can show certified ingredient sourcing.
- Local supplement makers support powder filling for brands that want domestic origin cues.
- Online sellers use subscription packs to reduce the risk of retail listing fees.
Key Restraints
- Domestic organic claim confusion can make buyers more cautious before approving new labels.
- Australia’s distance from some botanical sources can raise freight and inventory costs.
- Small population scale can limit early production runs for complex custom formulas.
What makes Australia unique
Australia is unique due to natural health retail depth and buyer sensitivity around verified organic claims.
Key Companies
- Lipa Pharmaceuticals Limited
- PharmaCare Laboratories Pty Ltd.
- McPhersons Consumer Products Pty Ltd.
- Morlife Pty Ltd.
- Nutra Organics Pty Ltd.
- Unique Health Products Pty Ltd.
- Star Combo Pharma Limited
Sales & Marketing Channels
- Health stores
- Pharmacy retail
- Brand websites
- Marketplace sellers
- Practitioner channels
- Grocery wellness aisles
Market Taxonomy and Sub-Regions Covered
| Segment | Sub-Segments |
|---|---|
| By Product Type | Organic Multi-Greens · Organic Algae · Organic Grass · Fruit Greens · Single Greens |
| By Buyer Type | DTC Brands · Retail Labels · Fitness Brands · Practitioner Brands · Regional Sellers |
| By Formulation Scope | Custom Blends · Stock Formulas · Probiotic Blends · Protein Greens · Clean Blends |
| By Packaging Format | Tubs · Stick Packs · Pouches · Sachets · Bulk Packs |
| By Sales Channel | E-Commerce Brands · Natural Retail · Mass Retail · Pharmacy Retail · Fitness Retail |
| Key Sub-Regions Covered, Retail and Online Corridors | Sydney · Melbourne · Brisbane · Perth · Adelaide · Gold Coast |
Frequently Asked Questions
How fast is Australia private label greens powder market growing?
Sales in Australia are forecast to grow at 8.6% CAGR from 2026 to 2036 through certified powder supply and online wellness selling.
Who leads Australia private label greens powder market?
Lipa Pharmaceuticals Limited, PharmaCare Laboratories Pty Ltd., and McPhersons Consumer Products Pty Ltd. compete through local manufacturing access and label support.
What is driving adoption in Australia private label greens powder market?
Organic claim discipline and contract manufacturing access are moving brand owners toward private-label greens powder supply.
Demand Analysis for Private Label Greens Powder Market in Canada
Organic buyer trust and cross-border supplement supply center · 2026 to 2036
Country Market Snapshot Table
| Parameter | Value |
|---|---|
| Market Size in 2025 (Value) | USD 83.1 million |
| Market Size in 2026 (Value) | USD 90.0 million |
| Market Forecast in 2036 (Value) | USD 199.8 million |
| CAGR (2026 to 2036) | 8.3% |
| Years Considered | 2021 to 2036 |
| Base Year | 2025 |
| Forecast Period | 2026 to 2036 |
| Units Considered | Value (USD million) |
| Leading Sub-Region | Ontario, British Columbia, Quebec, and online wellness channels |
Canada Private Label Greens Powder Market Outlook
- Canada demand is shaped by natural health product regulation and a consumer base familiar with organic food claims. Smaller brands often compare domestic makers against USA suppliers for price and speed.
- Canadian organic trade bodies publish organic market insight for suppliers, which supports buyer interest in certified wellness products. Contract manufacturers with bilingual label support can reduce launch friction in national retail.
Key Growth Drivers
- Canadian organic market reporting gives brands a clearer view of buyers and certification expectations.
- Cross-border supply lets Canadian brands use USA powder capacity when domestic slots are limited.
- Natural health product rules push brands to use suppliers that understand compliant label wording.
- Online wellness sellers use small-batch launches to test flavor and subscription repeat rates.
Key Restraints
- Natural health product review can slow launches when formulas add too many active claims.
- Imported organic botanicals can create currency risk and higher safety-stock needs.
- Retail buyers may require stronger evidence before accepting new greens SKUs into national chains.
What makes Canada unique
Canada is unique due to natural health product oversight and close supplier links with the United States.
Key Companies
- Factors Group of Nutritional Companies Inc.
- Viva Pharmaceutical Inc.
- NutraLab Canada Ltd.
- Jamieson Wellness Inc.
- Organika Health Products Inc.
- Sisu Inc.
- Natural Factors Nutritional Products Ltd.
Sales & Marketing Channels
- Natural stores
- Pharmacies
- Direct websites
- Marketplace sellers
- Grocery wellness aisles
- Practitioner channels
Market Taxonomy and Sub-Regions Covered
| Segment | Sub-Segments |
|---|---|
| By Product Type | Organic Multi-Greens · Organic Algae · Organic Grass · Fruit Greens · Single Greens |
| By Buyer Type | DTC Brands · Retail Labels · Fitness Brands · Practitioner Brands · Regional Sellers |
| By Formulation Scope | Custom Blends · Stock Formulas · Probiotic Blends · Protein Greens · Clean Blends |
| By Packaging Format | Tubs · Stick Packs · Pouches · Sachets · Bulk Packs |
| By Sales Channel | E-Commerce Brands · Natural Retail · Mass Retail · Pharmacy Retail · Fitness Retail |
| Key Sub-Regions Covered, Retail and Online Corridors | Ontario · British Columbia · Quebec · Alberta · Manitoba · Saskatchewan |
Frequently Asked Questions
How fast is Canada private label greens powder market growing?
Sales in Canada are forecast to grow at 8.3% CAGR from 2026 to 2036 through certified powder supply and online wellness selling.
Who leads Canada private label greens powder market?
Factors Group of Nutritional Companies Inc., Viva Pharmaceutical Inc., and NutraLab Canada Ltd. compete through local manufacturing access and label support.
What is driving adoption in Canada private label greens powder market?
Organic claim discipline and contract manufacturing access are moving brand owners toward private-label greens powder supply.
Sales Analysis for Private Label Greens Powder Market in Germany
Drugstore private labels and organic store brands center · 2026 to 2036
Country Market Snapshot Table
| Parameter | Value |
|---|---|
| Market Size in 2025 (Value) | USD 111.3 million |
| Market Size in 2026 (Value) | USD 120.0 million |
| Market Forecast in 2036 (Value) | USD 254.3 million |
| CAGR (2026 to 2036) | 7.8% |
| Years Considered | 2021 to 2036 |
| Base Year | 2025 |
| Forecast Period | 2026 to 2036 |
| Units Considered | Value (USD million) |
| Leading Sub-Region | North Rhine-Westphalia, Bavaria, Berlin, and drugstore channels |
Germany Private Label Greens Powder Market Outlook
- Germany demand is shaped by drugstore chains and organic store brands that put price discipline into supplier selection. Private label greens powders must meet certification expectations while staying affordable.
- USDA Foreign Agricultural Service reported in January 2025 that organic store brands helped Germany’s organic recovery. This means suppliers must support private-label economics as much as formula variety.
Key Growth Drivers
- USDA Foreign Agricultural Service reported Germany’s organic recovery was supported by store brands in January 2025.
- Drugstores give private-label wellness products a large retail base when prices remain accessible.
- German ingredient and premix suppliers support documented botanical sourcing for European brand owners.
- Organic food sales recovery gives powder brands a stronger setting for certified daily nutrition products.
Key Restraints
- German buyers can reject formulas when organic documents and contaminant results are not complete.
- Price competition in drugstores can limit margin for complex multi-ingredient blends.
- EU claim rules narrow what brands can say about daily greens benefits on the label.
What makes Germany unique
Germany is unique due to drugstore private labels and strict buyer review of organic documentation.
Key Companies
- SternVitamin GmbH & Co. KG
- Plantafood Medical GmbH
- Anklam Extrakt GmbH
- Kraeuter Mix GmbH
- Finzelberg GmbH & Co. KG
- PlantaCorp GmbH
- Salus Haus GmbH & Co. KG
Sales & Marketing Channels
- Drugstores
- Organic stores
- Online wellness shops
- Pharmacies
- Grocery chains
- Ingredient distributors
Market Taxonomy and Sub-Regions Covered
| Segment | Sub-Segments |
|---|---|
| By Product Type | Organic Multi-Greens · Organic Algae · Organic Grass · Fruit Greens · Single Greens |
| By Buyer Type | DTC Brands · Retail Labels · Fitness Brands · Practitioner Brands · Regional Sellers |
| By Formulation Scope | Custom Blends · Stock Formulas · Probiotic Blends · Protein Greens · Clean Blends |
| By Packaging Format | Tubs · Stick Packs · Pouches · Sachets · Bulk Packs |
| By Sales Channel | E-Commerce Brands · Natural Retail · Mass Retail · Pharmacy Retail · Fitness Retai |
| Key Sub-Regions Covered, Retail and Online Corridors | North Rhine-Westphalia · Bavaria · Baden-Wuerttemberg · Berlin · Hamburg · Hesse |
Frequently Asked Questions
How fast is Germany private label greens powder market growing?
Sales in Germany are forecast to grow at 7.8% CAGR from 2026 to 2036 through certified powder supply and online wellness selling.
Who leads Germany private label greens powder market?
SternVitamin GmbH & Co. KG, Plantafood Medical GmbH, and Anklam Extrakt GmbH compete through local manufacturing access and label support.
What is driving adoption in Germany private label greens powder market?
Organic claim discipline and contract manufacturing access are moving brand owners toward private-label greens powder supply.
Opportunity Analysis for Private Label Greens Powder Market in Japan
Functional food retail and Organic JAS certification center · 2026 to 2036
Country Market Snapshot Table
| Parameter | Value |
|---|---|
| Market Size in 2025 (Value) | USD 88.5 million |
| Market Size in 2026 (Value) | USD 95.0 million |
| Market Forecast in 2036 (Value) | USD 194.0 million |
| CAGR (2026 to 2036) | 7.4% |
| Years Considered | 2021 to 2036 |
| Base Year | 2025 |
| Forecast Period | 2026 to 2036 |
| Units Considered | Value (USD million) |
| Leading Sub-Region | Tokyo, Osaka, Nagoya, and functional food retail |
Japan Private Label Greens Powder Market Outlook
- Japan demand is influenced by functional food habits and cautious organic uptake. Buyers place more weight on taste, serving discipline, and certification fit than on large botanical ingredient lists.
- Organic JAS rules define how organic logos can appear on certified products. This keeps supplier documentation central for private-label brands that want organic claims in Japanese retail.
Key Growth Drivers
- Japan’s Ministry of Agriculture, Forestry and Fisheries states that the Organic JAS logo is limited to certified operators.
- Functional food shoppers understand daily powder routines through aojiru and matcha-based formats.
- Local manufacturers can support fine powder handling and flavor control for smaller serving sizes.
- Premium retail channels create space for certified greens blends with restrained claim language.
Key Restraints
- Organic JAS certification adds documentation work for imported botanical inputs.
- Taste expectations are high, so grassy or bitter blends can lose repeat purchase quickly.
- Japan’s cautious organic uptake can keep growth below South Korea and the United States.
What makes Japan unique
Japan is unique due to aojiru powder familiarity and Organic JAS rules that shape label use.
Key Companies
- API Co. Ltd.
- Sunsho Pharmaceutical Co. Ltd.
- Oryza Oil & Fat Chemical Co. Ltd.
- FANCL Corporation
- AFC-HD AMS Life Science Co. Ltd.
- Asahi Group Foods Ltd.
- Yuwa Co. Ltd.
Sales & Marketing Channels
- Drugstores
- Convenience retail
- Brand websites
- Department stores
- Health food stores
- Subscription sellers
Market Taxonomy and Sub-Regions Covered
| Segment | Sub-Segments |
|---|---|
| By Product Type | Organic Multi-Greens · Organic Algae · Organic Grass · Fruit Greens · Single Greens |
| By Buyer Type | DTC Brands · Retail Labels · Fitness Brands · Practitioner Brands · Regional Sellers |
| By Formulation Scope | Custom Blends · Stock Formulas · Probiotic Blends · Protein Greens · Clean Blends |
| By Packaging Format | Tubs · Stick Packs · Pouches · Sachets · Bulk Packs |
| By Sales Channel | E-Commerce Brands · Natural Retail · Mass Retail · Pharmacy Retail · Fitness Retail |
| Key Sub-Regions Covered, Retail and Online Corridors | Tokyo · Osaka · Yokohama · Nagoya · Fukuoka · Sapporo |
Frequently Asked Questions
How fast is Japan private label greens powder market growing?
Sales in Japan are forecast to grow at 7.4% CAGR from 2026 to 2036 through certified powder supply and online wellness selling.
Who leads Japan private label greens powder market?
API Co. Ltd., Sunsho Pharmaceutical Co. Ltd., and Oryza Oil & Fat Chemical Co. Ltd. compete through local manufacturing access and label support.
What is driving adoption in Japan private label greens powder market?
Organic claim discipline and contract manufacturing access are moving brand owners toward private-label greens powder supply.
Competitive Landscape and Strategic Positioning
- High-capacity supplement plants hold an advantage when brand owners request certified organic handling, powder blending, and pack filling in one project.
- Launch-support manufacturers win early orders by offering lower minimum order quantities, artwork support, flavor guidance, and stock greens formulas.
- Retail label buyers give more weight to audit records and recall controls because a failed private-label launch damages the retailer name directly.
- Smaller suppliers lose larger programs when they cannot document lot traceability, contaminant testing, allergen controls, and label review together.
Competitive positioning is influenced by serving adjacent vitamin and mineral supplement buyers who already expect audited manufacturing files. Key players such as Bactolac, Vitaquest, and Makers Nutrition compete for larger brand owners through powder capacity and quality systems. SMP Nutra, Vox Nutrition, and ParkAcre serve buyers that need ready formulas or lower first-order exposure. The line between private label and contract manufacturing matters because custom formulas create stronger brand separation. Stock formulas remain useful when launch speed matters more than ingredient ownership.
Packaging choice gives suppliers another way to stand out because dietary supplements packaging affects shelf presentation and unit cost at the same time. Suppliers best placed for the next phase are those that combine organic sourcing records with practical brand support. Buyer decisions are moving toward release reliability because claims and recalls can damage a young wellness brand quickly. This favors manufacturers with documented lot control, in-house flavor support, and tested powder handling. Smaller suppliers can still win if they own a clear format strength such as stick packs or stock organic formulas.
Key Companies in the Private Label Greens Powder Market
Competition differs across high-capacity supplement manufacturers, launch-support specialists, and regional private-label suppliers. Country-specific suppliers add local certification knowledge and retail channel familiarity.
- High-Capacity Contract Manufacturers: Bactolac Pharmaceutical Inc., Vitaquest International LLC, and Makers Nutrition LLC compete through powder blending, organic handling, and larger brand programs.
- Launch Support Specialists: SMP Nutra LLC, NutraScience Labs Inc., NutraPak USA LLC, and Vox Nutrition Inc. compete through stock formulas, lower order access, and project coordination.
- Regional Private-Label Suppliers: ParkAcre Enterprises Limited, Supplement Factory Limited, Zeon Lifesciences Limited, and API Co. Ltd. compete through local manufacturing access and country-specific label support.
Competitive Benchmarking: Private Label Greens Powder Market
| Company | Relevance to Market Title | Organic Handling Depth | Powder Format Capability | Low-MOQ Launch Support | Brand Services | Geographic Footprint |
|---|---|---|---|---|---|---|
| Bactolac Pharmaceutical Inc. | Very High | Very Strong | Very Strong | Strong | Strong | United States |
| Vitaquest International LLC | Very High | Very Strong | Very Strong | Medium | Very Strong | United States |
| Makers Nutrition LLC | High | Strong | Strong | Very Strong | Very Strong | United States |
| SMP Nutra LLC | High | Medium | Strong | Very Strong | Strong | United States |
| NutraScience Labs Inc. | High | Medium | Strong | Strong | Very Strong | United States |
| NutraPak USA LLC | Medium | Medium | Strong | Very Strong | Medium | United States |
| Vox Nutrition Inc. | Medium | Medium | Medium | Very Strong | Strong | United States |
| ParkAcre Enterprises Limited | High | Strong | Strong | Medium | Strong | United Kingdom |
| Supplement Factory Limited | Medium | Medium | Medium | Strong | Strong | United Kingdom |
| Zeon Lifesciences Limited | Medium | Medium | Strong | Medium | Medium | India |
Source: Future Market Insights competitive analysis, 2026.
Key Developments in Private Label Greens Powder Market
- In June 2026, Bactolac published guidance on powder clumping and stated that clumping affects mixability, stability and customer experience across supplement powders. The development is relevant for private-label greens powders because retailers and brand owners increasingly evaluate powder-flow control before approving pouch or tub launches.
- In October 2025, SMP Nutra exhibited at SupplySide Global 2025 and promoted its private-label supplement platform. The company highlighted 800+ private-label supplements and custom formulations, low MOQs, short lead times, in-house laboratory testing and FDA-compliant label design support.
Key Players in the Private Label Greens Powder Market
- Bactolac Pharmaceutical Inc.
- Makers Nutrition LLC
- SMP Nutra LLC
- Vitaquest International LLC
- NutraScience Labs Inc.
- NutraPak USA LLC
- Vox Nutrition Inc.
- ParkAcre Enterprises Limited
- Supplement Factory Limited
- Zeon Lifesciences Limited
Private Label Greens Powder Market - Scope & Definition
| Attribute | Detail |
|---|---|
| Market Definition | Contract-manufactured greens powder formulas sold under third-party, retailer-owned, or DTC wellness brands, including stock and custom blends made by external supplement manufacturers |
| Functions Covered | Daily nutrition positioning, plant powder delivery, organic claim support, custom formula production, private label brand launch |
| Applications Covered | Organic multi-greens, algae-led blends, grass powders, fruit greens, probiotic greens, protein greens, tubs, pouches, and stick packs |
| End-Use Industries | Dietary supplements, wellness brands, natural retail, e-commerce nutrition, fitness nutrition, practitioner-led supplements |
| Grades Covered | USDA Organic, EU Organic, Organic JAS, Australian Certified Organic, non-GMO, gluten-free, clean-label blends |
| Inclusions | Contract-manufactured and private-label greens powders sold to DTC brands, retailer labels, fitness brands, practitioner brands, and regional sellers across eligible product types and pack formats |
| Exclusions | Branded greens powders manufactured and sold by the same owner without private label involvement, single-ingredient culinary powders without wellness positioning, finished beverages, capsules, tablets, and frozen desserts |
Private Label Greens Powder Market - Research Methodology
| Method | Description |
|---|---|
| Primary Research | FMI analyst interviews with contract manufacturers, private-label supplement suppliers, organic ingredient distributors, brand owners, and channel partners across key markets |
| Desk Research | Review of official data from the United States Department of Agriculture, United States Food and Drug Administration, Ministry of Agriculture, Forestry and Fisheries of Japan, organic trade bodies, company capability pages, and FMI category reports |
| Market Sizing & Forecasting | The market size has been estimated using a bottom-up product-boundary approach. Each category has been defined by eligible SKUs, retail and foodservice revenue pools, channel availability, product positioning, and country-level adoption patterns. Standard frozen desserts were excluded unless they clearly matched the category definition, such as low-glycemic positioning, high-protein claims, private label ownership, dairy-plant hybrid formulation, or mini novelty format. |
| Data Validation | Forecast values were cross-verified using organic trade signals, supplement usage data, official certification rules, supplier capability pages, and analog benchmarking against green supplement, superfood powder, and dietary supplement categories |
Private Label Greens Powder Market - Report Scope
| Item | Value |
|---|---|
| Market size by 2036 | USD 2.7 billion |
| Growth rate | 8.6% CAGR from 2026 to 2036 |
| Forecast period | 2026 to 2036 |
| Base year value (2025) | USD 1.1 billion |
| By product type | Organic multi-greens, organic algae, organic grass, fruit greens, single greens |
| By buyer type | DTC brands, retail labels, fitness brands, practitioner brands, regional sellers |
| By formulation scope | Custom blends, stock formulas, probiotic blends, protein greens, clean blends |
| By packaging format | Tubs, stick packs, pouches, sachets, bulk packs |
| By sales channel | E-commerce brands, natural retail, mass retail, pharmacy retail, fitness retail |
| Regions covered | North America, Latin America, Europe, East Asia, South Asia and Pacific, Middle East and Africa |
| Countries covered | South Korea, United States, United Kingdom, Australia, Canada, Germany, Japan |
| Key companies profiled | Bactolac, Makers Nutrition, SMP Nutra, Vitaquest, NutraScience Labs, NutraPak USA, Vox Nutrition, ParkAcre |
| Approach | Bottom-up product-boundary approach using eligible SKU revenue, supplier capability, channel presence, certification status, and country-level adoption |
Source: Future Market Insights, 2026.
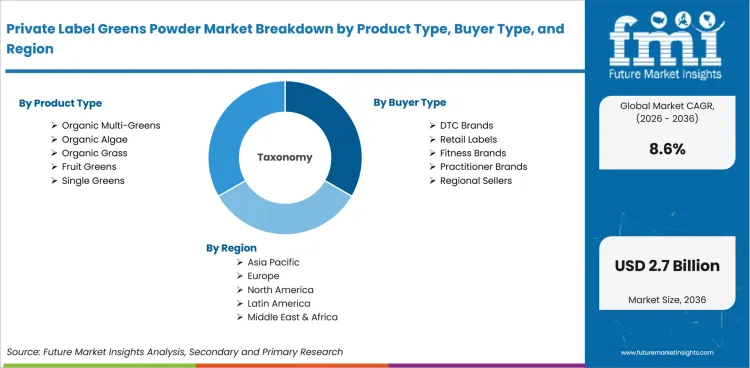
Private Label Greens Powder Market Breakdown by Product Type, Buyer Type, Formulation Scope, Packaging Format, Sales Channel, and Region
Private Label Greens Powder Market Segmented by Product Type
- Organic Multi-Greens
- Organic Algae
- Organic Grass
- Fruit Greens
- Single Greens
Private Label Greens Powder Market Segmented by Buyer Type
- DTC Brands
- Retail Labels
- Fitness Brands
- Practitioner Brands
- Regional Sellers
Private Label Greens Powder Market Segmented by Formulation Scope
- Custom Blends
- Stock Formulas
- Probiotic Blends
- Protein Greens
- Clean Blends
Private Label Greens Powder Market Segmented by Packaging Format
- Tubs
- Stick Packs
- Pouches
- Sachets
- Bulk Packs
Private Label Greens Powder Market Segmented by Sales Channel
- E-Commerce Brands
- Natural Retail
- Mass Retail
- Pharmacy Retail
- Fitness Retail
Private Label Greens Powder Market by Region
- North America
- United States
- Canada
- Mexico
- Latin America
- Brazil
- Chile
- Rest of Latin America
- Western Europe
- Germany
- UK
- Italy
- Spain
- France
- Nordic
- BENELUX
- Rest of Western Europe
- Eastern Europe
- Russia
- Poland
- Hungary
- Balkan and Baltic
- Rest of Eastern Europe
- East Asia
- China
- Japan
- South Korea
- South Asia and Pacific
- India
- Australia and New Zealand
- ASEAN
- Rest of South Asia and Pacific
- Middle East and Africa
- GCC
- Saudi Arabia
- South Africa
- Turkey
- Rest of Middle East and Africa
Research Sources and Bibliography
- United States Department of Agriculture Economic Research Service. (2025, March 19). Organic food import values have increased to USD 5.7 billion. USDA Economic Research Service.
- United States Department of Agriculture Agricultural Marketing Service. (2025, September). Strengthening Organic Enforcement frequently asked questions. USDA Agricultural Marketing Service.
- United States Food and Drug Administration. (2024, April 24). Current good manufacturing practices for food and dietary supplements. USA Food and Drug Administration.
- Electronic Code of Federal Regulations. (2026, June). 21 CFR Part 111 - Current good manufacturing practice in manufacturing, packaging, labeling, or holding operations for dietary supplements. USA Government Publishing Office.
- Council for Responsible Nutrition. (2024, October 29). CRN survey shows consistent supplement usage with increased specialty product use over time. Council for Responsible Nutrition.
- National Center for Health Statistics. (2026, May). Dietary supplement use: United States, August 2021-August 2023. Centers for Disease Control and Prevention.
- Organic Trade Association. (2026, March 4). USA organic marketplace achieved significant growth in 2025. Organic Trade Association.
- Soil Association Certification. (2026, March). Organic Market Report 2026. Soil Association Certification.
- United States Department of Agriculture Foreign Agricultural Service. (2025, January 22). Organic store brands drive recovery of German organic market. USDA Foreign Agricultural Service.
- Ministry of Agriculture, Forestry and Fisheries of Japan. (2025, April). Organic JAS. Ministry of Agriculture, Forestry and Fisheries.
- Australian Organic Limited. (2025, February). Grow like the future depends on it. Australian Organic Limited.
- FiBL and IFOAM Organics International. (2025, February). The world of organic agriculture: Statistics and emerging trends 2025. Research Institute of Organic Agriculture.
- Bactolac Pharmaceutical Inc. (2026). Green food powder wholesale supplier. Bactolac Pharmaceutical Inc.
- Makers Nutrition LLC. (2024, March 13). The benefits of private label manufacturing green superfood supplements. Makers Nutrition LLC.
- SMP Nutra LLC. (2026). Green super food powder private label supplement. SMP Nutra LLC.
- Vitaquest International LLC. (2025, January 27). Contract manufacturing vs. private label for supplements. Vitaquest International LLC.
- Glanbia plc. (2024, June 13). Insights: Trending supplements 2024. Glanbia plc.
- Zeon Lifesciences Limited. (2025, May 31). How private labelling is accelerating innovation in nutraceutical startups. Zeon Lifesciences Limited.
- ParkAcre Enterprises Limited. (2026). Private label greens powder. ParkAcre Enterprises Limited.
This bibliography is provided for reader reference and is not exhaustive. The full report contains the complete reference list and detailed citations.
This Report Answers
- What is the 2026 value and 2036 forecast for private label greens powder market?
- What sales channel is projected to hold the leading share during the forecast period?
- What formulation scope is expected to account for the leading 2026 share?
- How do organic certification and contract manufacturing affect supplier selection?
- What companies compete in private label greens powder manufacturing?
Frequently Asked Questions
What is the private label greens powder market size in 2026?
The private label greens powder market size is estimated at USD 1.2 billion in 2026 based on contract-manufactured greens powder revenue.
What is the private label greens powder market forecast for 2036?
The private label greens powder industry revenue is projected to reach USD 2.7 billion by 2036 as DTC brands and retailer labels expand organic powder lines.
What is the private label greens powder market CAGR?
The private label greens powder sector is projected to expand at 8.6% CAGR from 2026 to 2036.
What segment leads the private label greens powder market?
E-commerce brands are likely to capture 51.3% share in 2026 due to subscription selling and direct-response product launches.
What country grows fastest in the private label greens powder market?
South Korea is projected to record 10.2% CAGR by 2036, driven by beauty-wellness brands and online supplement channels.
Preview the report firsthand - request a free sample
Get SampleGet the brochure for pricing and purchase details.
Get PDFTable of Content
- Executive Summary
- Global Market Outlook
- Demand to side Trends
- Supply to side Trends
- Technology Roadmap Analysis
- Analysis and Recommendations
- Market Overview
- Market Coverage / Taxonomy
- Market Definition / Scope / Limitations
- Research Methodology
- Chapter Orientation
- Analytical Lens and Working Hypotheses
- Market Structure, Signals, and Trend Drivers
- Benchmarking and Cross-market Comparability
- Market Sizing, Forecasting, and Opportunity Mapping
- Research Design and Evidence Framework
- Desk Research Programme (Secondary Evidence)
- Company Annual and Sustainability Reports
- Peer-reviewed Journals and Academic Literature
- Corporate Websites, Product Literature, and Technical Notes
- Earnings Decks and Investor Briefings
- Statutory Filings and Regulatory Disclosures
- Technical White Papers and Standards Notes
- Trade Journals, Industry Magazines, and Analyst Briefs
- Conference Proceedings, Webinars, and Seminar Materials
- Government Statistics Portals and Public Data Releases
- Press Releases and Reputable Media Coverage
- Specialist Newsletters and Curated Briefings
- Sector Databases and Reference Repositories
- FMI Internal Proprietary Databases and Historical Market Datasets
- Subscription Datasets and Paid Sources
- Social Channels, Communities, and Digital Listening Inputs
- Additional Desk Sources
- Expert Input and Fieldwork (Primary Evidence)
- Primary Modes
- Qualitative Interviews and Expert Elicitation
- Quantitative Surveys and Structured Data Capture
- Blended Approach
- Why Primary Evidence is Used
- Field Techniques
- Interviews
- Surveys
- Focus Groups
- Observational and In-context Research
- Social and Community Interactions
- Stakeholder Universe Engaged
- C-suite Leaders
- Board Members
- Presidents and Vice Presidents
- R&D and Innovation Heads
- Technical Specialists
- Domain Subject-matter Experts
- Scientists
- Physicians and Other Healthcare Professionals
- Governance, Ethics, and Data Stewardship
- Research Ethics
- Data Integrity and Handling
- Primary Modes
- Tooling, Models, and Reference Databases
- Desk Research Programme (Secondary Evidence)
- Data Engineering and Model Build
- Data Acquisition and Ingestion
- Cleaning, Normalisation, and Verification
- Synthesis, Triangulation, and Analysis
- Quality Assurance and Audit Trail
- Market Background
- Market Dynamics
- Drivers
- Restraints
- Opportunity
- Trends
- Scenario Forecast
- Demand in Optimistic Scenario
- Demand in Likely Scenario
- Demand in Conservative Scenario
- Opportunity Map Analysis
- Product Life Cycle Analysis
- Supply Chain Analysis
- Investment Feasibility Matrix
- Value Chain Analysis
- PESTLE and Porter’s Analysis
- Regulatory Landscape
- Regional Parent Market Outlook
- Production and Consumption Statistics
- Import and Export Statistics
- Market Dynamics
- Global Market Analysis 2021 to 2025 and Forecast, 2026 to 2036
- Historical Market Size Value (USD Million) Analysis, 2021 to 2025
- Current and Future Market Size Value (USD Million) Projections, 2026 to 2036
- Y to o to Y Growth Trend Analysis
- Absolute $ Opportunity Analysis
- Global Market Pricing Analysis 2021 to 2025 and Forecast 2026 to 2036
- Global Market Analysis 2021 to 2025 and Forecast 2026 to 2036, By Pet Type
- Introduction / Key Findings
- Historical Market Size Value (USD Million) Analysis By Pet Type , 2021 to 2025
- Current and Future Market Size Value (USD Million) Analysis and Forecast By Pet Type , 2026 to 2036
- Dogs
- Cats
- Horses
- Small Mammals
- Other Pets
- Dogs
- Y to o to Y Growth Trend Analysis By Pet Type , 2021 to 2025
- Absolute $ Opportunity Analysis By Pet Type , 2026 to 2036
- Global Market Analysis 2021 to 2025 and Forecast 2026 to 2036, By Product Format
- Introduction / Key Findings
- Historical Market Size Value (USD Million) Analysis By Product Format, 2021 to 2025
- Current and Future Market Size Value (USD Million) Analysis and Forecast By Product Format, 2026 to 2036
- Soft Chews
- Powders
- Liquids
- Capsules and Tablets
- Functional Treats
- Soft Chews
- Y to o to Y Growth Trend Analysis By Product Format, 2021 to 2025
- Absolute $ Opportunity Analysis By Product Format, 2026 to 2036
- Global Market Analysis 2021 to 2025 and Forecast 2026 to 2036, By Supplier Model
- Introduction / Key Findings
- Historical Market Size Value (USD Million) Analysis By Supplier Model, 2021 to 2025
- Current and Future Market Size Value (USD Million) Analysis and Forecast By Supplier Model, 2026 to 2036
- Turnkey Private Label
- Custom Formulation
- Co-Packing
- Contract Manufacturing
- Finished Goods Sourcing
- Turnkey Private Label
- Y to o to Y Growth Trend Analysis By Supplier Model, 2021 to 2025
- Absolute $ Opportunity Analysis By Supplier Model, 2026 to 2036
- Global Market Analysis 2021 to 2025 and Forecast 2026 to 2036, By Sales Channel
- Introduction / Key Findings
- Historical Market Size Value (USD Million) Analysis By Sales Channel, 2021 to 2025
- Current and Future Market Size Value (USD Million) Analysis and Forecast By Sales Channel, 2026 to 2036
- Online Pet Retailers
- Pet Specialty Stores
- Veterinary Clinics
- Mass Retail
- Direct Subscriptions
- Online Pet Retailers
- Y to o to Y Growth Trend Analysis By Sales Channel, 2021 to 2025
- Absolute $ Opportunity Analysis By Sales Channel, 2026 to 2036
- Global Market Analysis 2021 to 2025 and Forecast 2026 to 2036, By Claim Focus
- Introduction / Key Findings
- Historical Market Size Value (USD Million) Analysis By Claim Focus, 2021 to 2025
- Current and Future Market Size Value (USD Million) Analysis and Forecast By Claim Focus, 2026 to 2036
- Joint Mobility Support
- Skin and Coat Support
- Digestive Support
- Calming and Cognitive Support
- Immune Support
- Dental Support
- Senior Wellness
- Joint Mobility Support
- Y to o to Y Growth Trend Analysis By Claim Focus, 2021 to 2025
- Absolute $ Opportunity Analysis By Claim Focus, 2026 to 2036
- Global Market Analysis 2021 to 2025 and Forecast 2026 to 2036, By Ingredient Base
- Introduction / Key Findings
- Historical Market Size Value (USD Million) Analysis By Ingredient Base, 2021 to 2025
- Current and Future Market Size Value (USD Million) Analysis and Forecast By Ingredient Base, 2026 to 2036
- Multivitamin and Mineral Blends
- Probiotics and Prebiotics
- Omega Oils
- Collagen and Mobility Actives
- Botanicals
- Mixed Functional Blends
- Multivitamin and Mineral Blends
- Y to o to Y Growth Trend Analysis By Ingredient Base, 2021 to 2025
- Absolute $ Opportunity Analysis By Ingredient Base, 2026 to 2036
- Global Market Analysis 2021 to 2025 and Forecast 2026 to 2036, By Region
- Introduction
- Historical Market Size Value (USD Million) Analysis By Region, 2021 to 2025
- Current Market Size Value (USD Million) Analysis and Forecast By Region, 2026 to 2036
- North America
- Latin America
- Western Europe
- Eastern Europe
- East Asia
- South Asia and Pacific
- Middle East & Africa
- Market Attractiveness Analysis By Region
- North America Market Analysis 2021 to 2025 and Forecast 2026 to 2036, By Country
- Historical Market Size Value (USD Million) Trend Analysis By Market Taxonomy, 2021 to 2025
- Market Size Value (USD Million) Forecast By Market Taxonomy, 2026 to 2036
- By Country
- USA
- Canada
- Mexico
- By Pet Type
- By Product Format
- By Supplier Model
- By Sales Channel
- By Claim Focus
- By Ingredient Base
- By Country
- Market Attractiveness Analysis
- By Country
- By Pet Type
- By Product Format
- By Supplier Model
- By Sales Channel
- By Claim Focus
- By Ingredient Base
- Key Takeaways
- Latin America Market Analysis 2021 to 2025 and Forecast 2026 to 2036, By Country
- Historical Market Size Value (USD Million) Trend Analysis By Market Taxonomy, 2021 to 2025
- Market Size Value (USD Million) Forecast By Market Taxonomy, 2026 to 2036
- By Country
- Brazil
- Chile
- Rest of Latin America
- By Pet Type
- By Product Format
- By Supplier Model
- By Sales Channel
- By Claim Focus
- By Ingredient Base
- By Country
- Market Attractiveness Analysis
- By Country
- By Pet Type
- By Product Format
- By Supplier Model
- By Sales Channel
- By Claim Focus
- By Ingredient Base
- Key Takeaways
- Western Europe Market Analysis 2021 to 2025 and Forecast 2026 to 2036, By Country
- Historical Market Size Value (USD Million) Trend Analysis By Market Taxonomy, 2021 to 2025
- Market Size Value (USD Million) Forecast By Market Taxonomy, 2026 to 2036
- By Country
- Germany
- UK
- Italy
- Spain
- France
- Nordic
- BENELUX
- Rest of Western Europe
- By Pet Type
- By Product Format
- By Supplier Model
- By Sales Channel
- By Claim Focus
- By Ingredient Base
- By Country
- Market Attractiveness Analysis
- By Country
- By Pet Type
- By Product Format
- By Supplier Model
- By Sales Channel
- By Claim Focus
- By Ingredient Base
- Key Takeaways
- Eastern Europe Market Analysis 2021 to 2025 and Forecast 2026 to 2036, By Country
- Historical Market Size Value (USD Million) Trend Analysis By Market Taxonomy, 2021 to 2025
- Market Size Value (USD Million) Forecast By Market Taxonomy, 2026 to 2036
- By Country
- Russia
- Poland
- Hungary
- Balkan & Baltic
- Rest of Eastern Europe
- By Pet Type
- By Product Format
- By Supplier Model
- By Sales Channel
- By Claim Focus
- By Ingredient Base
- By Country
- Market Attractiveness Analysis
- By Country
- By Pet Type
- By Product Format
- By Supplier Model
- By Sales Channel
- By Claim Focus
- By Ingredient Base
- Key Takeaways
- East Asia Market Analysis 2021 to 2025 and Forecast 2026 to 2036, By Country
- Historical Market Size Value (USD Million) Trend Analysis By Market Taxonomy, 2021 to 2025
- Market Size Value (USD Million) Forecast By Market Taxonomy, 2026 to 2036
- By Country
- China
- Japan
- South Korea
- By Pet Type
- By Product Format
- By Supplier Model
- By Sales Channel
- By Claim Focus
- By Ingredient Base
- By Country
- Market Attractiveness Analysis
- By Country
- By Pet Type
- By Product Format
- By Supplier Model
- By Sales Channel
- By Claim Focus
- By Ingredient Base
- Key Takeaways
- South Asia and Pacific Market Analysis 2021 to 2025 and Forecast 2026 to 2036, By Country
- Historical Market Size Value (USD Million) Trend Analysis By Market Taxonomy, 2021 to 2025
- Market Size Value (USD Million) Forecast By Market Taxonomy, 2026 to 2036
- By Country
- India
- ASEAN
- Australia & New Zealand
- Rest of South Asia and Pacific
- By Pet Type
- By Product Format
- By Supplier Model
- By Sales Channel
- By Claim Focus
- By Ingredient Base
- By Country
- Market Attractiveness Analysis
- By Country
- By Pet Type
- By Product Format
- By Supplier Model
- By Sales Channel
- By Claim Focus
- By Ingredient Base
- Key Takeaways
- Middle East & Africa Market Analysis 2021 to 2025 and Forecast 2026 to 2036, By Country
- Historical Market Size Value (USD Million) Trend Analysis By Market Taxonomy, 2021 to 2025
- Market Size Value (USD Million) Forecast By Market Taxonomy, 2026 to 2036
- By Country
- Kingdom of Saudi Arabia
- Other GCC Countries
- Turkiye
- South Africa
- Other African Union
- Rest of Middle East & Africa
- By Pet Type
- By Product Format
- By Supplier Model
- By Sales Channel
- By Claim Focus
- By Ingredient Base
- By Country
- Market Attractiveness Analysis
- By Country
- By Pet Type
- By Product Format
- By Supplier Model
- By Sales Channel
- By Claim Focus
- By Ingredient Base
- Key Takeaways
- Key Countries Market Analysis
- USA
- Pricing Analysis
- Market Share Analysis, 2025
- By Pet Type
- By Product Format
- By Supplier Model
- By Sales Channel
- By Claim Focus
- By Ingredient Base
- Canada
- Pricing Analysis
- Market Share Analysis, 2025
- By Pet Type
- By Product Format
- By Supplier Model
- By Sales Channel
- By Claim Focus
- By Ingredient Base
- Mexico
- Pricing Analysis
- Market Share Analysis, 2025
- By Pet Type
- By Product Format
- By Supplier Model
- By Sales Channel
- By Claim Focus
- By Ingredient Base
- Brazil
- Pricing Analysis
- Market Share Analysis, 2025
- By Pet Type
- By Product Format
- By Supplier Model
- By Sales Channel
- By Claim Focus
- By Ingredient Base
- Chile
- Pricing Analysis
- Market Share Analysis, 2025
- By Pet Type
- By Product Format
- By Supplier Model
- By Sales Channel
- By Claim Focus
- By Ingredient Base
- Germany
- Pricing Analysis
- Market Share Analysis, 2025
- By Pet Type
- By Product Format
- By Supplier Model
- By Sales Channel
- By Claim Focus
- By Ingredient Base
- UK
- Pricing Analysis
- Market Share Analysis, 2025
- By Pet Type
- By Product Format
- By Supplier Model
- By Sales Channel
- By Claim Focus
- By Ingredient Base
- Italy
- Pricing Analysis
- Market Share Analysis, 2025
- By Pet Type
- By Product Format
- By Supplier Model
- By Sales Channel
- By Claim Focus
- By Ingredient Base
- Spain
- Pricing Analysis
- Market Share Analysis, 2025
- By Pet Type
- By Product Format
- By Supplier Model
- By Sales Channel
- By Claim Focus
- By Ingredient Base
- France
- Pricing Analysis
- Market Share Analysis, 2025
- By Pet Type
- By Product Format
- By Supplier Model
- By Sales Channel
- By Claim Focus
- By Ingredient Base
- India
- Pricing Analysis
- Market Share Analysis, 2025
- By Pet Type
- By Product Format
- By Supplier Model
- By Sales Channel
- By Claim Focus
- By Ingredient Base
- ASEAN
- Pricing Analysis
- Market Share Analysis, 2025
- By Pet Type
- By Product Format
- By Supplier Model
- By Sales Channel
- By Claim Focus
- By Ingredient Base
- Australia & New Zealand
- Pricing Analysis
- Market Share Analysis, 2025
- By Pet Type
- By Product Format
- By Supplier Model
- By Sales Channel
- By Claim Focus
- By Ingredient Base
- China
- Pricing Analysis
- Market Share Analysis, 2025
- By Pet Type
- By Product Format
- By Supplier Model
- By Sales Channel
- By Claim Focus
- By Ingredient Base
- Japan
- Pricing Analysis
- Market Share Analysis, 2025
- By Pet Type
- By Product Format
- By Supplier Model
- By Sales Channel
- By Claim Focus
- By Ingredient Base
- South Korea
- Pricing Analysis
- Market Share Analysis, 2025
- By Pet Type
- By Product Format
- By Supplier Model
- By Sales Channel
- By Claim Focus
- By Ingredient Base
- Russia
- Pricing Analysis
- Market Share Analysis, 2025
- By Pet Type
- By Product Format
- By Supplier Model
- By Sales Channel
- By Claim Focus
- By Ingredient Base
- Poland
- Pricing Analysis
- Market Share Analysis, 2025
- By Pet Type
- By Product Format
- By Supplier Model
- By Sales Channel
- By Claim Focus
- By Ingredient Base
- Hungary
- Pricing Analysis
- Market Share Analysis, 2025
- By Pet Type
- By Product Format
- By Supplier Model
- By Sales Channel
- By Claim Focus
- By Ingredient Base
- Kingdom of Saudi Arabia
- Pricing Analysis
- Market Share Analysis, 2025
- By Pet Type
- By Product Format
- By Supplier Model
- By Sales Channel
- By Claim Focus
- By Ingredient Base
- Turkiye
- Pricing Analysis
- Market Share Analysis, 2025
- By Pet Type
- By Product Format
- By Supplier Model
- By Sales Channel
- By Claim Focus
- By Ingredient Base
- South Africa
- Pricing Analysis
- Market Share Analysis, 2025
- By Pet Type
- By Product Format
- By Supplier Model
- By Sales Channel
- By Claim Focus
- By Ingredient Base
- USA
- Market Structure Analysis
- Competition Dashboard
- Competition Benchmarking
- Market Share Analysis of Top Players
- By Regional
- By Pet Type
- By Product Format
- By Supplier Model
- By Sales Channel
- By Claim Focus
- By Ingredient Base
- Competition Analysis
- Competition Deep Dive
- Pet Tech Labs
- Overview
- Product Portfolio
- Profitability by Market Segments (Product/Age /Sales Channel/Region)
- Sales Footprint
- Strategy Overview
- Marketing Strategy
- Product Strategy
- Channel Strategy
- FoodScience
- Bimini Pet Health
- PetDine
- Eagle Labs
- Makers Nutrition
- NutraPak USA
- ADM
- dsm-firmenich
- Balchem Corporation
- Pet Tech Labs
- Competition Deep Dive
- Assumptions & Acronyms Used


