The Rare Inflammatory Disease Treatment Market is estimated to be valued at USD 15.2 billion in 2025 and is projected to reach USD 23.8 billion by 2035, registering a compound annual growth rate (CAGR) of 4.6% over the forecast period.
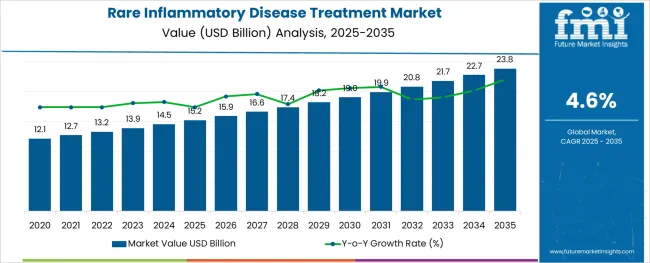
The rare inflammatory disease treatment market is growing steadily, driven by increasing recognition of rare inflammatory conditions and advances in therapeutic options. The rising prevalence of complex diseases such as ulcerative colitis has led to greater demand for specialized treatments that address underlying inflammation. Healthcare providers have prioritized improving patient outcomes through innovative therapies that target specific disease pathways.
Biologics have emerged as a critical treatment class due to their precision and efficacy in managing rare inflammatory diseases. The introduction of injectable formulations has enhanced patient compliance and treatment delivery.
Furthermore, increased investment in research and development, along with enhanced diagnostic capabilities, has expanded treatment accessibility. The market outlook remains positive as new therapies continue to enter clinical practice and healthcare systems emphasize personalized medicine approaches.
The market is segmented by Indication, Drug Class, Mode of Administration, and Distribution Channel and region. By Indication, the market is divided into RID Treatment for Ulcerative Colitis, RID Treatment Juvenile Rheumatoid Arthritis, RID Treatment Psoriatic Arthritis, and RID Treatment Other Indications.
In terms of Drug Class, the market is classified into Biologics-based RID Treatment and Organic Compounds-based RID Treatment. Based on Mode of Administration, the market is segmented into RID Injectables, Oral RID Treatment, and Other RID Treatment Administration Modes.
By Distribution Channel, the market is divided into RID Treatment through Hospital Pharmacies, RID Treatment through Retail Pharmacies, and RID Treatment through Online Pharmacies. Regionally, the market is classified into North America, Latin America, Western Europe, Eastern Europe, Balkan & Baltic Countries, Russia & Belarus, Central Asia, East Asia, South Asia & Pacific, and the Middle East & Africa.
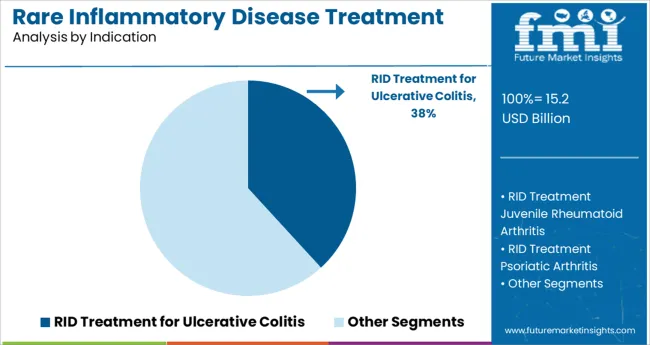
The RID treatment for ulcerative colitis segment is projected to hold 38.2% of the market revenue in 2025, making it the leading indication. Growth in this segment has been driven by the chronic nature and increasing diagnosis rates of ulcerative colitis, a condition that requires sustained management to reduce flare-ups and complications. The complexity of symptoms and the need for long-term control have positioned ulcerative colitis treatments as a key focus in rare inflammatory disease management.
Healthcare providers have adopted a combination of therapeutic strategies to manage inflammation and maintain remission. This has led to increased use of advanced therapies tailored specifically for this indication.
The segment’s prominence is expected to continue as awareness and screening efforts improve.
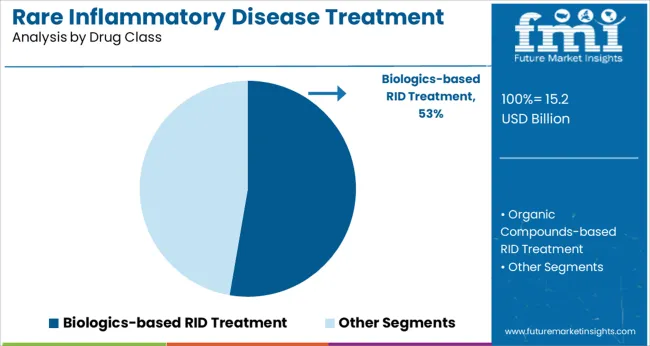
The biologics-based RID treatment segment is forecasted to account for 52.7% of the market revenue in 2025, maintaining its leadership among drug classes. This segment’s expansion has been driven by the high specificity and effectiveness of biologics in targeting inflammatory pathways. Biologics offer advantages in reducing disease activity and improving patient quality of life, especially in refractory cases where conventional therapies fail.
Treatment regimens have increasingly incorporated biologics due to their ability to modulate immune responses with fewer systemic side effects. The development of biosimilars and novel biologic agents has further broadened patient access.
As personalized medicine continues to gain traction, biologics are expected to remain central to rare inflammatory disease treatment strategies.
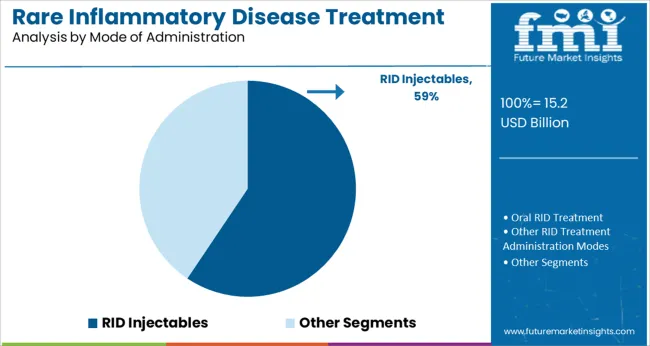
The RID injectables segment is projected to hold 59.4% of the market revenue in 2025, establishing it as the dominant mode of administration. Growth in this segment has been driven by the convenience and efficacy of injectable therapies in delivering targeted treatment with controlled dosing. Injectables enable rapid onset of action and have been preferred in clinical settings for their ability to maintain consistent therapeutic levels.
Patient adherence has benefited from advances in injection device technology and formulations that reduce dosing frequency.
The ability to administer treatment in outpatient or home settings has also contributed to the segment’s expansion. As more injectable biologics enter the market, the RID injectables segment is expected to maintain its strong position.
| Particulars | Details |
|---|---|
| H1, 2024 | 8.35% |
| H1, 2025 Projected | 8.82% |
| H1, 2025 Outlook | 8.52% |
| BPS Change - H1, 2025 (O) - H1, 2025 (P) | (-) 30 ↓ |
| BPS Change - H1, 2025 (O) - H1, 2024 | (+) 17 ↑ |
A comparative analysis related to the market growth rates and development prospects in the global rare inflammatory disease treatment market is presented by Future Market Insights. The market is highly influenced by the onerous regulatory environment and innovation factors for orphan drugs under the impact of macro and industry factors.
According to Future Market Insights analysis, the global rare inflammatory disease treatment market expects to surge by 17 Basis Point Share (BPS) in H1-2025 as compared to H1- 2024. Whereas in comparison to H1-2025 projected value, the market during H1-2025 outlook period will show a dip of 30 BPS.
The market change in the BPS is associated with the extensive process of orphan drug approval by regulatory bodies for licensure and distribution. Further, revision in molecular portfolio for existing products also face a backlash in terms of patent renewal, owed to the emergence of several clinically viable alternatives to existing solutions.
This has caused a reduction in the BPS value. Additionally, the growth of the biopharmaceutical industry upon the advent of the COVID-19 pandemic has provided a boost in the BPS value change for the market.
The market is subject to activities such as supporting the treatment of rare diseases through collaborative activities, revenue fluidity which arises from product Medicaid rebates, chargebacks due to other government programs, and existing patented product portfolio.
From 2013 to 2024, treatment for rare inflammatory diseases experienced an increase of 3.8% in value CAGR terms. Various distribution channels such as hospital pharmacies, retail pharmacies, and online pharmacies have observed high demand for treating several rare inflammatory diseases. Recent outbreaks of infectious diseases, such as COVID-19, have increased market demand to a major extent.
During the height of the pandemic crisis, clinicians, doctors and other healthcare stakeholders extensively relied on anti-inflammatory drugs to ease complications experienced by severely infected and immunocompromised patients. Drugs such as ibuprofen, for instance, was cleared by the National Health Service in the UK to be used as a nonsteroidal anti-inflammatory drug (NSAID) to inhibit receptors responsible for triggering an inflammatory response to the coronavirus.
Companies have been considering in their production processes ways to improve the treatment of rare inflammatory diseases, such as eosinophilic granulomatosis with polyangiitis (EGPA), a rare disorder that causes vasculitis. One such treatment is Nucala, a medication for patients aged 6 years or older with relapsing-remitting or refractory EGPA. Likewise, several orphan drugs are coming into the limelight for numerous rare inflammatory diseases. Overall, demand for rare inflammatory disease treatment is anticipated to rise at a CAGR of around 4.6% through 2035.
Healthcare experts have associated cytokine IL-23 with treatment of inflammatory and autoimmune diseases. Researchers have identified a fundamental molecular mechanism essential to inflammatory and autoimmune diseases such as multiple sclerosis, rheumatoid arthritis and psoriasis. The action of pro-inflammatory cytokine IL-23, depends on the organizational stimulation of its receptor, namely IL-23R.
Moreover, the occurrence of inflammatory and autoimmune diseases is increasing at a rapid pace. According to the World Health Organization, psoriasis affects approximately 100 million people globally, while between 1.3% and 34.7% develop chronic and inflammatory arthritis. Likewise, inflammatory bowel infections such as ulcerative colitis and Crohn’s disease are increasing at an alarming rate in formerly unaffected fragments of the world.
Hence, medical practitioners are introducing several drug candidates to address some of the most debilitating rare inflammatory diseases. In 2020, for instance, the European Medicines Agency's Committee for Medicinal Products for Human Use (CHMP) granted an extension of indication to Kineret (anakinra) for treating Still's disease. Kineret is an immunosuppressive medicine which inhibits chemical messenger activity of interleukin-1, an agent which is produced in excess amongst patients suffering from rheumatoid arthritis and juvenile idiopathic arthritis.
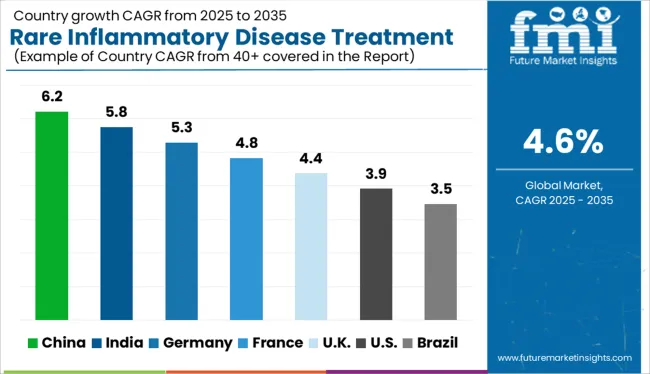
D of new treatments and advancements in medical technology have driven market demand for rare inflammatory disease treatment throughout Europe. With increasing investments in open-source drug delivery systems and evaluations of their effectiveness in treating rare diseases, more treatment options are becoming available for rare inflammatory diseases.
Recently, in September 20245.2, the European Medicines Agency has recommended granting an extension of indication to Nucala (mepolizumab) as an add-on treatment for patients aged 6 years and older with relapsing-remitting or refractory eosinophilic granulomatosis with polyangiitis (EGPA), responsible for inflaming vital organs such as the lungs, heart, skin, nervous system and gastrointestinal tract.
It is estimated that between 0.15.28 and 4 new cases per 15.2 million are diagnosed each year with EGPA. The drug is already approved for treating patients of the same age group for eosinophilic asthma. According to FMI, rare inflammatory disease treatment in Europe is like to accumulate a market share of 24% in 2025.
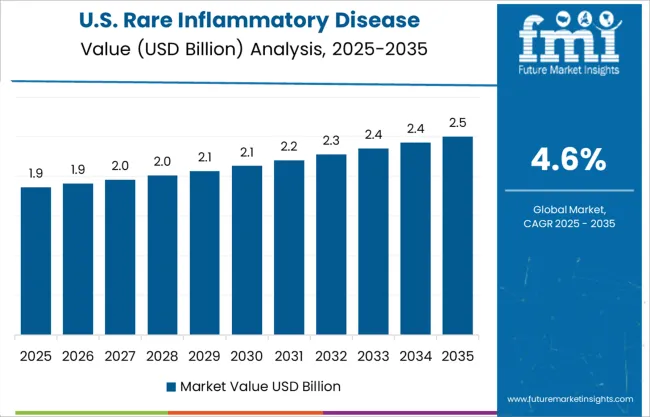
FMI forecasts the rare inflammatory disease treatment industry in North America to accumulate a market share of 39.9% in 2025. The presence of a well-developed health care system and several reimbursement programs aimed at facilitating access to treatment for those with rare illnesses are among the chief growth drivers.
More than 30 million Americans are afflicted with rare diseases. Every year, approximately 6,200 Americans are affected diseases, including Polycythemia Vera, while juvenile rheumatoid arthritis is one of the most common types of arthritic diseases that children are diagnosed with in the United States.
Demand for rare inflammatory disease treatment has risen through various distribution channels including hospital pharmacies, retail pharmacies, and online pharmacies. As a result, the USA is expected to account for the largest market share in the market for rare inflammatory diseases treatment.
Due to the significant cost savings associated with ulcerative colitis treatments, the producers will be influenced to increase their manufacturing capacities for advanced drugs and therapies in the future.
Technological advancements and the increasing number of patients suffering from ulcerative colitis have contributed to the development of advanced treatments for ulcerative colitis. The influx of new therapeutics methods, demand for enhancing drugs, and advances in treating ulcerative colitis have propelled market demand for rare inflammatory diseases treatments.
The growing prevalence of diseases and demand for 24/7 medication sales have catalyzed the global market demand for drugs at retail pharmacies. Future growth in artificial intelligence, advanced analytics, and other technologies will help drive the retail pharmacy market in the global market.
Health and wellness services are the key drivers of customer satisfaction at brick-and-mortar pharmacies. These services score 66 points higher than other types of services. Pharmacies with these services are present in 86% of chain pharmacies, 83% of supermarkets, and 75% of mass merchandisers.
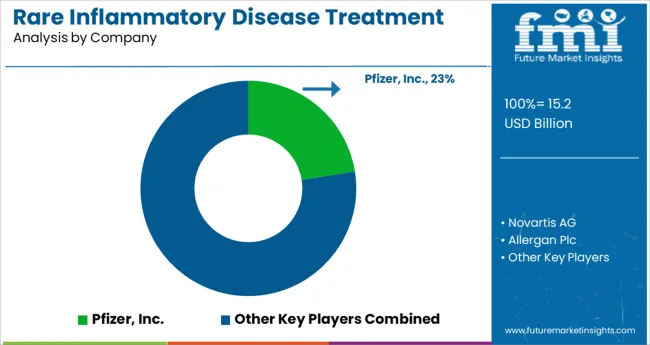
Prominent treatment providers are emphasizing on advancing drug and treatment offerings by initiating a series of clinical studies as well as forging collaborative and acquisition agreements with existing pharmaceutical companies.
| Attribute | Details |
|---|---|
| Forecast Period | 2025 to 2035 |
| Historical Data Available for | 2020 to 2024 |
| Market Analysis | million for Value |
| Key Regions Covered | North America; Latin America; Europe; Asia Pacific; Middle East & Africa (MEA) |
| Key Countries Covered | USA, Canada, Brazil, Mexico, Germany, UK, France, Spain, Italy, China, Japan, India, Malaysia, Singapore, Australia, New Zealand, Israel, South Africa, GCC |
| Key Market Segments Covered | Indication, Drug Class, Mode of Administration, Distribution Channel |
| Key Companies Profiled | Novartis AG; Abbvie Inc.; Abbott Laboratories; Regeneron Pharmaceuticals Inc.; Swedish Orphan Biovitrum AB; Pfizer, Inc.; Valeant Pharmaceutical International Inc. (Bausch Health); Mallinckrodt Plc.; Johnson & Johnson |
| Pricing | Available upon Request |
The global rare inflammatory disease treatment market is estimated to be valued at USD 15.2 billion in 2025.
It is projected to reach USD 23.8 billion by 2035.
The market is expected to grow at a 4.6% CAGR between 2025 and 2035.
The key product types are rid treatment for ulcerative colitis, rid treatment juvenile rheumatoid arthritis, rid treatment psoriatic arthritis and rid treatment other indications.
biologics-based rid treatment segment is expected to dominate with a 52.7% industry share in 2025.


Full Research Suite comprises of:
Market outlook & trends analysis
Interviews & case studies
Strategic recommendations
Vendor profiles & capabilities analysis
5-year forecasts
8 regions and 60+ country-level data splits
Market segment data splits
12 months of continuous data updates
DELIVERED AS:
PDF EXCEL ONLINE
Rare Gas Market Size and Share Forecast Outlook 2025 to 2035
Rare Sugar Market Size and Share Forecast Outlook 2025 to 2035
Rare NRG1 Fusion Market Size and Share Forecast Outlook 2025 to 2035
Competitive Overview of Rare Earth Elements Companies
Rare Earth Metals Market Demand & Trends 2024-2034
Rare Disease Clinical Trials Market Size and Share Forecast Outlook 2025 to 2035
Rare Disease Gene Therapy Market
Rare Neurological Disease Treatment Market Report – Demand, Growth & Industry Outlook 2025-2035
Industry Share Analysis for Rare Neurological Disease Treatment Providers
Rare Gastrointestinal Diseases Treatment Market Trends and Forecast 2025 to 2035
Infrared Heating Pad Market Size and Share Forecast Outlook 2025 to 2035
Infrared Thermography Market Size and Share Forecast Outlook 2025 to 2035
Infrared Thermometer Market Growth – Trends & Forecast 2025 to 2035
Infrared Search and Track (IRST) Systems Market Analysis - Growth & Forecast 2025 to 2035
Infrared Sensors Market Analysis – Growth & Trends 2025 to 2035
Infrared (IR) LEDs Market by Component by Application & Region Forecast till 2035
Infrared Imaging Market
Mid-infrared Lasers Market Analysis - Growth & Trends 2025 to 2035
Near Infrared Absorbing Material Market Growth – Trends & Forecast 2024-2034
Global Near Infrared Imaging Market Analysis – Size, Trends & Forecast 2024-2034

Thank you!
You will receive an email from our Business Development Manager. Please be sure to check your SPAM/JUNK folder too.
Chat With
MaRIA