Recording Chart Paper Market Size and Share Forecast Outlook 2025 to 2035

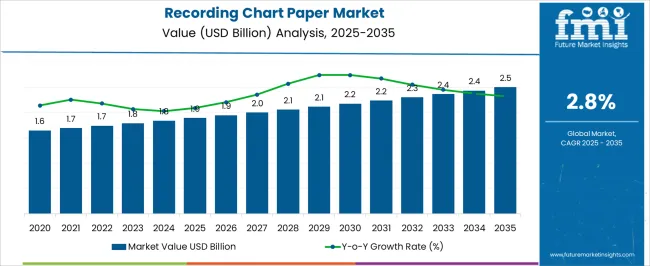
The Recording Chart Paper Market is estimated to be valued at USD 1.9 billion in 2025 and is projected to reach USD 2.5 billion by 2035, registering a compound annual growth rate (CAGR) of 2.8% over the forecast period.
Quick Stats for Recording Chart Paper Market

  • Recording Chart Paper Market Value (2025): USD 1.9 billion
  • Recording Chart Paper Market Forecast Value (2035): USD 2.5 billion
  • Recording Chart Paper Market Forecast CAGR: 2.8%
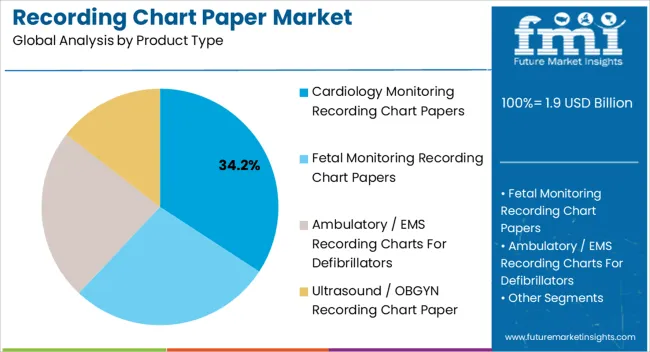
  • Leading Segment in Recording Chart Paper Market in 2025: Cardiology Monitoring Recording Chart Papers (34.2%)
  • Key Growth Regions in Recording Chart Paper Market: North America, Asia-Pacific, Europe
  • Top Key Players in Recording Chart Paper Market: Georgia-Pacific, Mondi Group, Smurfit Kappa Group, Sappi Limited, Fanjin Paper, Mitsubishi Paper Mills, Crown Van Gelder, International Paper, Weyerhaeuser Company, Domtar Corporation, Guanhua Paper Industry, Nippon Paper Industries, Stora Enso

Recording Chart Paper Market Market Value Analysis

Recording Chart Paper Market Key Takeaways

Metric Value
Recording Chart Paper Market Estimated Value in (2025 E) USD 1.9 billion
Recording Chart Paper Market Forecast Value in (2035 F) USD 2.5 billion
Forecast CAGR (2025 to 2035) 2.8%

Why is the Recording Chart Paper Market Growing?

The Recording Chart Paper market is experiencing steady growth, driven by the increasing adoption of monitoring and diagnostic equipment in hospitals, clinics, and specialized healthcare facilities. Rising incidences of cardiovascular and other chronic diseases are fueling demand for high-quality chart papers compatible with electrocardiography and other patient monitoring systems. Technological advancements in monitoring devices and the corresponding need for accurate and reliable chart papers are shaping market dynamics.

The market is further supported by the growing emphasis on patient safety, clinical accuracy, and operational efficiency in healthcare delivery. Investments in modern hospital infrastructure, expansion of healthcare services in emerging economies, and the rising number of hospital beds are contributing to sustained demand.

Chart papers are being increasingly integrated with advanced recording and monitoring systems to provide real-time data for medical analysis and diagnosis As healthcare providers continue to prioritize efficient patient monitoring and data management, the Recording Chart Paper market is expected to maintain long-term growth, supported by innovations in material quality, print clarity, and compatibility with modern medical devices.

Segmental Analysis

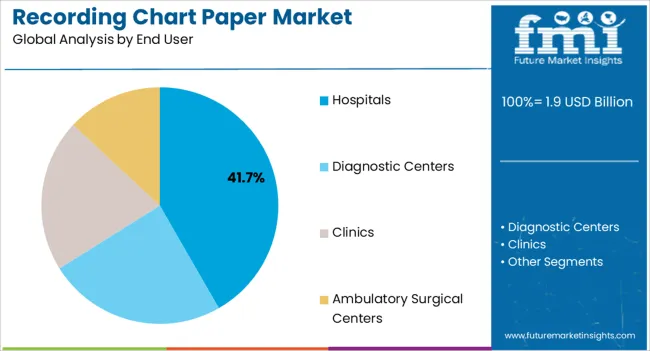
The recording chart paper market is segmented by product type, end user, and geographic regions. By product type, recording chart paper market is divided into Cardiology Monitoring Recording Chart Papers, Fetal Monitoring Recording Chart Papers, Ambulatory / EMS Recording Charts For Defibrillators, and Ultrasound / OBGYN Recording Chart Paper. In terms of end user, recording chart paper market is classified into Hospitals, Diagnostic Centers, Clinics, and Ambulatory Surgical Centers. Regionally, the recording chart paper industry is classified into North America, Latin America, Western Europe, Eastern Europe, Balkan & Baltic Countries, Russia & Belarus, Central Asia, East Asia, South Asia & Pacific, and the Middle East & Africa.
Insights into the Cardiology Monitoring Recording Chart Papers Product Type Segment

Recording Chart Paper Market Analysis By Product Type

The cardiology monitoring recording chart papers segment is projected to hold 34.2% of the market revenue in 2025, establishing it as the leading product type. Its dominance is driven by the widespread use of electrocardiography and cardiac monitoring equipment, which require precise and high-quality chart papers to ensure accurate recording of patient data. The segment benefits from improved paper formulations that enhance print clarity, reduce smudging, and maintain consistency during high-speed recording.

Hospitals and diagnostic centers increasingly rely on these chart papers for continuous monitoring of patients with cardiac conditions, enabling timely diagnosis and intervention. Compatibility with advanced monitoring devices and adherence to medical standards further support adoption.

The segment’s growth is reinforced by the global increase in cardiovascular disease prevalence and rising awareness regarding early diagnosis and preventive care As healthcare facilities continue to expand and upgrade monitoring infrastructure, cardiology monitoring recording chart papers are expected to maintain their market leadership, driven by performance reliability, precision, and integration with modern monitoring systems.
Insights into the Hospitals End User Segment

Recording Chart Paper Market Analysis By End User

The hospitals end user segment is expected to account for 41.7% of the market revenue in 2025, making it the leading end-use category. Growth is being driven by the increasing number of hospital facilities and beds globally, coupled with the rising need for continuous patient monitoring and accurate medical data recording. Hospitals are major adopters of recording chart papers due to their critical role in cardiology, intensive care, and general patient monitoring applications.

The use of high-quality chart papers ensures precise recording of physiological parameters, supports clinical decision-making, and enhances patient safety. Investments in advanced monitoring equipment, adherence to regulatory standards, and integration with digital health management systems are further promoting demand.

The segment also benefits from the expansion of hospital infrastructure in emerging markets and modernization of healthcare systems in developed regions As patient monitoring requirements grow and hospitals focus on operational efficiency, the adoption of recording chart papers in hospital settings is expected to remain the primary growth driver, sustaining its leading revenue share in the market.

Market Overview

Recording Chart Paper Market Overview

Recording chart paper is a thermal coated special paper used in diagnosis of various healthcare diagnostic procedures with equipment such as ECG monitoring, fetal monitoring, and video image printers. Recording chart paper is precisely designed to generate accurate, clear tracings and clearly defined alphanumeric characters.

Recording charts papers are used in recording instrument of the diagnostic field, medical, and laboratory analysis. Recording chart paper comes in either Z-folded or rolled formats. These recording chart papers are used for recording of intrapartum and antepartum monitoring. Recording chart paper offers benefits such as easy to read grids with extended timelines at one minute intervals.

Recording chart papers are an essential part of the cardiac diagnostics process. Recording chart papers with easy grids and which are compatible with the medical devices will help detect problems faster. Recording chart papers play a crucial role due to printout durability which is readily understandable in diagnostic tools and high-tech medicine. Static sensitivity is the temperature at which the recording paper begins to generate an image. Dynamic and static sensitivity property of recording chart paper makes them efficient for use along with different diagnostic equipment.
Analysis of Recording Chart Paper Market By Key Countries

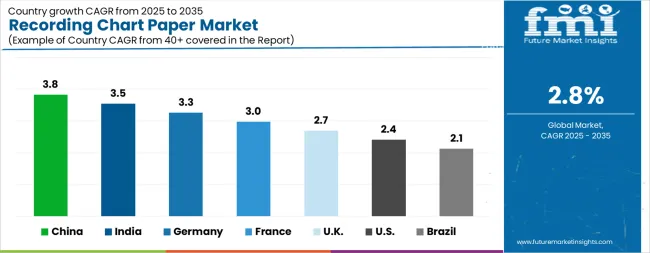
Recording Chart Paper Market Cagr Analysis By Country

Country CAGR
China 3.8%
India 3.5%
Germany 3.3%
France 3.0%
UK 2.7%
USA 2.4%
Brazil 2.1%

Country-wise Analysis

The Recording Chart Paper Market is expected to register a CAGR of 2.8% during the forecast period, exhibiting varied country level momentum. China leads with the highest CAGR of 3.8%, followed by India at 3.5%. Developed markets such as Germany, France, and the UK continue to expand steadily, while the USA is likely to grow at consistent rates. Brazil posts the lowest CAGR at 2.1%, yet still underscores a broadly positive trajectory for the global Recording Chart Paper Market. In 2024, Germany held a dominant revenue in the Western Europe market and is expected to grow with a CAGR of 3.3%. The USA Recording Chart Paper Market is estimated to be valued at USD 675.1 million in 2025 and is anticipated to reach a valuation of USD 856.3 million by 2035. Sales are projected to rise at a CAGR of 2.4% over the forecast period between 2025 and 2035. While Japan and South Korea markets are estimated to be valued at USD 92.8 million and USD 61.5 million respectively in 2025.
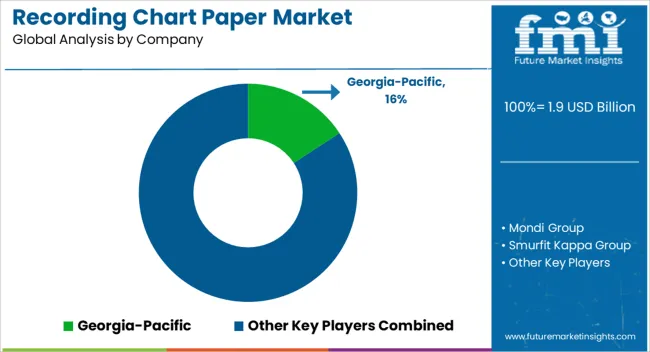
Key Players in the Recording Chart Paper Market

Recording Chart Paper Market Analysis By Company

  • Georgia-Pacific
  • Mondi Group
  • Smurfit Kappa Group
  • Sappi Limited
  • Fanjin Paper
  • Mitsubishi Paper Mills
  • Crown Van Gelder
  • International Paper
  • Weyerhaeuser Company
  • Domtar Corporation
  • Guanhua Paper Industry
  • Nippon Paper Industries
  • Stora Enso

Scope of the Report

Item Value
Quantitative Units USD 1.9 Billion
Product Type Cardiology Monitoring Recording Chart Papers, Fetal Monitoring Recording Chart Papers, Ambulatory / EMS Recording Charts For Defibrillators, and Ultrasound / OBGYN Recording Chart Paper
End User Hospitals, Diagnostic Centers, Clinics, and Ambulatory Surgical Centers
Regions Covered North America, Europe, Asia-Pacific, Latin America, Middle East & Africa
Country Covered United States, Canada, Germany, France, United Kingdom, China, Japan, India, Brazil, South Africa
Key Companies Profiled Georgia-Pacific, Mondi Group, Smurfit Kappa Group, Sappi Limited, Fanjin Paper, Mitsubishi Paper Mills, Crown Van Gelder, International Paper, Weyerhaeuser Company, Domtar Corporation, Guanhua Paper Industry, Nippon Paper Industries, and Stora Enso

Recording Chart Paper Market by Segments

Product Type:

  • Cardiology Monitoring Recording Chart Papers
  • Fetal Monitoring Recording Chart Papers
  • Ambulatory / EMS Recording Charts For Defibrillators
  • Ultrasound / OBGYN Recording Chart Paper

End User:

  • Hospitals
  • Diagnostic Centers
  • Clinics
  • Ambulatory Surgical Centers

Region:

  • North America
    • USA
    • Canada
    • Mexico
  • Latin America
    • Brazil
    • Chile
    • Rest of Latin America
  • Western Europe
    • Germany
    • UK
    • Italy
    • Spain
    • France
    • Nordic
    • BENELUX
    • Rest of Western Europe
  • Eastern Europe
    • Russia
    • Poland
    • Hungary
    • Balkan & Baltic
    • Rest of Eastern Europe
  • East Asia
    • China
    • Japan
    • South Korea
  • South Asia and Pacific
    • India
    • ASEAN
    • Australia & New Zealand
    • Rest of South Asia and Pacific
  • Middle East & Africa
    • Kingdom of Saudi Arabia
    • Other GCC Countries
    • Turkiye
    • South Africa
    • Other African Union
    • Rest of Middle East & Africa

Frequently Asked Questions

How big is the recording chart paper market in 2025?

The global recording chart paper market is estimated to be valued at USD 1.9 billion in 2025.

What will be the size of recording chart paper market in 2035?

The market size for the recording chart paper market is projected to reach USD 2.5 billion by 2035.

How much will be the recording chart paper market growth between 2025 and 2035?

The recording chart paper market is expected to grow at a 2.8% CAGR between 2025 and 2035.

What are the key product types in the recording chart paper market?

The key product types in recording chart paper market are cardiology monitoring recording chart papers, fetal monitoring recording chart papers, ambulatory / ems recording charts for defibrillators and ultrasound / obgyn recording chart paper.

Which end user segment to contribute significant share in the recording chart paper market in 2025?

In terms of end user, hospitals segment to command 41.7% share in the recording chart paper market in 2025.

Table of Content

  1. Executive Summary
    • Global Market Outlook
    • Demand-side Trends
    • Supply-side Trends
    • Technology Roadmap Analysis
    • Analysis and Recommendations
  2. Market Overview
    • Market Coverage / Taxonomy
    • Market Definition / Scope / Limitations
  3. Market Background
    • Market Dynamics
      • Drivers
      • Restraints
      • Opportunity
      • Trends
    • Scenario Forecast
      • Demand in Optimistic Scenario
      • Demand in Likely Scenario
      • Demand in Conservative Scenario
    • Opportunity Map Analysis
    • Product Life Cycle Analysis
    • Supply Chain Analysis
    • Investment Feasibility Matrix
    • Value Chain Analysis
    • PESTLE and Porter’s Analysis
    • Regulatory Landscape
    • Regional Parent Market Outlook
    • Production and Consumption Statistics
    • Import and Export Statistics
  4. Global Market Analysis 2020 to 2024 and Forecast, 2025 to 2035
    • Historical Market Size Value (USD Million) Analysis, 2020 to 2024
    • Current and Future Market Size Value (USD Million) Projections, 2025 to 2035
      • Y-o-Y Growth Trend Analysis
      • Absolute $ Opportunity Analysis
  5. Global Market Pricing Analysis 2020 to 2024 and Forecast 2025 to 2035
  6. Global Market Analysis 2020 to 2024 and Forecast 2025 to 2035, By Product Type
    • Introduction / Key Findings
    • Historical Market Size Value (USD Million) Analysis By Product Type , 2020 to 2024
    • Current and Future Market Size Value (USD Million) Analysis and Forecast By Product Type , 2025 to 2035
      • Cardiology Monitoring s
      • Fetal Monitoring s
      • Ambulatory / EMS Recording Charts For Defibrillators
      • Ultrasound / OBGYN
    • Y-o-Y Growth Trend Analysis By Product Type , 2020 to 2024
    • Absolute $ Opportunity Analysis By Product Type , 2025 to 2035
  7. Global Market Analysis 2020 to 2024 and Forecast 2025 to 2035, By End User
    • Introduction / Key Findings
    • Historical Market Size Value (USD Million) Analysis By End User, 2020 to 2024
    • Current and Future Market Size Value (USD Million) Analysis and Forecast By End User, 2025 to 2035
      • Hospitals
      • Diagnostic Centers
      • Clinics
      • Ambulatory Surgical Centers
    • Y-o-Y Growth Trend Analysis By End User, 2020 to 2024
    • Absolute $ Opportunity Analysis By End User, 2025 to 2035
  8. Global Market Analysis 2020 to 2024 and Forecast 2025 to 2035, By Region
    • Introduction
    • Historical Market Size Value (USD Million) Analysis By Region, 2020 to 2024
    • Current Market Size Value (USD Million) Analysis and Forecast By Region, 2025 to 2035
      • North America
      • Latin America
      • Western Europe
      • Eastern Europe
      • East Asia
      • South Asia and Pacific
      • Middle East & Africa
    • Market Attractiveness Analysis By Region
  9. North America Market Analysis 2020 to 2024 and Forecast 2025 to 2035, By Country
    • Historical Market Size Value (USD Million) Trend Analysis By Market Taxonomy, 2020 to 2024
    • Market Size Value (USD Million) Forecast By Market Taxonomy, 2025 to 2035
      • By Country
        • USA
        • Canada
        • Mexico
      • By Product Type
      • By End User
    • Market Attractiveness Analysis
      • By Country
      • By Product Type
      • By End User
    • Key Takeaways
  10. Latin America Market Analysis 2020 to 2024 and Forecast 2025 to 2035, By Country
    • Historical Market Size Value (USD Million) Trend Analysis By Market Taxonomy, 2020 to 2024
    • Market Size Value (USD Million) Forecast By Market Taxonomy, 2025 to 2035
      • By Country
        • Brazil
        • Chile
        • Rest of Latin America
      • By Product Type
      • By End User
    • Market Attractiveness Analysis
      • By Country
      • By Product Type
      • By End User
    • Key Takeaways
  11. Western Europe Market Analysis 2020 to 2024 and Forecast 2025 to 2035, By Country
    • Historical Market Size Value (USD Million) Trend Analysis By Market Taxonomy, 2020 to 2024
    • Market Size Value (USD Million) Forecast By Market Taxonomy, 2025 to 2035
      • By Country
        • Germany
        • UK
        • Italy
        • Spain
        • France
        • Nordic
        • BENELUX
        • Rest of Western Europe
      • By Product Type
      • By End User
    • Market Attractiveness Analysis
      • By Country
      • By Product Type
      • By End User
    • Key Takeaways
  12. Eastern Europe Market Analysis 2020 to 2024 and Forecast 2025 to 2035, By Country
    • Historical Market Size Value (USD Million) Trend Analysis By Market Taxonomy, 2020 to 2024
    • Market Size Value (USD Million) Forecast By Market Taxonomy, 2025 to 2035
      • By Country
        • Russia
        • Poland
        • Hungary
        • Balkan & Baltic
        • Rest of Eastern Europe
      • By Product Type
      • By End User
    • Market Attractiveness Analysis
      • By Country
      • By Product Type
      • By End User
    • Key Takeaways
  13. East Asia Market Analysis 2020 to 2024 and Forecast 2025 to 2035, By Country
    • Historical Market Size Value (USD Million) Trend Analysis By Market Taxonomy, 2020 to 2024
    • Market Size Value (USD Million) Forecast By Market Taxonomy, 2025 to 2035
      • By Country
        • China
        • Japan
        • South Korea
      • By Product Type
      • By End User
    • Market Attractiveness Analysis
      • By Country
      • By Product Type
      • By End User
    • Key Takeaways
  14. South Asia and Pacific Market Analysis 2020 to 2024 and Forecast 2025 to 2035, By Country
    • Historical Market Size Value (USD Million) Trend Analysis By Market Taxonomy, 2020 to 2024
    • Market Size Value (USD Million) Forecast By Market Taxonomy, 2025 to 2035
      • By Country
        • India
        • ASEAN
        • Australia & New Zealand
        • Rest of South Asia and Pacific
      • By Product Type
      • By End User
    • Market Attractiveness Analysis
      • By Country
      • By Product Type
      • By End User
    • Key Takeaways
  15. Middle East & Africa Market Analysis 2020 to 2024 and Forecast 2025 to 2035, By Country
    • Historical Market Size Value (USD Million) Trend Analysis By Market Taxonomy, 2020 to 2024
    • Market Size Value (USD Million) Forecast By Market Taxonomy, 2025 to 2035
      • By Country
        • Kingdom of Saudi Arabia
        • Other GCC Countries
        • Turkiye
        • South Africa
        • Other African Union
        • Rest of Middle East & Africa
      • By Product Type
      • By End User
    • Market Attractiveness Analysis
      • By Country
      • By Product Type
      • By End User
    • Key Takeaways
  16. Key Countries Market Analysis
    • USA
      • Pricing Analysis
      • Market Share Analysis, 2024
        • By Product Type
        • By End User
    • Canada
      • Pricing Analysis
      • Market Share Analysis, 2024
        • By Product Type
        • By End User
    • Mexico
      • Pricing Analysis
      • Market Share Analysis, 2024
        • By Product Type
        • By End User
    • Brazil
      • Pricing Analysis
      • Market Share Analysis, 2024
        • By Product Type
        • By End User
    • Chile
      • Pricing Analysis
      • Market Share Analysis, 2024
        • By Product Type
        • By End User
    • Germany
      • Pricing Analysis
      • Market Share Analysis, 2024
        • By Product Type
        • By End User
    • UK
      • Pricing Analysis
      • Market Share Analysis, 2024
        • By Product Type
        • By End User
    • Italy
      • Pricing Analysis
      • Market Share Analysis, 2024
        • By Product Type
        • By End User
    • Spain
      • Pricing Analysis
      • Market Share Analysis, 2024
        • By Product Type
        • By End User
    • France
      • Pricing Analysis
      • Market Share Analysis, 2024
        • By Product Type
        • By End User
    • India
      • Pricing Analysis
      • Market Share Analysis, 2024
        • By Product Type
        • By End User
    • ASEAN
      • Pricing Analysis
      • Market Share Analysis, 2024
        • By Product Type
        • By End User
    • Australia & New Zealand
      • Pricing Analysis
      • Market Share Analysis, 2024
        • By Product Type
        • By End User
    • China
      • Pricing Analysis
      • Market Share Analysis, 2024
        • By Product Type
        • By End User
    • Japan
      • Pricing Analysis
      • Market Share Analysis, 2024
        • By Product Type
        • By End User
    • South Korea
      • Pricing Analysis
      • Market Share Analysis, 2024
        • By Product Type
        • By End User
    • Russia
      • Pricing Analysis
      • Market Share Analysis, 2024
        • By Product Type
        • By End User
    • Poland
      • Pricing Analysis
      • Market Share Analysis, 2024
        • By Product Type
        • By End User
    • Hungary
      • Pricing Analysis
      • Market Share Analysis, 2024
        • By Product Type
        • By End User
    • Kingdom of Saudi Arabia
      • Pricing Analysis
      • Market Share Analysis, 2024
        • By Product Type
        • By End User
    • Turkiye
      • Pricing Analysis
      • Market Share Analysis, 2024
        • By Product Type
        • By End User
    • South Africa
      • Pricing Analysis
      • Market Share Analysis, 2024
        • By Product Type
        • By End User
  17. Market Structure Analysis
    • Competition Dashboard
    • Competition Benchmarking
    • Market Share Analysis of Top Players
      • By Regional
      • By Product Type
      • By End User
  18. Competition Analysis
    • Competition Deep Dive
      • Georgia-Pacific
        • Overview
        • Product Portfolio
        • Profitability by Market Segments (Product/Age /Sales Channel/Region)
        • Sales Footprint
        • Strategy Overview
          • Marketing Strategy
          • Product Strategy
          • Channel Strategy
      • Mondi Group
      • Smurfit Kappa Group
      • Sappi Limited
      • Fanjin Paper
      • Mitsubishi Paper Mills
      • Crown Van Gelder
      • International Paper
      • Weyerhaeuser Company
      • Domtar Corporation
      • Guanhua Paper Industry
      • Nippon Paper Industries
      • Stora Enso
  19. Assumptions & Acronyms Used
  20. Research Methodology

List of Tables

  • Table 1: Global Market Value (USD Million) Forecast by Region, 2020 to 2035
  • Table 2: Global Market Value (USD Million) Forecast by Product Type , 2020 to 2035
  • Table 3: Global Market Value (USD Million) Forecast by End User, 2020 to 2035
  • Table 4: North America Market Value (USD Million) Forecast by Country, 2020 to 2035
  • Table 5: North America Market Value (USD Million) Forecast by Product Type , 2020 to 2035
  • Table 6: North America Market Value (USD Million) Forecast by End User, 2020 to 2035
  • Table 7: Latin America Market Value (USD Million) Forecast by Country, 2020 to 2035
  • Table 8: Latin America Market Value (USD Million) Forecast by Product Type , 2020 to 2035
  • Table 9: Latin America Market Value (USD Million) Forecast by End User, 2020 to 2035
  • Table 10: Western Europe Market Value (USD Million) Forecast by Country, 2020 to 2035
  • Table 11: Western Europe Market Value (USD Million) Forecast by Product Type , 2020 to 2035
  • Table 12: Western Europe Market Value (USD Million) Forecast by End User, 2020 to 2035
  • Table 13: Eastern Europe Market Value (USD Million) Forecast by Country, 2020 to 2035
  • Table 14: Eastern Europe Market Value (USD Million) Forecast by Product Type , 2020 to 2035
  • Table 15: Eastern Europe Market Value (USD Million) Forecast by End User, 2020 to 2035
  • Table 16: East Asia Market Value (USD Million) Forecast by Country, 2020 to 2035
  • Table 17: East Asia Market Value (USD Million) Forecast by Product Type , 2020 to 2035
  • Table 18: East Asia Market Value (USD Million) Forecast by End User, 2020 to 2035
  • Table 19: South Asia and Pacific Market Value (USD Million) Forecast by Country, 2020 to 2035
  • Table 20: South Asia and Pacific Market Value (USD Million) Forecast by Product Type , 2020 to 2035
  • Table 21: South Asia and Pacific Market Value (USD Million) Forecast by End User, 2020 to 2035
  • Table 22: Middle East & Africa Market Value (USD Million) Forecast by Country, 2020 to 2035
  • Table 23: Middle East & Africa Market Value (USD Million) Forecast by Product Type , 2020 to 2035
  • Table 24: Middle East & Africa Market Value (USD Million) Forecast by End User, 2020 to 2035

List of Figures

  • Figure 1: Global Market Pricing Analysis
  • Figure 2: Global Market Value (USD Million) Forecast 2020-2035
  • Figure 3: Global Market Value Share and BPS Analysis by Product Type , 2025 and 2035
  • Figure 4: Global Market Y-o-Y Growth Comparison by Product Type , 2025-2035
  • Figure 5: Global Market Attractiveness Analysis by Product Type
  • Figure 6: Global Market Value Share and BPS Analysis by End User, 2025 and 2035
  • Figure 7: Global Market Y-o-Y Growth Comparison by End User, 2025-2035
  • Figure 8: Global Market Attractiveness Analysis by End User
  • Figure 9: Global Market Value (USD Million) Share and BPS Analysis by Region, 2025 and 2035
  • Figure 10: Global Market Y-o-Y Growth Comparison by Region, 2025-2035
  • Figure 11: Global Market Attractiveness Analysis by Region
  • Figure 12: North America Market Incremental Dollar Opportunity, 2025-2035
  • Figure 13: Latin America Market Incremental Dollar Opportunity, 2025-2035
  • Figure 14: Western Europe Market Incremental Dollar Opportunity, 2025-2035
  • Figure 15: Eastern Europe Market Incremental Dollar Opportunity, 2025-2035
  • Figure 16: East Asia Market Incremental Dollar Opportunity, 2025-2035
  • Figure 17: South Asia and Pacific Market Incremental Dollar Opportunity, 2025-2035
  • Figure 18: Middle East & Africa Market Incremental Dollar Opportunity, 2025-2035
  • Figure 19: North America Market Value Share and BPS Analysis by Country, 2025 and 2035
  • Figure 20: North America Market Value Share and BPS Analysis by Product Type , 2025 and 2035
  • Figure 21: North America Market Y-o-Y Growth Comparison by Product Type , 2025-2035
  • Figure 22: North America Market Attractiveness Analysis by Product Type
  • Figure 23: North America Market Value Share and BPS Analysis by End User, 2025 and 2035
  • Figure 24: North America Market Y-o-Y Growth Comparison by End User, 2025-2035
  • Figure 25: North America Market Attractiveness Analysis by End User
  • Figure 26: Latin America Market Value Share and BPS Analysis by Country, 2025 and 2035
  • Figure 27: Latin America Market Value Share and BPS Analysis by Product Type , 2025 and 2035
  • Figure 28: Latin America Market Y-o-Y Growth Comparison by Product Type , 2025-2035
  • Figure 29: Latin America Market Attractiveness Analysis by Product Type
  • Figure 30: Latin America Market Value Share and BPS Analysis by End User, 2025 and 2035
  • Figure 31: Latin America Market Y-o-Y Growth Comparison by End User, 2025-2035
  • Figure 32: Latin America Market Attractiveness Analysis by End User
  • Figure 33: Western Europe Market Value Share and BPS Analysis by Country, 2025 and 2035
  • Figure 34: Western Europe Market Value Share and BPS Analysis by Product Type , 2025 and 2035
  • Figure 35: Western Europe Market Y-o-Y Growth Comparison by Product Type , 2025-2035
  • Figure 36: Western Europe Market Attractiveness Analysis by Product Type
  • Figure 37: Western Europe Market Value Share and BPS Analysis by End User, 2025 and 2035
  • Figure 38: Western Europe Market Y-o-Y Growth Comparison by End User, 2025-2035
  • Figure 39: Western Europe Market Attractiveness Analysis by End User
  • Figure 40: Eastern Europe Market Value Share and BPS Analysis by Country, 2025 and 2035
  • Figure 41: Eastern Europe Market Value Share and BPS Analysis by Product Type , 2025 and 2035
  • Figure 42: Eastern Europe Market Y-o-Y Growth Comparison by Product Type , 2025-2035
  • Figure 43: Eastern Europe Market Attractiveness Analysis by Product Type
  • Figure 44: Eastern Europe Market Value Share and BPS Analysis by End User, 2025 and 2035
  • Figure 45: Eastern Europe Market Y-o-Y Growth Comparison by End User, 2025-2035
  • Figure 46: Eastern Europe Market Attractiveness Analysis by End User
  • Figure 47: East Asia Market Value Share and BPS Analysis by Country, 2025 and 2035
  • Figure 48: East Asia Market Value Share and BPS Analysis by Product Type , 2025 and 2035
  • Figure 49: East Asia Market Y-o-Y Growth Comparison by Product Type , 2025-2035
  • Figure 50: East Asia Market Attractiveness Analysis by Product Type
  • Figure 51: East Asia Market Value Share and BPS Analysis by End User, 2025 and 2035
  • Figure 52: East Asia Market Y-o-Y Growth Comparison by End User, 2025-2035
  • Figure 53: East Asia Market Attractiveness Analysis by End User
  • Figure 54: South Asia and Pacific Market Value Share and BPS Analysis by Country, 2025 and 2035
  • Figure 55: South Asia and Pacific Market Value Share and BPS Analysis by Product Type , 2025 and 2035
  • Figure 56: South Asia and Pacific Market Y-o-Y Growth Comparison by Product Type , 2025-2035
  • Figure 57: South Asia and Pacific Market Attractiveness Analysis by Product Type
  • Figure 58: South Asia and Pacific Market Value Share and BPS Analysis by End User, 2025 and 2035
  • Figure 59: South Asia and Pacific Market Y-o-Y Growth Comparison by End User, 2025-2035
  • Figure 60: South Asia and Pacific Market Attractiveness Analysis by End User
  • Figure 61: Middle East & Africa Market Value Share and BPS Analysis by Country, 2025 and 2035
  • Figure 62: Middle East & Africa Market Value Share and BPS Analysis by Product Type , 2025 and 2035
  • Figure 63: Middle East & Africa Market Y-o-Y Growth Comparison by Product Type , 2025-2035
  • Figure 64: Middle East & Africa Market Attractiveness Analysis by Product Type
  • Figure 65: Middle East & Africa Market Value Share and BPS Analysis by End User, 2025 and 2035
  • Figure 66: Middle East & Africa Market Y-o-Y Growth Comparison by End User, 2025-2035
  • Figure 67: Middle East & Africa Market Attractiveness Analysis by End User
  • Figure 68: Global Market - Tier Structure Analysis
  • Figure 69: Global Market - Company Share Analysis
Dashboard
Dashboard
Dashboard
Dashboard
Dashboard
Dashboard

Full Research Suite comprises of:

Market outlook & trends analysis

Market outlook & trends analysis

Interviews & case studies

Interviews & case studies

Strategic recommendations

Strategic recommendations

Vendor profiles & capabilities analysis

Vendor profiles & capabilities analysis

5-year forecasts

5-year forecasts

8 regions and 60+ country-level data splits

8 regions and 60+ country-level data splits

Market segment data splits

Market segment data splits

12 months of continuous data updates

12 months of continuous data updates

DELIVERED AS:

PDF EXCEL ONLINE

Full Research Suite


$5000

$7500

$10000

Buy Report Now
Similar Industry Reports

Similar Industry Reports

Flight Data Recording (FDR) Market

Flight Data Recording (FDR) Market Size and Share Forecast Outlook 2025 to 2035

Shingled Magnetic Recording Market

Shingled Magnetic Recording Market Size and Share Forecast Outlook 2025 to 2035

Electrophysiology Equipment and Recording Systems Market

Electrophysiology Equipment and Recording Systems Market Size and Share Forecast Outlook 2025 to 2035

Yacht Charter Market

Yacht Charter Market Analysis – Size, Share & Forecast 2025 to 2035

GCC Yacht Charter Service Market

GCC Yacht Charter Service Market Analysis – Trends & Forecast 2025 to 2035

Paper Wrap Market
Paper Wrap Market

Paper Wrap Market Size and Share Forecast Outlook 2025 to 2035

Paper Cups Market
Paper Cups Market

Paper Cups Market Size and Share Forecast Outlook 2025 to 2035

Paper Core Market
Paper Core Market

Paper Core Market Size and Share Forecast Outlook 2025 to 2035

Paper Bags Market
Paper Bags Market

Paper Bags Market Size and Share Forecast Outlook 2025 to 2035

Paper Processing Resins Market

Paper Processing Resins Market Size and Share Forecast Outlook 2025 to 2035

Paper Tester Market
Paper Tester Market

Paper Tester Market Size and Share Forecast Outlook 2025 to 2035

Paper Napkin Converting Lines Market

Paper Napkin Converting Lines Market Size and Share Forecast Outlook 2025 to 2035

Paper Packaging Tapes Market

Paper Packaging Tapes Market Size and Share Forecast Outlook 2025 to 2035

Paper Napkins Converting Machines Market

Paper Napkins Converting Machines Market Size and Share Forecast Outlook 2025 to 2035

Paper Coating Binders Market

Paper Coating Binders Market Size and Share Forecast Outlook 2025 to 2035

Paper Core Cutting Machine Market

Paper Core Cutting Machine Market Size and Share Forecast Outlook 2025 to 2035

Paper Recycling Market

Paper Recycling Market Size and Share Forecast Outlook 2025 to 2035

Paper Release Liners Market

Paper Release Liners Market Size and Share Forecast Outlook 2025 to 2035

Paper Coating Materials Market

Paper Coating Materials Market Size and Share Forecast Outlook 2025 to 2035

Paper Pigments Market

Paper Pigments Market Size and Share Forecast Outlook 2025 to 2035

Future Market Insights

Recording Chart Paper Market

Chat With MaRIA

Chat With

MaRIA

Hi There, I am MaRIA, Your Market Research Intelligence Assistant. How may I help you?