

- Market Size (2026)
- USD 1460.6 Mn
- Forecast (2036)
- USD 3426.2 Mn
- CAGR (2026 to 2036)
- 8.9%
How big is the Recycled Pharma Solvents Market in 2026?
USD 1,460.6 million in 2026 and USD 3,426.2 million by 2036 at an 8.9% CAGR.
Demand for recycled pharma solvents is projected to expand at 8.9% CAGR between 2026 and 2036. Industry value is estimated at USD 1,460.6 million during 2026 across established recovery service contracts. Valuation is likely to reach USD 3,426.2 million by 2036 within pharmaceutical manufacturing accounts and operations. India’s Press Information Bureau reported pharmaceutical exports of USD 30.47 billion for fiscal 2024 to 2025 in April 2025. That production base generates repeat solvent streams and supports segregated recovery loops because documented reuse is expected to reduce virgin-solvent purchasing and disposal exposure. Recovery planning connects directly with purchasing decisions across the wider pharmaceutical solvents industry and regulated manufacturing accounts.
India and China are anticipated to prioritize local recovery access because API clusters create frequent solvent movements between production and treatment sites. United States and Western European accounts are projected to place weight on chain-of-custody records before recovered material re-enters controlled workflows. Recovery teams compare feed composition before selecting distillation stages and drying steps for each recurring stream. Veolia explained in October 2025 that pharmaceutical synthesis generates solvent waste within a broader hazardous-waste control problem. Mixed solvent streams first need segregation before economical recovery becomes realistic for regulated pharmaceutical manufacturers. Sourcing teams are expected to compare analytical release support and permitted transport coverage beside quoted service price. Those sourcing choices connect plant waste strategy with purchasing patterns across industrial solvents demand in production hubs.
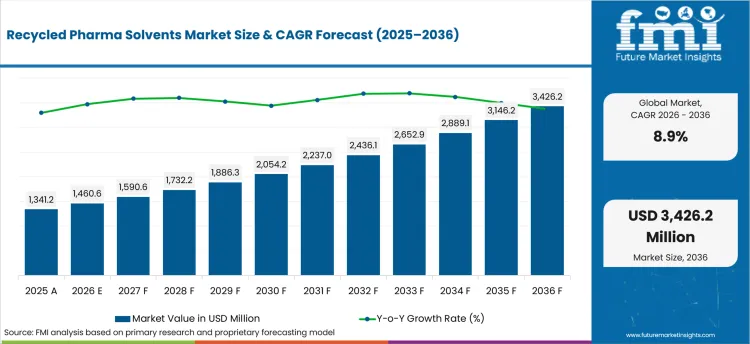
| Metric | Value |
|---|---|
| 2025 Market Size | USD 1,341.2 million |
| 2026 Market Size | USD 1,460.6 million |
| 2036 Market Size | USD 3,426.2 million |
| Forecast CAGR (2026-2036) | 8.9% |
| Solvent Type Focus | Alcohols |
| Alcohols Share (2026) | 34.8% |
| Purity Grade Focus | Pharma Grade |
| Pharma Grade Share (2026) | 41.2% |
| Recovery Method Focus | Fractional Distillation |
| Fractional Distillation Share (2026) | 52.0% |
| Fastest-growing Country | India |
| India CAGR by 2036 | 10.7% |
Summary of the Recycled Pharma Solvents Market
| Market Signal | Commercial Impact |
|---|---|
| Demand and Growth Drivers | Recovery programs gain commercial relevance when repeat solvent streams are segregated before leaving the pharmaceutical plant.
|
| Product and Segment View | Alcohol streams and pharma-grade specifications shape the disclosed segment view because recoverability depends on feed composition and release needs.
|
| Geography and Growth Outlook | Country demand differs according to pharmaceutical production density and the local availability of permitted recovery infrastructure.
|
| Competitive Landscape | Competition centers on recovery depth and analytical release support instead of simple waste collection capacity.
|
| Analyst Perspective | Recovered solvent adoption depends on a controlled handoff between waste management and pharmaceutical quality systems. The approval bottleneck is usually proof that the returned solvent fits its intended reuse category.
- Nikhil Kaitwade, Principal Analyst at Future Market Insights |
Source: FMI's proprietary forecasting model and primary research
How is the recycled pharma solvents market segmented?
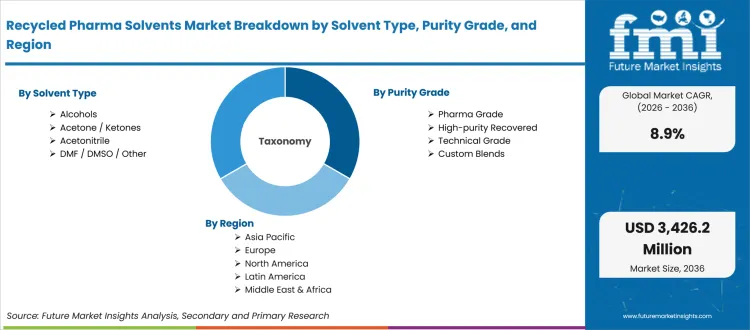
The recycled pharma solvents industry is segmented by Solvent Type, Purity Grade, Recovery Method, End Use, Sales Model, and Region.
The market uses five operating categories before regional coverage is applied across country-level demand analysis. Solvent Type covers Acetone or Ketones, Alcohols, Acetonitrile, and DMF or DMSO and Other streams, and Purity Grade covers Pharma Grade, High-purity Recovered, Technical Grade, and Custom Blends. Recovery Method includes Fractional Distillation, Molecular Sieves or Drying, Adsorption Purification, and Hybrid Recovery, and End Use covers API Manufacturing, CDMOs, Biopharma Labs, and Specialty Chemicals. Sales Model covers Toll Recovery, Recovered Solvent Sale, and Closed-loop Service. Polar process streams connect the scope with specialized demand represented within the dimethyl sulfoxide market and related purification workflows. Regional coverage includes North America, Western Europe, East Asia, South Asia and Pacific, and other profiled markets.
What supports alcohol recovery within the Solvent Type category?
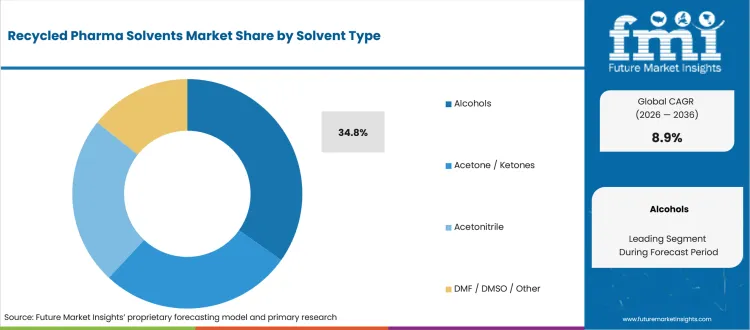
Alcohol recovery depends on feed stability because solids and water change the required separation sequence before a stream is suitable for return to use. Maratek explained in January 2025 that high-sludge recovery methods must match the contamination load found in the incoming feed. That design requirement is directly relevant to ethanol and isopropanol streams because pharmaceutical operators need predictable recovery conditions before assigning equipment or reuse limits.
- By Solvent Type, Alcohols are estimated to hold 34.8% share in 2026 because cleaning and extraction work creates repeat recoverable streams. Maratek explained VOC recovery system operation in March 2025 and linked equipment selection to vapor loading and target return conditions.
- API manufacturers and CDMOs are projected to use alcohol recovery where site segregation preserves ethanol or isopropanol identity across batches. Maratek discussed pharmaceutical VOC control in April 2025 and connected recovery design with pharmaceutical process conditions. Process teams are expected to compare condensation and separation performance before returning recovered alcohol to an approved use category.
How does Pharma Grade shape purchasing within the Purity Grade category?
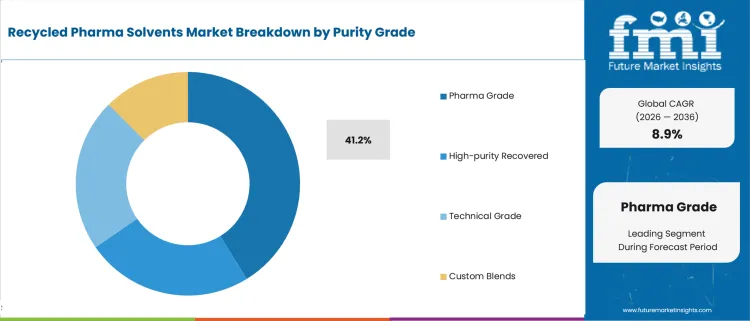
Pharma Grade recovered solvent follows a stricter review path because release depends on analytical evidence and a defined reuse purpose. Maratek described high-purity solvent recovery in April 2025 and presented distillation plus polishing as parts of the purification strategy. Quality teams compare impurity profiles and moisture control before accepting recovered batches for regulated manufacturing workflows and approved plant support uses.
- In 2026, Pharma Grade is projected to account for 41.2% share due to release testing and traceability requirements. Procurement teams are expected to define technical acceptance criteria before comparing service proposals across recovery providers.
- Quality units and process chemists are anticipated to define permitted reuse categories before a solvent recovery contract begins. Maratek published equipment-selection guidance in July 2025 and identified solvent properties plus contamination patterns as central design inputs. Pharmaceutical plants are expected to align recovery equipment with reuse requirements before negotiating routine collection schedules.
What drives Fractional Distillation use within the Recovery Method category?
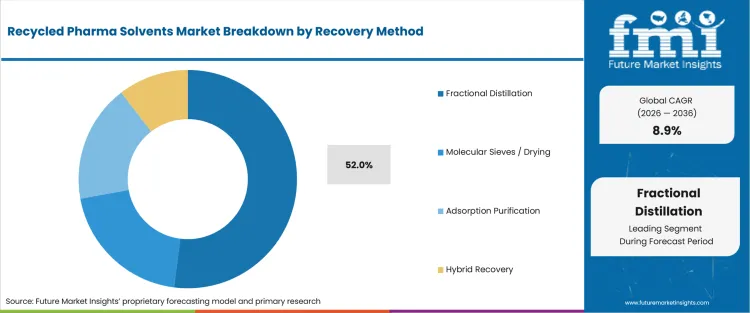
Fractional distillation becomes relevant when volatile components require staged separation before recovered solvent meets an intended return specification. Maratek discussed compliance-oriented VOC recovery in October 2025 and connected separation choices with emission control and material reuse. Comparable regeneration planning affects CO2 solvent systems because engineering teams evaluate boiling behavior and contamination before deciding whether one separation stage is technically sufficient.
- Fractional Distillation is forecast to represent 52.0% share in 2026 because multicomponent streams need controlled separation across repeated batches. SEQENS discussed solvent selection in December 2025 and explained how solvent properties affect recovery difficulty and downstream handling. Recovery providers are expected to model volatility differences before committing yield and purity targets for recurring customer programs.
- Plant engineers and recovery specialists are projected to combine distillation with drying or polishing when residual water or trace compounds block reuse. SEQENS discussed process solvent choices for API manufacturing in March 2025 and linked recovery performance with the chemistry that created the waste stream. Reuse planning begins with process history and analytical characterization before equipment settings and contract terms are finalized.
How is API Manufacturing positioned within the End Use category?
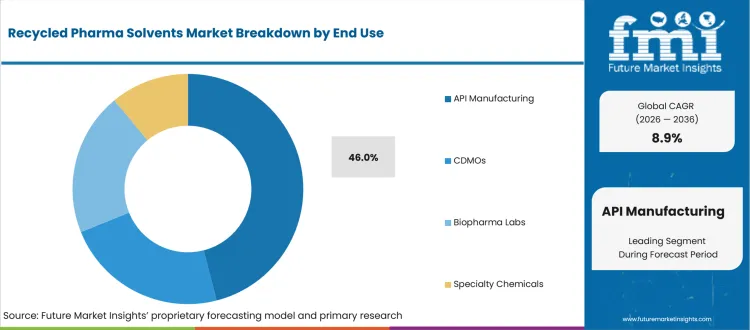
API manufacturing creates recurring solvent loops during reaction and purification stages that repeat across planned campaign production schedules. SEQENS described scale-up and process transfer work in January 2026 as connected steps in industrial chemical production. Recovery programs need to fit campaign timing and cleaning controls without changing validated process conditions that govern pharmaceutical release decisions across recurring regulated manufacturing campaigns.
- By end use, API manufacturing is anticipated to hold 46.0% share in 2026 owing to recurring solvent use across synthesis and purification. CBG Biotech described distillation-based recycling in February 2025 and explained that system choice depends on stream volume and contamination. API plants are expected to compare batch frequency before choosing between on-site and centralized recovery.
- Process development teams and plant operators are expected to qualify reuse routes where recovered solvent has a defined purpose and documented acceptance criteria. CBG Biotech compared incineration and on-site recycling in May 2025 while explaining differences in handling workflow and material return timing. Pharmaceutical sites first review segregation discipline before assigning solvent streams to recovery or documented resale programs.
What keeps Toll Recovery relevant within the Sales Model category?
Toll recovery keeps customer ownership central to the service arrangement and reduces uncontrolled mixing with outside solvent streams. CBG Biotech explained in August 2025 that feed concentration affects recovery performance beyond headline purity. That distinction affects tolling because stream history shapes equipment settings and expected yield before routine return cycles begin under defined customer specifications and agreed customer contamination limits.
- The sales model category is estimated to be led by toll recovery at 39.0% share in 2026 due to customer control over spent and returned material. CBG Biotech described a laboratory recycling workflow in November 2025 that starts with collection before separation and reuse. Pharmaceutical accounts are expected to demand comparable chain-of-custody controls at industrial scale before recurring recovery contracts begin.
- CDMOs and API plants are projected to evaluate toll providers on collection discipline and batch records beside recovery yield. CBG Biotech published guidance in February 2025 covering MEK and acetone alongside IPA and toluene recovery. Service providers need process-specific operating ranges because one configuration cannot handle every solvent mixture with equal performance.
What are the drivers, restraints, and opportunities in the recycled pharma solvents market?
Repeated solvent generation drives recovery demand, contamination control restrains reuse, and documented closed-loop services create the clearest commercial opening.
- Driver: API plants are expected to expand recovery programs when segregated solvent streams recur often enough to support controlled collection and return cycles.
- Restraint: Mixed feeds and trace contaminants are anticipated to slow qualification because recovery performance and reuse limits become harder to predict.
- Opportunity: Closed-loop tolling is projected to gain account interest where documented ownership and analytical release support fit existing pharmaceutical quality systems.
Regulatory scrutiny around solvent impurities is expected to increase the value of recovery routes that preserve stream identity. The USA Food and Drug Administration warned manufacturers in July 2025 about benzene contamination risks in certain medicines. FDA identified benzene as a Class 1 solvent that should not be used unless strongly justified. Recovery providers need controls that detect carryover before returned material enters an approved workflow. That compliance pressure changes provider qualification criteria across chemical recycling services serving regulated pharmaceutical production sites.
Mixed feeds are anticipated to reduce recovery yield when water and trace residues change the separation burden between collection batches. The USA Environmental Protection Agency extended methylene chloride monitoring deadlines in November 2025 to November 9, 2026, for affected non-federal laboratories. The compliance schedule illustrates how changing solvent controls are expected to alter testing workloads around recovery decisions. Pharmaceutical sites evaluate sampling plans and documentation before accepting returned material into controlled manufacturing workflows. The same restraint affects purchasing decisions across aliphatic solvent supply where virgin replacement remains available.
Closed-loop tolling is projected to convert recurring waste streams into service relationships when recovered material returns to the originating customer. Clean Harbors described in its February 2025 annual report how some solvent recycling programs return material to customer specifications. That model fits pharmaceutical accounts that need ownership continuity and defined reuse boundaries across recurring campaigns. Providers are expected to combine collection records with analytical testing and release documentation for recurring returned batches. The commercial opening aligns with the wider fine chemicals outlook where process purity and supply continuity remain connected.
Which country CAGRs are profiled in the recycled pharma solvents market?
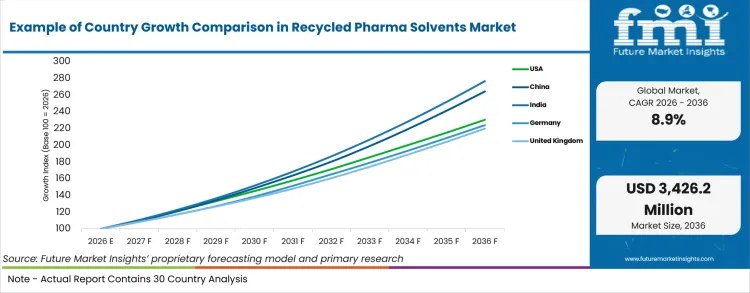
| Country | CAGR |
|---|---|
| United States | 8.7% |
| China | 10.2% |
| India | 10.7% |
| Germany | 8.4% |
| United Kingdom | 8.2% |
| Japan | 7.6% |
| South Korea | 9.2% |
Source: FMI's proprietary forecasting model and primary research
How do country-level CAGRs compare in the recycled pharma solvents market?
Country demand is expected to vary with production density and access to infrastructure for solvent recovery. Cross-border treatment access affects service choices when regeneration options remain limited for pharmaceutical solvent streams. India and China are projected to expand recovery around production corridors serving pharmaceutical and chemical plants. Western markets are anticipated to prioritize custody controls and permitted treatment routes during contract reviews. Japan and South Korea are expected to connect recovery decisions with documented high-purity manufacturing requirements. These differences shape sourcing across low migration solvent applications that depend on controlled residue profiles.
- United States pharmaceutical sites operate under close quality oversight that places solvent recovery vendors inside manufacturing and compliance reviews. Demand is projected to expand at 8.7% CAGR during the forecast period as documented recovery programs enter more recurring pharmaceutical workflows. FDA reported in June 2026 that its fiscal 2025 program conducted 1,248 drug quality assurance inspections across domestic and foreign sites. That inspection workload reinforces the need for traceable handling when recovered solvent returns near regulated production.
- China combines large chemical production corridors with pharmaceutical manufacturing zones that generate recurring solvent streams near industrial treatment infrastructure. Local plants compare centralized recovery against on-site separation according to stream volume and transport distance. Expansion in China is forecast at 10.2% CAGR by 2036 as local recovery services expand within clustered pharmaceutical manufacturing corridors. The National Bureau of Statistics reported in January 2026 that value added for medicine manufacturing increased 2.4% during 2025. That activity base keeps process streams moving through treatment and reuse decisions across manufacturing clusters.
- India’s API and generics clusters create a practical recovery case because production campaigns repeatedly use alcohols and other process solvents. Pharmexcil reported in June 2025 that bulk drug exports reached USD 4,869.98 million during fiscal 2024 to 2025. Export activity keeps solvent handling tied to documented production workflows across regulated customer supply chains. India is projected to advance at 10.7% CAGR through 2036 as local recovery services expand near major API production clusters. Octane Chemicals offers contract distillation for pharmaceutical and specialty solvent streams within this operating environment.
- German pharmaceutical and fine-chemical sites tend to formalize supplier qualification before recovered material enters routine process support. German demand is estimated to expand at 8.4% CAGR through 2036 as pharmaceutical plants formalize recurring recovery qualification procedures. VCI reported in March 2026 that pharmaceutical production increased 4.5% across 2025 even while the wider chemical sector contracted. That sector divergence keeps pharmaceutical production commercially relevant for recovery providers serving regulated solvent streams and documented reuse programs.
- United Kingdom recovery demand is shaped by pharmaceutical production and fine-chemical operations that place close attention on solvent identity after treatment. Batch-based campaigns make flexible collection windows more useful than fixed high-volume schedules for recurring solvent streams. Industry demand is anticipated to grow at 8.2% CAGR through 2036 as flexible recovery services support batch-based pharmaceutical operations. The Office for National Statistics reported in February 2026 that basic pharmaceutical products and preparations output decreased 2.6% in December 2025. Monthly production changes are expected to alter collection timing and increase the value of flexible service windows for batch-based accounts. Site sourcing teams are expected to evaluate smaller-lot handling and turnaround documentation beside quoted recovery yield. Stable return schedules remain easier to manage when facilities segregate streams at source and communicate campaign timing before pickup.
- Japan’s pharmaceutical production system places close attention on process consistency and documentation before a recovered input returns to controlled workflows. Engineering teams often begin with non-critical reuse categories before proposing broader applications within controlled pharmaceutical production and support workflows. PMDA reported in September 2025 that it completed 2,175 GMP inspections for drug manufacturing sites during fiscal 2024. Japan is projected to record 7.6% CAGR through 2036 as documentation-intensive recovery programs expand across suitable solvent streams. The inspection workload reinforces conservative review of material history and analytical release evidence before recovered solvent re-enters controlled workflows.
- South Korea’s concentrated biopharma and CDMO footprint creates recurring solvent-management needs around large production campuses. Domestic demand is projected to expand at 9.2% CAGR through 2036 as large production campuses formalize recurring solvent-management programs. Korea.net reported in March 2026 that biohealth exports reached USD 27.9 billion in total during 2025. Export-oriented production increases scrutiny on documented material handling because customers and regulators review process controls across global supply chains.
Who are the notable companies in the recycled pharma solvents market?
Clean Harbors, Veolia, Tradebe, SUEZ, Maratek Environmental, Hydrite Chemical, SEQENS, and Octane Chemicals are the notable companies shaping this market.
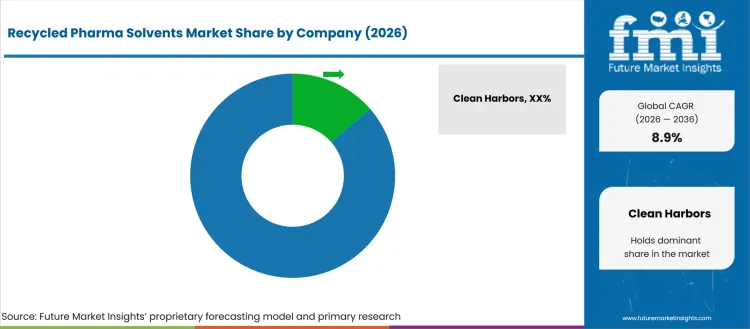
Competition centers on separation capability and evidence needed to return recovered material to controlled pharmaceutical use. Multi-site providers compete on collection coverage and access to permitted treatment infrastructure for recurring accounts. Distillation specialists differentiate through feed characterization and recovery routes designed for water-rich or multicomponent streams. Pharmaceutical accounts compare chain-of-custody records and analytical release support because reuse decisions pass through quality review. Clean Harbors reported in October 2025 that higher waste volumes moved through its disposal and recycling network during the third quarter. Account teams evaluate technical proof beside transport coverage and turnaround reliability during recurring service qualification. The same factors influence supplier selection across valeronitrile demand where high-purity solvent handling affects process continuity and downstream release requirements.
- Clean Harbors and Veolia compete across multi-site accounts where collection reach and permitted treatment infrastructure affect contract scope. Their broader hazardous-waste platforms support customers that need solvent recovery beside residual treatment routes across several manufacturing locations. Pharmaceutical accounts are expected to compare custody records and regional service continuity before consolidating recurring solvent programs.
- Maratek Environmental and Hydrite Chemical compete where recovery design and smaller batch handling shape service fit. Maratek specializes in distillation systems and recovery services, while Hydrite combines recycled solvent supply with processing support. Their account fit depends on stream characterization and practical turnaround performance across recurring collection schedules for smaller or variable batches.
- Tradebe and SUEZ serve accounts that require solvent recovery infrastructure across regional industrial networks and shared manufacturing zones. Tradebe Purification officially describes recycling and chemical supply for pharmaceutical customers while SUEZ operates organic solvent regeneration projects. Their competitive position is tied to collection access and regeneration capacity beside broader environmental services.
- SEQENS and Octane Chemicals serve process-focused accounts that need solvent purification or contract distillation alongside chemical manufacturing knowledge. Their fit is most relevant where customers require technical discussion about stream composition before recurring recovery cycles begin.
Competitive Benchmarking: Recycled Pharma Solvents Market
| Company | Market Relevance | Recovery Capability | Account Support | Service Reach |
|---|---|---|---|---|
| Clean Harbors | High | High | High | Regional; North America |
| Veolia | High | High | High | Global |
| Tradebe | High | High | High | Regional; Europe and North America |
| SUEZ | Medium | High | High | Global |
| Maratek Environmental | High | High | High | Regional; Canada |
| Hydrite Chemical | Medium | Medium | High | Regional; North America |
| SEQENS | High | High | High | Global |
| Octane Chemicals | Medium | High | Medium | Country-specific; India with export accounts |
Source: Future Market Insights competitive analysis, 2026. Ratings reflect relative portfolio relevance and workflow fit. Service capability and geographic reach shape the remaining comparison.
Key Developments in the Recycled Pharma Solvents Market
- In June 2025, Veolia reported that completed tuck-in acquisitions had added 100,000 tonnes of operating hazardous-waste capacity. The company also said its broader capacity program included new solvent recovery units for industrial customer waste streams.
- In May 2026, Tradebe acquired a majority stake in Soltec Ireland and added an operation specializing in transfer station services plus solvent recycling and distillation. The transaction expanded regional access for customers that need collection and recovery inside the same waste-management relationship.
- In March 2026, SEQENS reported a full-scale solvent recovery project for a difficult water and solvent azeotrope stream. The company recovered 100 tons of solvent after moving the separation approach from laboratory work to industrial service.
- In April 2026, SUEZ held a ceremony for an organic solvent recycling project in Chongqing’s Changshou industrial park. The first project phase was designed for 30,000 tonnes of annual treatment capacity across collection and regeneration before reuse.
Key Players in the Recycled Pharma Solvents Market
Integrated Environmental and Recovery Service Providers
- Clean Harbors
- Veolia
- Tradebe
- SUEZ
Specialist Solvent Recovery and Distillation Providers
- Maratek Environmental
- Hydrite Chemical
- Octane Chemicals
Process Chemistry and Solvent Recovery Specialists
- SEQENS
Recycled Pharma Solvents Market - Report Scope
| Coverage field | Report scope |
|---|---|
| Market breakdown | Solvent Type, Purity Grade, Recovery Method, End Use, and Sales Model |
| Quantitative Units | Revenue in USD Million or USD Billion and CAGR in % |
| Market Definition | Recovered pharmaceutical process solvents and recovery services that prepare spent solvent streams for documented reuse or resale. |
| Regions Covered | North America, Western Europe, East Asia, South Asia and Pacific, and other covered markets |
| Countries Covered | United States, China, India, Germany, United Kingdom, Japan, and South Korea |
| Key Companies Profiled | Clean Harbors, Veolia, Tradebe, SUEZ, Maratek Environmental, Hydrite Chemical, SEQENS, and Octane Chemicals |
| Forecast Period | 2026 to 2036 |
| Approach | Primary research, official source review, company verification, and proprietary forecast modeling |
Source: Future Market Insights - analysis driven by proprietary forecasting models and primary research
Recycled Pharma Solvents Market - Research Methodology
| Method | Approach |
|---|---|
| Primary Research | Interviews with recovery providers, pharmaceutical manufacturers, process teams, environmental service contractors, and procurement professionals. |
| Desk Research | Review of official government releases, regulator publications, company disclosures, technical service pages, and trade-body material. |
| Market Sizing and Forecasting | Demand estimates are built from solvent use intensity, recoverable stream availability, service penetration, plant activity, and country-specific adoption conditions. |
| Data Validation | Findings are triangulated across primary interviews and official evidence before proprietary forecast assumptions are reconciled across segments and countries. |
Source: Future Market Insights (FMI) analysis, based on proprietary forecasting model and primary research
Recycled Pharma Solvents Market by Segments
Recycled Pharma Solvents Market segmented by Solvent Type:
- Acetone / Ketones
- Alcohols
- Acetonitrile
- DMF / DMSO / Other
Recycled Pharma Solvents Market segmented by Purity Grade:
- Pharma Grade
- High-purity Recovered
- Technical Grade
- Custom Blends
Recycled Pharma Solvents Market segmented by Recovery Method:
- Fractional Distillation
- Molecular Sieves / Drying
- Adsorption Purification
- Hybrid Recovery
Recycled Pharma Solvents Market segmented by End Use:
- API Manufacturing
- CDMOs
- Biopharma Labs
- Specialty Chemicals
Recycled Pharma Solvents Market segmented by Sales Model:
- Toll Recovery
- Recovered Solvent Sale
- Closed-loop Service
Recycled Pharma Solvents Market by Region:
- North America
- United States
- Canada
- Western Europe
- Germany
- United Kingdom
- France
- Italy
- Spain
- East Asia
- China
- Japan
- South Korea
- South Asia and Pacific
- India
- Australia
- ASEAN
- Middle East and Africa
- GCC Countries
- South Africa
- Israel
Research Sources and Bibliography
- CBG Biotech. (2025, February). Beyond disposal: The industrial advantage of solvent recycling. CBG Biotech.
- CBG Biotech. (2025, February). The simplicity of solvent recycling with distillation systems. CBG Biotech.
- CBG Biotech. (2025, May). What’s really going up the stack? The hidden impact of solvent incineration. CBG Biotech.
- CBG Biotech. (2025, August). Why solvent concentration matters more than purity. CBG Biotech.
- CBG Biotech. (2025, November). Solvent recycling made simple for your lab. CBG Biotech.
- Clean Harbors, Inc. (2025, February). Annual report 2024. Clean Harbors, Inc.
- Clean Harbors, Inc. (2025, October). Clean Harbors announces third-quarter 2025 financial results. Clean Harbors, Inc.
- Eurostat. (2025, December). Waste shipment statistics. European Commission.
- Food and Drug Administration. (2025, July). FDA alerts drug manufacturers to the risk of benzene contamination in certain drugs. USA Food and Drug Administration.
- Government of India Press Information Bureau. (2025, April). India’s cumulative exports during April-March 2024-25. Ministry of Commerce and Industry.
- Korea.net. (2026, March). Biohealth exports reach record high of USD 27.9 billion in 2025. Government of the Republic of Korea.
- Maratek Environmental Inc. (2025, January). What are the best methods for solvent recovery from high sludge waste to maximize efficiency and sustainability? Maratek Environmental Inc.
- Maratek Environmental Inc. (2025, March). What are Maratek’s VOC recovery systems and how do they work? Maratek Environmental Inc.
- Maratek Environmental Inc. (2025, April). How can pharmaceutical manufacturers control VOC emissions effectively? Maratek Environmental Inc.
- Maratek Environmental Inc. (2025, April). How does solvent recovery support the growing demand for high-purity solvents? Maratek Environmental Inc.
- Maratek Environmental Inc. (2025, June). What is the true cost and long-term value of solvent recycling in industrial manufacturing? Maratek Environmental Inc.
- Maratek Environmental Inc. (2025, July). How do you select the right solvent recycling equipment? Maratek Environmental Inc.
- Maratek Environmental Inc. (2025, October). How can VOC recovery and solvent recycling help meet regulations and sustainability goals? Maratek Environmental Inc.
- Maratek Environmental Inc. (2026, May). How does your facility’s production volume dictate your solvent recovery strategy? Maratek Environmental Inc.
- National Bureau of Statistics of China. (2026, January). Industrial production operation in December 2025. National Bureau of Statistics of China.
- Office for National Statistics. (2026, February). Index of production, UK: December 2025. Office for National Statistics.
- Pharmaceuticals and Medical Devices Agency. (2025, September). FY 2024 GMP/GCTP Annual Report. PMDA.
- Pharmaceuticals Export Promotion Council of India. (2025, June). Handbook of pharmaceutical exports statistics 2024-25. Pharmexcil.
- SEQENS. (2025, March). Evolving the green chemist’s toolbox for APIs manufacturing. SEQENS.
- SEQENS. (2025, December). Key factors in solvent selection: Balancing performance, safety, and sustainability. SEQENS.
- SEQENS. (2026, January). Case study - development and custom manufacturing of specialty ingredients compound for a TOP5 global chemical company. SEQENS.
- SEQENS. (2026, March). From waste to value: Large scale solvent recovery success story. SEQENS.
- SUEZ. (2026, April). SUEZ breaks ground on organic solvent recycling project in Chongqing, supporting sustainable development of industrial parks. SUEZ.
- Tradebe. (2026, May). Tradebe strengthens its presence in Ireland through acquisition of a majority stake in specialist transfer station and distillation business Soltec. Tradebe.
- USA Environmental Protection Agency. (2025, November). EPA extends compliance deadlines for methylene chloride rule, easing challenges for non-federal laboratories. USA Environmental Protection Agency.
- USA Food and Drug Administration. (2026, June). Report on the State of Pharmaceutical Quality FY2025. USA Food and Drug Administration.
- Veolia. (2025, June). Veolia increases its leadership in hazardous waste treatment with major investment in new capacity & targeted tuck-ins acquisitions. Veolia.
- Veolia. (2025, October). Hazardous waste management: Risk prevention. Veolia.
- Verband der Chemischen Industrie e.V. (2026, March). Chemical industry still in trouble. VCI.
This bibliography is provided for reader reference and uses primary government sources, standards-body references, official trade bodies, and company sources.
This Report Answers
- What are the estimated market values for recycled pharma solvents in 2026 and 2036?
- What CAGR is projected for the recycled pharma solvents market across the forecast period?
- How is the market structured by solvent type and purity grade beside recovery method and end use?
- Which operating conditions are expected to support pharmaceutical solvent recovery programs?
- Why do country CAGR expectations differ across the profiled pharmaceutical manufacturing markets?
- Which capabilities separate solvent recovery providers during pharmaceutical account qualification?
- How does FMI validate recycled pharma solvent forecasts across segments and countries?
- What should procurement teams assess before selecting a toll recovery or solvent regeneration provider?
- How do impurity control and documentation requirements affect recovered solvent reuse decisions?
Frequently Asked Questions
What is driving growth in the Recycled Pharma Solvents Market?
Growth is expected to come from repeated solvent generation across API manufacturing and CDMO production operations that use recurring process streams. Segregated streams create a clearer recovery case because plants reduce disposal exposure and control reuse decisions.
Who are the key players in the Recycled Pharma Solvents Market?
Clean Harbors and Veolia compete beside Tradebe and SUEZ across integrated recovery networks serving pharmaceutical and chemical manufacturing accounts. Maratek Environmental, Hydrite Chemical, SEQENS, and Octane Chemicals add specialist distillation or process support where stream characterization and documentation shape account selection.
What is a significant restraint in the Recycled Pharma Solvents Market?
Mixed feeds and trace contaminants weaken recovery yield and complicate release testing across customer streams with variable composition. Pharmaceutical plants delay reuse when a recovery provider cannot document solvent identity and impurity control across recurring returned batches.
Why should executives track the Recycled Pharma Solvents Market?
Solvent recovery affects waste cost and fresh-material purchasing decisions within solvent-intensive pharmaceutical operations that generate recurring recoverable streams. Executives should track whether recovery programs improve material control without creating quality or compliance exposure.
What business problem does the Recycled Pharma Solvents Market address?
The market addresses recurring spent-solvent streams that retain recoverable material value after pharmaceutical synthesis and purification operations. Recovery services give manufacturers a route to reduce disposal dependence while keeping selected solvent loops under documented control.
What should procurement leaders evaluate before selecting suppliers?
Procurement leaders should evaluate recovery method fit and analytical release support beside transport permits and turnaround reliability. They should also confirm how the provider records custody and separates customer-owned streams across collection and return cycles.
What limits return on investment for purchasers?
Returns weaken when streams are poorly segregated or too variable for repeatable recovery across recurring collection and return cycles. Low batch frequency and long transport distances reduce the economic benefit of collection and return cycles.
How do suppliers build long-term account confidence?
Suppliers build confidence by returning consistent material with clear batch records and defined acceptance criteria. Repeat purchasing depends on responsive service and evidence that recovery performance remains stable across production cycles.
Preview the report firsthand - request a free sample
Get SampleGet the brochure for pricing and purchase details.
Get PDFTable of Content
- Key Takeaways
- Market Size and CAGR
- Top Growth Driver
- Fastest Growing Segment
- Leading Region
- Key Companies
- Emerging Opportunities
- Executive Summary
- Global Market Outlook
- Demand-side Trends
- Supply-side Trends
- Technology Roadmap Analysis
- Analysis and Recommendations
- Analyst Perspective (What is happening? Why now? What should investors know?)
- Key Questions Answered
- How large is the market?
- What is the CAGR?
- What are key trends?
- Which region dominates?
- Who are the leaders?
- Market Overview
- Market Coverage / Taxonomy
- Market Definition / Scope / Limitations
- Research Methodology
- Chapter Orientation
- Analytical Lens and Working Hypotheses
- Market Structure, Signals, and Trend Drivers
- Benchmarking and Cross-market Comparability
- Market Sizing, Forecasting, and Opportunity Mapping
- Research Design and Evidence Framework
- Desk Research Programme (Secondary Evidence)
- Expert Input and Fieldwork (Primary Evidence)
- Tooling, Models, and Reference Databases
- Data Engineering and Model Build
- Quality Assurance and Audit Trail
- Market Background
- Market Dynamics (Drivers, Restraints, Opportunity, Trends)
- Scenario Forecast (Optimistic, Likely, Conservative)
- Impact Analysis
- AI Impact
- Sustainability Impact
- Regulatory Impact
- Technology Impact
- Consumer / Buyer Analysis
- Purchase Drivers
- Adoption Barriers
- Buyer Journey
- Opportunity Map Analysis
- Product Life Cycle Analysis
- Supply Chain Analysis
- Investment Feasibility Matrix
- Value Chain Analysis
- PESTLE and Porter's Analysis
- Regulatory Landscape
- Regional Parent Market Outlook
- Production and Consumption Statistics
- Import and Export Statistics
- Global Market Analysis and Forecast, 2021 to 2036
- Historical Market Size Value (USD Million) Analysis, 2021 to 2025
- Current and Future Market Size Value (USD Million) Projections, 2026 to 2036
- Y-o-Y Growth Trend Analysis
- Absolute $ Opportunity Analysis
- Global Market Pricing Analysis, 2021 to 2036
- Global Market Analysis and Forecast, By Solvent Type, 2021 to 2036
- Introduction / Key Findings
- Historical Market Size Value (USD Million) Analysis By Solvent Type, 2021 to 2025
- Current and Future Market Size Value (USD Million) Analysis and Forecast By Solvent Type, 2026 to 2036
- Alcohols
- Acetone / Ketones
- Acetonitrile
- DMF / DMSO / Other
- Alcohols
- Y-o-Y Growth Trend Analysis By Solvent Type, 2021 to 2025
- Absolute $ Opportunity Analysis By Solvent Type, 2026 to 2036
- Global Market Analysis and Forecast, By Purity Grade, 2021 to 2036
- Introduction / Key Findings
- Historical Market Size Value (USD Million) Analysis By Purity Grade, 2021 to 2025
- Current and Future Market Size Value (USD Million) Analysis and Forecast By Purity Grade, 2026 to 2036
- Pharma Grade
- High-purity Recovered
- Technical Grade
- Custom Blends
- Pharma Grade
- Y-o-Y Growth Trend Analysis By Purity Grade, 2021 to 2025
- Absolute $ Opportunity Analysis By Purity Grade, 2026 to 2036
- Global Market Analysis and Forecast, By Recovery Method, 2021 to 2036
- Introduction / Key Findings
- Historical Market Size Value (USD Million) Analysis By Recovery Method, 2021 to 2025
- Current and Future Market Size Value (USD Million) Analysis and Forecast By Recovery Method, 2026 to 2036
- Fractional Distillation
- Molecular Sieves / Drying
- Adsorption Purification
- Hybrid Recovery
- Fractional Distillation
- Y-o-Y Growth Trend Analysis By Recovery Method, 2021 to 2025
- Absolute $ Opportunity Analysis By Recovery Method, 2026 to 2036
- Global Market Analysis and Forecast, By End Use, 2021 to 2036
- Introduction / Key Findings
- Historical Market Size Value (USD Million) Analysis By End Use, 2021 to 2025
- Current and Future Market Size Value (USD Million) Analysis and Forecast By End Use, 2026 to 2036
- API Manufacturing
- CDMOs
- Biopharma Labs
- Specialty Chemicals
- API Manufacturing
- Y-o-Y Growth Trend Analysis By End Use, 2021 to 2025
- Absolute $ Opportunity Analysis By End Use, 2026 to 2036
- Global Market Analysis and Forecast, By Sales Model, 2021 to 2036
- Introduction / Key Findings
- Historical Market Size Value (USD Million) Analysis By Sales Model, 2021 to 2025
- Current and Future Market Size Value (USD Million) Analysis and Forecast By Sales Model, 2026 to 2036
- Toll Recovery
- Recovered Solvent Sale
- Closed-loop Service
- Toll Recovery
- Y-o-Y Growth Trend Analysis By Sales Model, 2021 to 2025
- Absolute $ Opportunity Analysis By Sales Model, 2026 to 2036
- Global Market Analysis and Forecast, By Region, 2021 to 2036
- Introduction
- Historical Market Size Value (USD Million) Analysis By Region, 2021 to 2025
- Current Market Size Value (USD Million) Analysis and Forecast By Region, 2026 to 2036
- North America
- Latin America
- Western Europe
- Eastern Europe
- East Asia
- South Asia and Pacific
- Middle East & Africa
- Market Attractiveness Analysis By Region
- North America Market Analysis and Forecast, By Country, 2021 to 2036
- Historical Market Size Value (USD Million) Trend Analysis By Market Taxonomy, 2021 to 2025
- Market Size Value (USD Million) Forecast By Market Taxonomy, 2026 to 2036
- By Country
- USA
- Canada
- By Solvent Type
- By Purity Grade
- By Recovery Method
- By End Use
- By Sales Model
- By Country
- Market Attractiveness Analysis
- By Country
- By Solvent Type
- By Purity Grade
- By Recovery Method
- By End Use
- By Sales Model
- Key Takeaways
- Latin America Market Analysis and Forecast, By Country
- Historical Market Size Value (USD Million) Trend Analysis By Market Taxonomy, 2021 to 2025
- Market Size Value (USD Million) Forecast By Market Taxonomy, 2026 to 2036
- By Country
- Brazil
- Mexico
- Chile
- Rest of Latin America
- By Solvent Type
- By Purity Grade
- By Recovery Method
- By End Use
- By Sales Model
- By Country
- Market Attractiveness Analysis
- By Country
- By Solvent Type
- By Purity Grade
- By Recovery Method
- By End Use
- By Sales Model
- Key Takeaways
- Western Europe Market Analysis and Forecast, By Country
- Historical Market Size Value (USD Million) Trend Analysis By Market Taxonomy, 2021 to 2025
- Market Size Value (USD Million) Forecast By Market Taxonomy, 2026 to 2036
- By Country
- Germany
- UK
- Italy
- Spain
- France
- Nordic
- BENELUX
- Rest of Western Europe
- By Solvent Type
- By Purity Grade
- By Recovery Method
- By End Use
- By Sales Model
- By Country
- Market Attractiveness Analysis
- By Country
- By Solvent Type
- By Purity Grade
- By Recovery Method
- By End Use
- By Sales Model
- Key Takeaways
- Eastern Europe Market Analysis and Forecast, By Country
- Historical Market Size Value (USD Million) Trend Analysis By Market Taxonomy, 2021 to 2025
- Market Size Value (USD Million) Forecast By Market Taxonomy, 2026 to 2036
- By Country
- Russia
- Poland
- Hungary
- Balkan & Baltic
- Rest of Eastern Europe
- By Solvent Type
- By Purity Grade
- By Recovery Method
- By End Use
- By Sales Model
- By Country
- Market Attractiveness Analysis
- By Country
- By Solvent Type
- By Purity Grade
- By Recovery Method
- By End Use
- By Sales Model
- Key Takeaways
- East Asia Market Analysis and Forecast, By Country
- Historical Market Size Value (USD Million) Trend Analysis By Market Taxonomy, 2021 to 2025
- Market Size Value (USD Million) Forecast By Market Taxonomy, 2026 to 2036
- By Country
- China
- Japan
- South Korea
- By Solvent Type
- By Purity Grade
- By Recovery Method
- By End Use
- By Sales Model
- By Country
- Market Attractiveness Analysis
- By Country
- By Solvent Type
- By Purity Grade
- By Recovery Method
- By End Use
- By Sales Model
- Key Takeaways
- South Asia and Pacific Market Analysis and Forecast, By Country
- Historical Market Size Value (USD Million) Trend Analysis By Market Taxonomy, 2021 to 2025
- Market Size Value (USD Million) Forecast By Market Taxonomy, 2026 to 2036
- By Country
- India
- ASEAN
- Australia & New Zealand
- Rest of South Asia and Pacific
- By Solvent Type
- By Purity Grade
- By Recovery Method
- By End Use
- By Sales Model
- By Country
- Market Attractiveness Analysis
- By Country
- By Solvent Type
- By Purity Grade
- By Recovery Method
- By End Use
- By Sales Model
- Key Takeaways
- Middle East & Africa Market Analysis and Forecast, By Country
- Historical Market Size Value (USD Million) Trend Analysis By Market Taxonomy, 2021 to 2025
- Market Size Value (USD Million) Forecast By Market Taxonomy, 2026 to 2036
- By Country
- Kingdom of Saudi Arabia
- Other GCC Countries
- Türkiye
- South Africa
- Other African Union
- Rest of Middle East & Africa
- By Solvent Type
- By Purity Grade
- By Recovery Method
- By End Use
- By Sales Model
- By Country
- Market Attractiveness Analysis
- By Country
- By Solvent Type
- By Purity Grade
- By Recovery Method
- By End Use
- By Sales Model
- Key Takeaways
- Key Countries Market Analysis
- USA
- Pricing Analysis
- Market Share Analysis, 2025
- By Solvent Type
- By Purity Grade
- By Recovery Method
- By End Use
- By Sales Model
- Canada
- Pricing Analysis
- Market Share Analysis, 2025
- By Solvent Type
- By Purity Grade
- By Recovery Method
- By End Use
- By Sales Model
- Mexico
- Pricing Analysis
- Market Share Analysis, 2025
- By Solvent Type
- By Purity Grade
- By Recovery Method
- By End Use
- By Sales Model
- Brazil
- Pricing Analysis
- Market Share Analysis, 2025
- By Solvent Type
- By Purity Grade
- By Recovery Method
- By End Use
- By Sales Model
- Chile
- Pricing Analysis
- Market Share Analysis, 2025
- By Solvent Type
- By Purity Grade
- By Recovery Method
- By End Use
- By Sales Model
- Germany
- Pricing Analysis
- Market Share Analysis, 2025
- By Solvent Type
- By Purity Grade
- By Recovery Method
- By End Use
- By Sales Model
- UK
- Pricing Analysis
- Market Share Analysis, 2025
- By Solvent Type
- By Purity Grade
- By Recovery Method
- By End Use
- By Sales Model
- Italy
- Pricing Analysis
- Market Share Analysis, 2025
- By Solvent Type
- By Purity Grade
- By Recovery Method
- By End Use
- By Sales Model
- Spain
- Pricing Analysis
- Market Share Analysis, 2025
- By Solvent Type
- By Purity Grade
- By Recovery Method
- By End Use
- By Sales Model
- France
- Pricing Analysis
- Market Share Analysis, 2025
- By Solvent Type
- By Purity Grade
- By Recovery Method
- By End Use
- By Sales Model
- India
- Pricing Analysis
- Market Share Analysis, 2025
- By Solvent Type
- By Purity Grade
- By Recovery Method
- By End Use
- By Sales Model
- ASEAN
- Pricing Analysis
- Market Share Analysis, 2025
- By Solvent Type
- By Purity Grade
- By Recovery Method
- By End Use
- By Sales Model
- Australia & New Zealand
- Pricing Analysis
- Market Share Analysis, 2025
- By Solvent Type
- By Purity Grade
- By Recovery Method
- By End Use
- By Sales Model
- China
- Pricing Analysis
- Market Share Analysis, 2025
- By Solvent Type
- By Purity Grade
- By Recovery Method
- By End Use
- By Sales Model
- Japan
- Pricing Analysis
- Market Share Analysis, 2025
- By Solvent Type
- By Purity Grade
- By Recovery Method
- By End Use
- By Sales Model
- South Korea
- Pricing Analysis
- Market Share Analysis, 2025
- By Solvent Type
- By Purity Grade
- By Recovery Method
- By End Use
- By Sales Model
- Russia
- Pricing Analysis
- Market Share Analysis, 2025
- By Solvent Type
- By Purity Grade
- By Recovery Method
- By End Use
- By Sales Model
- Poland
- Pricing Analysis
- Market Share Analysis, 2025
- By Solvent Type
- By Purity Grade
- By Recovery Method
- By End Use
- By Sales Model
- Hungary
- Pricing Analysis
- Market Share Analysis, 2025
- By Solvent Type
- By Purity Grade
- By Recovery Method
- By End Use
- By Sales Model
- Kingdom of Saudi Arabia
- Pricing Analysis
- Market Share Analysis, 2025
- By Solvent Type
- By Purity Grade
- By Recovery Method
- By End Use
- By Sales Model
- Türkiye
- Pricing Analysis
- Market Share Analysis, 2025
- By Solvent Type
- By Purity Grade
- By Recovery Method
- By End Use
- By Sales Model
- South Africa
- Pricing Analysis
- Market Share Analysis, 2025
- By Solvent Type
- By Purity Grade
- By Recovery Method
- By End Use
- By Sales Model
- USA
- Market Structure Analysis
- Competition Dashboard
- Competition Benchmarking
- Market Share Analysis of Top Players
- By Regional
- By Solvent Type
- By Purity Grade
- By Recovery Method
- By End Use
- By Sales Model
- Emerging Startups
- Innovation Benchmarking
- Competition Analysis
- Competition Deep Dive
- Clean Harbors
- Overview
- Product Portfolio
- Profitability by Market Segments
- Sales Footprint
- Strategy Overview
- Marketing Strategy
- Product Strategy
- Channel Strategy
- Veolia
- Tradebe
- SUEZ
- Maratek Environmental
- Hydrite Chemical
- SEQENS
- Octane Chemicals
- Clean Harbors
- Case Studies
- Success Stories
- Recent Developments
- Competition Deep Dive
- Assumptions & Acronyms Used


