Refrigeration Oil Market Size and Share Forecast Outlook 2025 to 2035

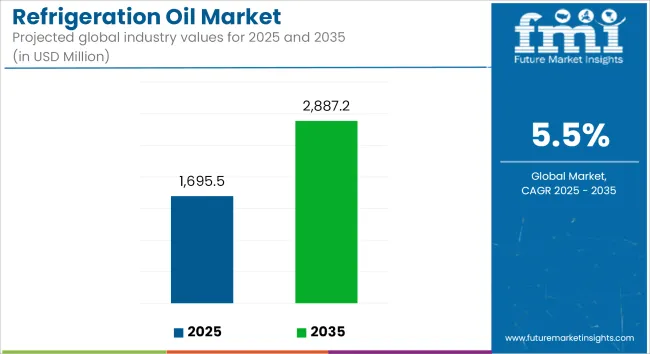
The global refrigeration oil market is projected to grow from USD 1,695.5 million in 2025 to USD 2,887.2 million by 2035, reflecting a CAGR of 5.5% over the forecast period. Growth is being supported by increased deployment of energy-efficient cooling systems, expansion of cold chain infrastructure, and a shift toward environmentally compliant refrigeration technologies.
Quick Stats for the Refrigeration Oil Market

  • Industry Value (2025): USD 1,695.5 million
  • Forecast Value (2035): USD 2,887.2 million
  • Forecast CAGR: 5.5%
  • Leading Segment in 2025: Chillers (19% share)
  • Key Growth Region: Urban centers with hot climates and cold chain infrastructure (e.g., Asia-Pacific, Middle East)
  • Top Key Players: Shell, ExxonMobil, Idemitsu Kosan, FUCHS, Lanxess, CPI Fluid Engineering
Metric Value
Industry Size (2025E) USD 1,695.5 million
Industry Value (2035F) USD 2,887.2 million
CAGR (2025 to 2035) 5.5%

Refrigeration oil is being used to lubricate compressors in cooling and air-conditioning systems, ensuring smooth operation, minimizing friction, and facilitating heat dissipation. As refrigerant regulations tighten globally, synthetic oils compatible with low-GWP (Global Warming Potential) refrigerants are being adopted in commercial and industrial cooling applications. These oils are being formulated to perform under the thermodynamic requirements of advanced refrigerant blends, particularly HFOs (hydrofluoroolefins).

Cold storage and logistics applications are contributing significantly to demand. Pharmaceutical storage, food preservation, and perishable goods transport are being expanded across regions, driving new installations of refrigeration systems and associated lubricant consumption. In commercial buildings, HVAC retrofits and new system installations are being encouraged by government efficiency mandates and urban development initiatives.

In the manufacturing sector, industrial refrigeration units are being upgraded with next-generation oils designed for improved thermal and oxidative stability. Equipment downtime is being reduced through enhanced lubrication, which is contributing to higher system uptime and reduced maintenance costs. Synthetic refrigeration oils, such as POE (polyol ester) and PAG (polyalkylene glycol) types, are being favored for their compatibility with HFC alternatives and their extended service life.

Technological advancements in refrigeration oil are being observed in the development of nanotechnology-enhanced lubricants, which offer improved thermal conductivity and load-bearing capacity. Research is also being directed toward smart oils that can monitor wear or degradation characteristics through embedded additives, aligning with the growing use of IoT and AI-enabled monitoring systems in refrigeration equipment.

The refrigeration oil market is expected to continue expanding steadily as refrigerant transitions progress and sustainability goals influence equipment specifications. New refrigerant-oil pairings, improved compressor designs, and broader integration of predictive maintenance systems are expected to support demand in near future.

Analyzing Refrigeration Oil Market by Top Investment Segments

Chillers are expected to account for significant application demand due to their widespread use in industrial cooling and HVAC systems

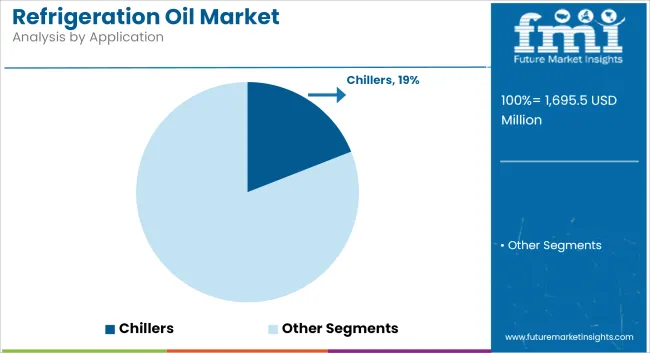
Chillers are projected to hold approximately 19% of the global refrigeration oil market share in 2025 and are expected to grow at a CAGR of 5.6% through 2035. These systems are extensively used in commercial buildings, process industries, and data centers, where efficient heat removal is essential for operational stability.

Refrigeration oils play a key role in lubricating compressors within chillers, improving system reliability and reducing energy consumption. As the global demand for cooling infrastructure increases, particularly in hot-climate urban centers and cold chain logistics, the need for high-performance oils designed for continuous operation and thermal stability continues to rise.
Hydro-fluorocarbon (HFC) refrigerants are projected to lead refrigerant-type compatibility demand despite regulatory pressure, due to existing installed base

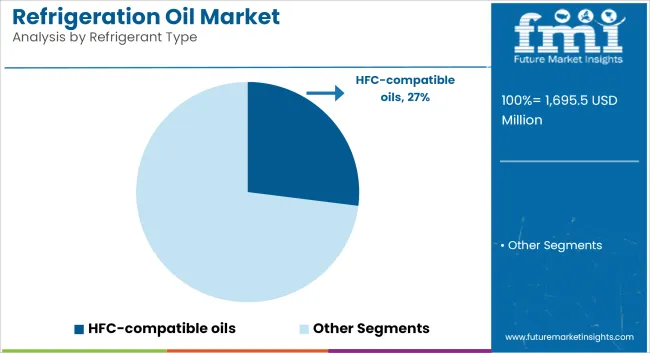
HFC-compatible refrigeration oils are estimated to account for approximately 27% of the global market share in 2025 and are projected to grow at a CAGR of 5.4% through 2035. Oils formulated for HFC refrigerants such as R-134a and R-410A are widely used across air conditioning, supermarket refrigeration, and transport cooling systems.

While HFCs are being gradually phased down in some regions due to their high global warming potential (GWP), the substantial existing infrastructure continues to support demand for compatible synthetic oils such as POE (polyol ester) and PAG (polyalkylene glycol). As OEMs and service providers balance regulatory transition and maintenance of legacy systems, the HFC segment is expected to retain relevance in the medium term across developed and developing economies.
Challenges

Stringent Environmental Regulations on Refrigerants and Lubricants

The most significant challenge in handling refrigeration oils is the fact that they are subjected to stringent environmental regulations on refrigerants and lubricants. The manufacturers are being forced to change from high-GWP refrigerants, such as HFCs and HCFCs, to more ecological mixtures of lubricants, including some with vegetable oil being additionally added.

On the other hand, the transformation into eco-friendly refrigerants inevitably causes the need for the reformulation of refrigeration oils, which is a difficult issue with respect to the performance, cost, and supply chain adjustments. Adaptation to changing environmental regulations in different geographies can be complicated and result in hurdles to product development and marketing.

High Costs Associated with Synthetic Refrigeration Oils

Synthetic refrigeration oils, despite their excellent performance, are produced and applied with costs that are higher than mineral-based refrigeration oils. This cost factor restricts the market in price-sensitive industries and developing countries which remain a key problem.

The synthetic lubricants raw material price alternations have a direct impact on the market and have brought about instability for the producers and consumers. As a result, many companies have resulted in concentrating on methods which lower the cost of production, developing localized supply chains, and offering hybrid lube options to aid market affordability and accessibility.

Opportunities

Advancements in Smart Refrigeration and AI-Based Lubrication Monitoring

The connection of smart refrigeration systems to AI-based lubrication monitoring is creating exclusivity in the refrigeration oil market. The new cooling system trend with the digital tools and automated lubrication control, together with predictive maintenance, has broadened the horizon of the industry for an easy-to-use and energy-efficient solution.

The IoT solutions that allow for the securing of HVAC systems and refrigeration energy efficiency in a real-time manner also cover the performance of lubrication, viscosity levels, and oil lifetime. The developments in this area promise to knock the market for the fresh round of next-gen revision oils that are developed for smart, connected cooling applications.

Growing Demand in Data Centers, Cold Chain Logistics, and Green Buildings

The demand for high-performance refrigeration oils is on the rise as data centers are being built, logistic cold chains are expanding, and green building initiatives are being implemented more and more. The digitalization and cloud computing industries are driving the investments in data center cooling systems where high-efficiency lubrication is a critical factor for operational reliability.

The global concentration on food security and pharmaceutical cold storage has also a role to play in the market expansion, as the industries are investing in the sustainable and energy-efficient refrigeration solutions. Furthermore, the embrace of the green building with smart HVAC systems is endorsing the low-emission, high-efficiency refrigeration oils and so the continuity in the market growth.

Country -Wise Analysis

United States

The refrigeration oil sector in the United States is at a steady increase because of the growth in cold storage facilities, the tendency of using more energy-efficient HVAC systems, and more food processing industries. The increase in e-commerce grocery delivery services is a factor that drives the demand for commercial refrigeration systems, which in turn raises the request for high-performance refrigeration oils.

EPA laws on refrigerants and energy efficiency standards are compelling manufacturers to make low-global-warming-potential (GWP) plus environmentally friendly refrigeration oils. The pharmaceutical cold chain is the one that is now extending.

This type of cold chain is important in storing temperature-sensitive vaccines and biologics, which are now needed more than ever-high-stability refrigeration lubricants. In the term of use and application of synthetic refrigerants, the focus is shifting from achieving lower GWP to providing more stability to the component in the operating temperature range.

  • Expansion in Cold Storage Facilities & E-Commerce Grocery Delivery: Upturn in warehousing refrigeration oil.
  • EPA Regulations Drive Low-GWP & Eco-Friendly Refrigeration Oils: Adoption of next-gen synthetic oils has increased.
  • Growth of Pharmaceutical Cold Chain Operations & Storage of Vaccines: The need for high-performance oils is increasing in medical cooling systems.
  • Rising Energy-Efficiency Standard in HVACR & Refrigeration Systems: Use of low-friction, high-thermal oils is increased.
  • Technological Developments in Synthetic Refrigeration Oils: The lubricant industry with higher durability and performance for industrial use is showing an increase of production.
Country CAGR (2025 to 2035)
United States 5.7%

United Kingdom

The market for refrigeration oil in the United Kingdom is currently on the rise. This is mainly due to the increased embrace of eco-friendly refrigeration, the low refrigerant fluid regulations, and the expansion of retail refrigeration which are among the main drivers. The government is supporting the use of such systems with its Net Zero 2050 goals, which results in a higher demand for synthetic, eco-friendly refrigeration oils.

The rapid online grocery and food retail growth in the UK is a major factor contributing to this. As more supermarkets and distribution centers are turning to high-efficiency refrigeration units, the demand for grade A refrigeration oils are further elevated.

Some of the HVAC automation's latest developments and the smart cooling technologies lead to higher integration of the low-viscosity synthetic oils among the intelligent cooling systems which, therefore, tend to work more effectively and use less energy.

  • UK Net Zero 2050 regulations reduce the use of high GWP fluids: More low-GWP lubricants are used.
  • The online grocery and food retail sector expansion is the reason for increased cold storage needs: More refrigeration oils in supermarket cooling systems.
  • The developments in smart HVAC and automated cooling systems: The higher demand for synthetic oils that enhance the efficiency of energy.
  • The pharmaceutical and medical refrigeration applications are on the rise: The adoption of vaccine and biologic cold chain storage is increasing.
  • The popularity of synthetic oils that provide a longer lifetime and more thermal stability is increasing: The use of premium synthetic lubricants is valued more.
Country CAGR (2025 to 2035)
United Kingdom 5.3%

European Union

The European Union refrigeration oil market is steadily increasing its size with adverse environmental conditions such as refrigerant emission, along with the surging food cold chain industry, and the growing acceptance of renewable energy-powered cooling systems mainly through the help of IG-U environmental controls of the F-Gas Regulation, which envisages the gradual elimination of high-GWP refrigerants, thus causing industries to adapt to synthetic refrigeration oils that are compatible with next-gen refrigerants.

Industrial refrigeration lubricants are receiving a push from food & beverage processing sector growth especially in Germany, France, and Italy. The utilization of solar-assisted and CO₂-based refrigeration systems creates bio-based and ultra-low-viscosity refrigeration oils which means a higher innovation rate.

The emergence of LEED projects and district cooling plans in cities is making the use of high-efficiency lubricants in HVAC systems for commercial buildings more common place.

  • EU F-Gas Regulation The action of Phasing Out High-GWP Refrigerants: The need for synthetic oils which are less harmful to the environment is increasing.
  • Expansion of Food & Beverage Cold Chain & Processing Industry: The industrial refrigeration oil consumption is on the rise.
  • Rising Adoption of CO₂-Based & Solar-Powered Refrigeration Systems: The need for specialized refrigeration lubricants is greater.
  • Development of Green Building & District Cooling Project: The energy-saving HVACs and refrigeration units applications have been gaining in the market.
  • Advancements in Bio-Based & Low-Viscosity Refrigeration Oils: The improvement in the lubrication with environment-friendly technologies has been successful.
Region CAGR (2025 to 2035)
European Union 5.5%

Japan

The Japan refrigeration oil market is on the rise because of the installation of advanced HVAC systems, the growing trend of low-GWP refrigerants, and the increasing demand for semiconductor and electronics cooling applications. Japan's leading manufacturing and semiconductor sectors are deeply in need of high-performance refrigeration oils and usually use them for precision cooling.

The surge in electric vehicle (EV) battery cooling devices is a primary factor for the demand of ultra-low-density refrigeration oils, which therefore improves thermal management in battery packs. Synthetic and biodegradable refrigeration oils are gaining higher ground due to the strict environmental laws imposed by Japan.

The ongoing development of zero-energy buildings (ZEBs) and district cooling systems is yet another factor that fuels the market with energy-efficient lubes in smart HVAC applications.

  • Strengthening Japan's Semiconductor & Electronics Cooling Sector: Rise in demand for precision refrigeration oils.
  • EV Battery Showcases Thermal Management: Use of low-viscosity refrigeration oils for battery cooling.
  • Strict Environmental Regulations Promote Low-GWP Refrigeration Lubricants: Fostering synthetic and biodegradable refrigeration oils.
  • Innovations in Smart HVAC & Intelligent Cooling Systems: New age refrigerant oil formulations progress.
  • Installation of Zero-Energy Buildings (ZEBs) & District Cooling Projects: Rise in the adoption of urban commercial buildings.
Country CAGR (2025 to 2035)
Japan 5.2%

South Korea

The refrigeration oil market in South Korea is showing a consistent uptrend, driven by the expansion of cold chain logistics, increased production of semiconductors, and the launch of green HVAC systems. Among these factors, it is the launching of e-commerce and the food delivery business that is pushing the demand for temperature-controlled warehouses, which, in turn, is leading to increased sales of the high-efficiency refrigeration oils.

With South Korea becoming the key player in the production of semiconductors and display panels, there is a growing extra demand for specialized refrigeration oils that are utilized in precision cooling systems in cleanroom environments.

Besides, the government's drive to cut down the carbon emissions that result from the HVAC and industrial refrigeration units is affirming the switch to lubricants that are compatible with the refrigerants of low GWP.

  • Expansion of Cold Chain Logistics & Food Delivery Services: Higher adoption of refrigeration oils in commercial cold storage.
  • Growth of Semiconductor & Display Manufacturing Industries: Increased use of high-performance oils in precision cooling systems.
  • Government Policies Encouraging Low-Emission HVAC Technologies: Growth in synthetic and eco-friendly refrigeration oils.
  • Advancements in Smart Refrigeration Systems & AI-Enabled Cooling Solutions: Increased demand for low-viscosity, long-lasting oils.
  • Increasing Demand for Energy-Efficient Lubricants in Industrial Refrigeration: Rising adoption of premium refrigeration oils in manufacturing plants.
Country CAGR (2025 to 2035)
South Korea 5.4%

Competitive Outlook

The refrigeration oil market is becoming more competitive as companies develop environmentally sustainable oils compatible with low-GWP refrigerants. Focus is on enhancing thermal stability, chemical resistance, and energy efficiency, which improve system performance, reduce emissions, and boost compressor efficiency. These innovations align with global climate goals and address the evolving needs of modern refrigeration systems.
  • In November 2024, LANXESS was reported to have launched EVEREST™ ESR 220, an environmentally sustainable refrigeration lubricant formulated for systems using low-GWP refrigerants. The oil was developed to deliver high thermal and chemical stability, extended equipment life, and compatibility with new-generation refrigerants. It was stated that the product supports global climate targets by reducing indirect emissions and improving compressor efficiency.
  • In February 2024, Kixx Oil was reported to have introduced a refrigeration oil formulated for low-GWP refrigerants, aimed at commercial and industrial cooling systems. The product was developed to offer improved miscibility, thermal stability, and energy efficiency when paired with hydrofluoroolefins (HFOs) and other climate-friendly refrigerants. It was stated that the lubricant reduces system wear and enhances long-term reliability in climate control applications.

Companies

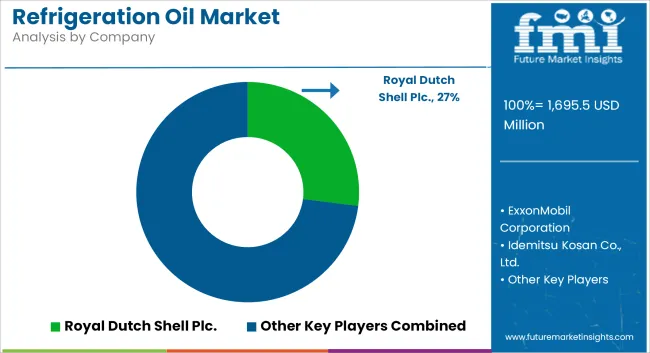
  • Royal Dutch Shell Plc.
  • ExxonMobil Corporation
  • Idemitsu Kosan Co., Ltd.
  • FUCHS Lubricants
  • Lanxess
  • MEIWA CORPORATION
  • CPI Fluid Engineering
  • Chevron Phillips Chemical Company LLC

Key Segments

By Product Type:

  • Mineral Oil
  • Synthetic Oil
    • Polyol Ester
    • Poly Alpha Olefin
    • Alkyl Benzene
    • Polyalkylene Glycol
    • Polyvinyl ether
    • Others (Phenol Propoxylate oil etc.)

By Refrigerant Type:

  • Chlorofluorocarbon (CFC)
  • Hydro-chlorofluorocarbon (HCFC)
  • Hydro-fluorocarbon (HFC)
  • Ammonia
  • Others

By Application:

  • Air Conditioners
  • Coolers
  • Chillers
  • Refrigerators/ Freezers
  • Condensers
  • Others (Ice Machines etc.)

By End Use:

  • Industrial
  • Commercial
  • Residential

By Region:

  • North America
  • Latin America
  • Eastern Europe
  • Western Europe
  • South Asia & Pacific
  • East Asia
  • Middle East & Africa

Table of Content

  1. Executive Summary
  2. Industry Introduction, including Taxonomy and Market Definition
  3. Market Trends and Success Factors, including Macro-economic Factors, Market Dynamics, and Recent Industry Developments
  4. Global Market Demand Analysis 2020 to 2024 and Forecast 2025 to 2035, including Historical Analysis and Future Projections
  5. Pricing Analysis
  6. Global Market Analysis 2020 to 2024 and Forecast 2025 to 2035
    • Product Type
    • Refrigerant Type
    • End Users
    • Application
  7. Global Market Analysis 2020 to 2024 and Forecast 2025 to 2035, By Product Type
    • Mineral Oil
    • Synthetic Oil
      • Polyol Ester
      • Poly Alpha Olefin
      • Alkyl Benzene
      • Polyethylene Glycol
      • Polyvinyl Ether
      • Others (Phenol Propoxylate Oil)
  8. Global Market Analysis 2020 to 2024 and Forecast 2025 to 2035, By Refrigerant Type
    • Chlorofluorocarbon (CFC)
    • Hydro-chlorofluorocarbon (HCFC)
    • Hydro-fluorocarbon (HFC)
    • Ammonia
    • Others
  9. Global Market Analysis 2020 to 2024 and Forecast 2025 to 2035, By End Users
    • Industrial
    • Commercial
    • Residential
  10. Global Market Analysis 2020 to 2024 and Forecast 2025 to 2035, By Application
    • Air Conditioners
    • Coolers
    • Chillers
    • Refrigerators/Freezers
    • Condensers
    • Others (Ice Machines, etc.)
  11. Global Market Analysis 2020 to 2024 and Forecast 2025 to 2035, By Region
    • North America
    • Latin America
    • Western Europe
    • Eastern Europe
    • East Asia
    • South Asia Pacific
    • Middle East and Africa
  12. North America Sales Analysis 2020 to 2024 and Forecast 2025 to 2035, by Key Segments and Countries
  13. Latin America Sales Analysis 2020 to 2024 and Forecast 2025 to 2035, by Key Segments and Countries
  14. Western Europe Sales Analysis 2020 to 2024 and Forecast 2025 to 2035, by Key Segments and Countries
  15. Eastern Europe Sales Analysis 2020 to 2024 and Forecast 2025 to 2035, by Key Segments and Countries
  16. East Asia Sales Analysis 2020 to 2024 and Forecast 2025 to 2035, by Key Segments and Countries
  17. South Asia Pacific Sales Analysis 2020 to 2024 and Forecast 2025 to 2035, by Key Segments and Countries
  18. Middle East and Africa Sales Analysis 2020 to 2024 and Forecast 2025 to 2035, by Key Segments and Countries
  19. Sales Forecast 2025 to 2035 by Product Type, Refrigerant Type, End Users, and Application for 30 Countries
  20. Competition Outlook, including Market Structure Analysis, Company Share Analysis by Key Players, and Competition Dashboard
  21. Company Profile
    • Chevron Corporation
    • BP Plc (Castrol Lubricants)
    • ENEOS Corporation
    • China Petroleum & Chemical Corporation (Sinopec)
    • Klüber Lubrication GmbH & Co. KG
    • Lubrizol Corporation
    • Petro-Canada Lubricants Inc.
    • Indian Oil Corporation
    • Phillips 66 Company
    • Sunoco LP
    • Other Major Players

List of Tables

  • Table 1: Global Market Value (USD Million) Forecast by Region, 2020 to 2035
  • Table 2: Global Market Volume (Tons) Forecast by Region, 2020 to 2035
  • Table 3: Global Market Value (USD Million) Forecast by Product Type, 2020 to 2035
  • Table 4: Global Market Volume (Tons) Forecast by Product Type, 2020 to 2035
  • Table 5: Global Market Value (USD Million) Forecast by Refrigerant Type, 2020 to 2035
  • Table 6: Global Market Volume (Tons) Forecast by Refrigerant Type, 2020 to 2035
  • Table 7: Global Market Value (USD Million) Forecast by End User, 2020 to 2035
  • Table 8: Global Market Volume (Tons) Forecast by End User, 2020 to 2035
  • Table 9: Global Market Value (USD Million) Forecast by Application, 2020 to 2035
  • Table 10: Global Market Volume (Tons) Forecast by Application, 2020 to 2035
  • Table 11: North America Market Value (USD Million) Forecast by Country, 2020 to 2035
  • Table 12: North America Market Volume (Tons) Forecast by Country, 2020 to 2035
  • Table 13: North America Market Value (USD Million) Forecast by Product Type, 2020 to 2035
  • Table 14: North America Market Volume (Tons) Forecast by Product Type, 2020 to 2035
  • Table 15: North America Market Value (USD Million) Forecast by Refrigerant Type, 2020 to 2035
  • Table 16: North America Market Volume (Tons) Forecast by Refrigerant Type, 2020 to 2035
  • Table 17: North America Market Value (USD Million) Forecast by End User, 2020 to 2035
  • Table 18: North America Market Volume (Tons) Forecast by End User, 2020 to 2035
  • Table 19: North America Market Value (USD Million) Forecast by Application, 2020 to 2035
  • Table 20: North America Market Volume (Tons) Forecast by Application, 2020 to 2035
  • Table 21: Latin America Market Value (USD Million) Forecast by Country, 2020 to 2035
  • Table 22: Latin America Market Volume (Tons) Forecast by Country, 2020 to 2035
  • Table 23: Latin America Market Value (USD Million) Forecast by Product Type, 2020 to 2035
  • Table 24: Latin America Market Volume (Tons) Forecast by Product Type, 2020 to 2035
  • Table 25: Latin America Market Value (USD Million) Forecast by Refrigerant Type, 2020 to 2035
  • Table 26: Latin America Market Volume (Tons) Forecast by Refrigerant Type, 2020 to 2035
  • Table 27: Latin America Market Value (USD Million) Forecast by End User, 2020 to 2035
  • Table 28: Latin America Market Volume (Tons) Forecast by End User, 2020 to 2035
  • Table 29: Latin America Market Value (USD Million) Forecast by Application, 2020 to 2035
  • Table 30: Latin America Market Volume (Tons) Forecast by Application, 2020 to 2035
  • Table 31: Western Europe Market Value (USD Million) Forecast by Country, 2020 to 2035
  • Table 32: Western Europe Market Volume (Tons) Forecast by Country, 2020 to 2035
  • Table 33: Western Europe Market Value (USD Million) Forecast by Product Type, 2020 to 2035
  • Table 34: Western Europe Market Volume (Tons) Forecast by Product Type, 2020 to 2035
  • Table 35: Western Europe Market Value (USD Million) Forecast by Refrigerant Type, 2020 to 2035
  • Table 36: Western Europe Market Volume (Tons) Forecast by Refrigerant Type, 2020 to 2035
  • Table 37: Western Europe Market Value (USD Million) Forecast by End User, 2020 to 2035
  • Table 38: Western Europe Market Volume (Tons) Forecast by End User, 2020 to 2035
  • Table 39: Western Europe Market Value (USD Million) Forecast by Application, 2020 to 2035
  • Table 40: Western Europe Market Volume (Tons) Forecast by Application, 2020 to 2035
  • Table 41: Eastern Europe Market Value (USD Million) Forecast by Country, 2020 to 2035
  • Table 42: Eastern Europe Market Volume (Tons) Forecast by Country, 2020 to 2035
  • Table 43: Eastern Europe Market Value (USD Million) Forecast by Product Type, 2020 to 2035
  • Table 44: Eastern Europe Market Volume (Tons) Forecast by Product Type, 2020 to 2035
  • Table 45: Eastern Europe Market Value (USD Million) Forecast by Refrigerant Type, 2020 to 2035
  • Table 46: Eastern Europe Market Volume (Tons) Forecast by Refrigerant Type, 2020 to 2035
  • Table 47: Eastern Europe Market Value (USD Million) Forecast by End User, 2020 to 2035
  • Table 48: Eastern Europe Market Volume (Tons) Forecast by End User, 2020 to 2035
  • Table 49: Eastern Europe Market Value (USD Million) Forecast by Application, 2020 to 2035
  • Table 50: Eastern Europe Market Volume (Tons) Forecast by Application, 2020 to 2035
  • Table 51: South Asia and Pacific Market Value (USD Million) Forecast by Country, 2020 to 2035
  • Table 52: South Asia and Pacific Market Volume (Tons) Forecast by Country, 2020 to 2035
  • Table 53: South Asia and Pacific Market Value (USD Million) Forecast by Product Type, 2020 to 2035
  • Table 54: South Asia and Pacific Market Volume (Tons) Forecast by Product Type, 2020 to 2035
  • Table 55: South Asia and Pacific Market Value (USD Million) Forecast by Refrigerant Type, 2020 to 2035
  • Table 56: South Asia and Pacific Market Volume (Tons) Forecast by Refrigerant Type, 2020 to 2035
  • Table 57: South Asia and Pacific Market Value (USD Million) Forecast by End User, 2020 to 2035
  • Table 58: South Asia and Pacific Market Volume (Tons) Forecast by End User, 2020 to 2035
  • Table 59: South Asia and Pacific Market Value (USD Million) Forecast by Application, 2020 to 2035
  • Table 60: South Asia and Pacific Market Volume (Tons) Forecast by Application, 2020 to 2035
  • Table 61: East Asia Market Value (USD Million) Forecast by Country, 2020 to 2035
  • Table 62: East Asia Market Volume (Tons) Forecast by Country, 2020 to 2035
  • Table 63: East Asia Market Value (USD Million) Forecast by Product Type, 2020 to 2035
  • Table 64: East Asia Market Volume (Tons) Forecast by Product Type, 2020 to 2035
  • Table 65: East Asia Market Value (USD Million) Forecast by Refrigerant Type, 2020 to 2035
  • Table 66: East Asia Market Volume (Tons) Forecast by Refrigerant Type, 2020 to 2035
  • Table 67: East Asia Market Value (USD Million) Forecast by End User, 2020 to 2035
  • Table 68: East Asia Market Volume (Tons) Forecast by End User, 2020 to 2035
  • Table 69: East Asia Market Value (USD Million) Forecast by Application, 2020 to 2035
  • Table 70: East Asia Market Volume (Tons) Forecast by Application, 2020 to 2035
  • Table 71: Middle East and Africa Market Value (USD Million) Forecast by Country, 2020 to 2035
  • Table 72: Middle East and Africa Market Volume (Tons) Forecast by Country, 2020 to 2035
  • Table 73: Middle East and Africa Market Value (USD Million) Forecast by Product Type, 2020 to 2035
  • Table 74: Middle East and Africa Market Volume (Tons) Forecast by Product Type, 2020 to 2035
  • Table 75: Middle East and Africa Market Value (USD Million) Forecast by Refrigerant Type, 2020 to 2035
  • Table 76: Middle East and Africa Market Volume (Tons) Forecast by Refrigerant Type, 2020 to 2035
  • Table 77: Middle East and Africa Market Value (USD Million) Forecast by End User, 2020 to 2035
  • Table 78: Middle East and Africa Market Volume (Tons) Forecast by End User, 2020 to 2035
  • Table 79: Middle East and Africa Market Value (USD Million) Forecast by Application, 2020 to 2035
  • Table 80: Middle East and Africa Market Volume (Tons) Forecast by Application, 2020 to 2035

List of Figures

  • Figure 1: Global Market Value (USD Million) by Product Type, 2025 to 2035
  • Figure 2: Global Market Value (USD Million) by Refrigerant Type, 2025 to 2035
  • Figure 3: Global Market Value (USD Million) by End User, 2025 to 2035
  • Figure 4: Global Market Value (USD Million) by Application, 2025 to 2035
  • Figure 5: Global Market Value (USD Million) by Region, 2025 to 2035
  • Figure 6: Global Market Value (USD Million) Analysis by Region, 2020 to 2035
  • Figure 7: Global Market Volume (Tons) Analysis by Region, 2020 to 2035
  • Figure 8: Global Market Value Share (%) and BPS Analysis by Region, 2025 to 2035
  • Figure 9: Global Market Y-o-Y Growth (%) Projections by Region, 2025 to 2035
  • Figure 10: Global Market Value (USD Million) Analysis by Product Type, 2020 to 2035
  • Figure 11: Global Market Volume (Tons) Analysis by Product Type, 2020 to 2035
  • Figure 12: Global Market Value Share (%) and BPS Analysis by Product Type, 2025 to 2035
  • Figure 13: Global Market Y-o-Y Growth (%) Projections by Product Type, 2025 to 2035
  • Figure 14: Global Market Value (USD Million) Analysis by Refrigerant Type, 2020 to 2035
  • Figure 15: Global Market Volume (Tons) Analysis by Refrigerant Type, 2020 to 2035
  • Figure 16: Global Market Value Share (%) and BPS Analysis by Refrigerant Type, 2025 to 2035
  • Figure 17: Global Market Y-o-Y Growth (%) Projections by Refrigerant Type, 2025 to 2035
  • Figure 18: Global Market Value (USD Million) Analysis by End User, 2020 to 2035
  • Figure 19: Global Market Volume (Tons) Analysis by End User, 2020 to 2035
  • Figure 20: Global Market Value Share (%) and BPS Analysis by End User, 2025 to 2035
  • Figure 21: Global Market Y-o-Y Growth (%) Projections by End User, 2025 to 2035
  • Figure 22: Global Market Value (USD Million) Analysis by Application, 2020 to 2035
  • Figure 23: Global Market Volume (Tons) Analysis by Application, 2020 to 2035
  • Figure 24: Global Market Value Share (%) and BPS Analysis by Application, 2025 to 2035
  • Figure 25: Global Market Y-o-Y Growth (%) Projections by Application, 2025 to 2035
  • Figure 26: Global Market Attractiveness by Product Type, 2025 to 2035
  • Figure 27: Global Market Attractiveness by Refrigerant Type, 2025 to 2035
  • Figure 28: Global Market Attractiveness by End User, 2025 to 2035
  • Figure 29: Global Market Attractiveness by Application, 2025 to 2035
  • Figure 30: Global Market Attractiveness by Region, 2025 to 2035
  • Figure 31: North America Market Value (USD Million) by Product Type, 2025 to 2035
  • Figure 32: North America Market Value (USD Million) by Refrigerant Type, 2025 to 2035
  • Figure 33: North America Market Value (USD Million) by End User, 2025 to 2035
  • Figure 34: North America Market Value (USD Million) by Application, 2025 to 2035
  • Figure 35: North America Market Value (USD Million) by Country, 2025 to 2035
  • Figure 36: North America Market Value (USD Million) Analysis by Country, 2020 to 2035
  • Figure 37: North America Market Volume (Tons) Analysis by Country, 2020 to 2035
  • Figure 38: North America Market Value Share (%) and BPS Analysis by Country, 2025 to 2035
  • Figure 39: North America Market Y-o-Y Growth (%) Projections by Country, 2025 to 2035
  • Figure 40: North America Market Value (USD Million) Analysis by Product Type, 2020 to 2035
  • Figure 41: North America Market Volume (Tons) Analysis by Product Type, 2020 to 2035
  • Figure 42: North America Market Value Share (%) and BPS Analysis by Product Type, 2025 to 2035
  • Figure 43: North America Market Y-o-Y Growth (%) Projections by Product Type, 2025 to 2035
  • Figure 44: North America Market Value (USD Million) Analysis by Refrigerant Type, 2020 to 2035
  • Figure 45: North America Market Volume (Tons) Analysis by Refrigerant Type, 2020 to 2035
  • Figure 46: North America Market Value Share (%) and BPS Analysis by Refrigerant Type, 2025 to 2035
  • Figure 47: North America Market Y-o-Y Growth (%) Projections by Refrigerant Type, 2025 to 2035
  • Figure 48: North America Market Value (USD Million) Analysis by End User, 2020 to 2035
  • Figure 49: North America Market Volume (Tons) Analysis by End User, 2020 to 2035
  • Figure 50: North America Market Value Share (%) and BPS Analysis by End User, 2025 to 2035
  • Figure 51: North America Market Y-o-Y Growth (%) Projections by End User, 2025 to 2035
  • Figure 52: North America Market Value (USD Million) Analysis by Application, 2020 to 2035
  • Figure 53: North America Market Volume (Tons) Analysis by Application, 2020 to 2035
  • Figure 54: North America Market Value Share (%) and BPS Analysis by Application, 2025 to 2035
  • Figure 55: North America Market Y-o-Y Growth (%) Projections by Application, 2025 to 2035
  • Figure 56: North America Market Attractiveness by Product Type, 2025 to 2035
  • Figure 57: North America Market Attractiveness by Refrigerant Type, 2025 to 2035
  • Figure 58: North America Market Attractiveness by End User, 2025 to 2035
  • Figure 59: North America Market Attractiveness by Application, 2025 to 2035
  • Figure 60: North America Market Attractiveness by Country, 2025 to 2035
  • Figure 61: Latin America Market Value (USD Million) by Product Type, 2025 to 2035
  • Figure 62: Latin America Market Value (USD Million) by Refrigerant Type, 2025 to 2035
  • Figure 63: Latin America Market Value (USD Million) by End User, 2025 to 2035
  • Figure 64: Latin America Market Value (USD Million) by Application, 2025 to 2035
  • Figure 65: Latin America Market Value (USD Million) by Country, 2025 to 2035
  • Figure 66: Latin America Market Value (USD Million) Analysis by Country, 2020 to 2035
  • Figure 67: Latin America Market Volume (Tons) Analysis by Country, 2020 to 2035
  • Figure 68: Latin America Market Value Share (%) and BPS Analysis by Country, 2025 to 2035
  • Figure 69: Latin America Market Y-o-Y Growth (%) Projections by Country, 2025 to 2035
  • Figure 70: Latin America Market Value (USD Million) Analysis by Product Type, 2020 to 2035
  • Figure 71: Latin America Market Volume (Tons) Analysis by Product Type, 2020 to 2035
  • Figure 72: Latin America Market Value Share (%) and BPS Analysis by Product Type, 2025 to 2035
  • Figure 73: Latin America Market Y-o-Y Growth (%) Projections by Product Type, 2025 to 2035
  • Figure 74: Latin America Market Value (USD Million) Analysis by Refrigerant Type, 2020 to 2035
  • Figure 75: Latin America Market Volume (Tons) Analysis by Refrigerant Type, 2020 to 2035
  • Figure 76: Latin America Market Value Share (%) and BPS Analysis by Refrigerant Type, 2025 to 2035
  • Figure 77: Latin America Market Y-o-Y Growth (%) Projections by Refrigerant Type, 2025 to 2035
  • Figure 78: Latin America Market Value (USD Million) Analysis by End User, 2020 to 2035
  • Figure 79: Latin America Market Volume (Tons) Analysis by End User, 2020 to 2035
  • Figure 80: Latin America Market Value Share (%) and BPS Analysis by End User, 2025 to 2035
  • Figure 81: Latin America Market Y-o-Y Growth (%) Projections by End User, 2025 to 2035
  • Figure 82: Latin America Market Value (USD Million) Analysis by Application, 2020 to 2035
  • Figure 83: Latin America Market Volume (Tons) Analysis by Application, 2020 to 2035
  • Figure 84: Latin America Market Value Share (%) and BPS Analysis by Application, 2025 to 2035
  • Figure 85: Latin America Market Y-o-Y Growth (%) Projections by Application, 2025 to 2035
  • Figure 86: Latin America Market Attractiveness by Product Type, 2025 to 2035
  • Figure 87: Latin America Market Attractiveness by Refrigerant Type, 2025 to 2035
  • Figure 88: Latin America Market Attractiveness by End User, 2025 to 2035
  • Figure 89: Latin America Market Attractiveness by Application, 2025 to 2035
  • Figure 90: Latin America Market Attractiveness by Country, 2025 to 2035
  • Figure 91: Western Europe Market Value (USD Million) by Product Type, 2025 to 2035
  • Figure 92: Western Europe Market Value (USD Million) by Refrigerant Type, 2025 to 2035
  • Figure 93: Western Europe Market Value (USD Million) by End User, 2025 to 2035
  • Figure 94: Western Europe Market Value (USD Million) by Application, 2025 to 2035
  • Figure 95: Western Europe Market Value (USD Million) by Country, 2025 to 2035
  • Figure 96: Western Europe Market Value (USD Million) Analysis by Country, 2020 to 2035
  • Figure 97: Western Europe Market Volume (Tons) Analysis by Country, 2020 to 2035
  • Figure 98: Western Europe Market Value Share (%) and BPS Analysis by Country, 2025 to 2035
  • Figure 99: Western Europe Market Y-o-Y Growth (%) Projections by Country, 2025 to 2035
  • Figure 100: Western Europe Market Value (USD Million) Analysis by Product Type, 2020 to 2035
  • Figure 101: Western Europe Market Volume (Tons) Analysis by Product Type, 2020 to 2035
  • Figure 102: Western Europe Market Value Share (%) and BPS Analysis by Product Type, 2025 to 2035
  • Figure 103: Western Europe Market Y-o-Y Growth (%) Projections by Product Type, 2025 to 2035
  • Figure 104: Western Europe Market Value (USD Million) Analysis by Refrigerant Type, 2020 to 2035
  • Figure 105: Western Europe Market Volume (Tons) Analysis by Refrigerant Type, 2020 to 2035
  • Figure 106: Western Europe Market Value Share (%) and BPS Analysis by Refrigerant Type, 2025 to 2035
  • Figure 107: Western Europe Market Y-o-Y Growth (%) Projections by Refrigerant Type, 2025 to 2035
  • Figure 108: Western Europe Market Value (USD Million) Analysis by End User, 2020 to 2035
  • Figure 109: Western Europe Market Volume (Tons) Analysis by End User, 2020 to 2035
  • Figure 110: Western Europe Market Value Share (%) and BPS Analysis by End User, 2025 to 2035
  • Figure 111: Western Europe Market Y-o-Y Growth (%) Projections by End User, 2025 to 2035
  • Figure 112: Western Europe Market Value (USD Million) Analysis by Application, 2020 to 2035
  • Figure 113: Western Europe Market Volume (Tons) Analysis by Application, 2020 to 2035
  • Figure 114: Western Europe Market Value Share (%) and BPS Analysis by Application, 2025 to 2035
  • Figure 115: Western Europe Market Y-o-Y Growth (%) Projections by Application, 2025 to 2035
  • Figure 116: Western Europe Market Attractiveness by Product Type, 2025 to 2035
  • Figure 117: Western Europe Market Attractiveness by Refrigerant Type, 2025 to 2035
  • Figure 118: Western Europe Market Attractiveness by End User, 2025 to 2035
  • Figure 119: Western Europe Market Attractiveness by Application, 2025 to 2035
  • Figure 120: Western Europe Market Attractiveness by Country, 2025 to 2035
  • Figure 121: Eastern Europe Market Value (USD Million) by Product Type, 2025 to 2035
  • Figure 122: Eastern Europe Market Value (USD Million) by Refrigerant Type, 2025 to 2035
  • Figure 123: Eastern Europe Market Value (USD Million) by End User, 2025 to 2035
  • Figure 124: Eastern Europe Market Value (USD Million) by Application, 2025 to 2035
  • Figure 125: Eastern Europe Market Value (USD Million) by Country, 2025 to 2035
  • Figure 126: Eastern Europe Market Value (USD Million) Analysis by Country, 2020 to 2035
  • Figure 127: Eastern Europe Market Volume (Tons) Analysis by Country, 2020 to 2035
  • Figure 128: Eastern Europe Market Value Share (%) and BPS Analysis by Country, 2025 to 2035
  • Figure 129: Eastern Europe Market Y-o-Y Growth (%) Projections by Country, 2025 to 2035
  • Figure 130: Eastern Europe Market Value (USD Million) Analysis by Product Type, 2020 to 2035
  • Figure 131: Eastern Europe Market Volume (Tons) Analysis by Product Type, 2020 to 2035
  • Figure 132: Eastern Europe Market Value Share (%) and BPS Analysis by Product Type, 2025 to 2035
  • Figure 133: Eastern Europe Market Y-o-Y Growth (%) Projections by Product Type, 2025 to 2035
  • Figure 134: Eastern Europe Market Value (USD Million) Analysis by Refrigerant Type, 2020 to 2035
  • Figure 135: Eastern Europe Market Volume (Tons) Analysis by Refrigerant Type, 2020 to 2035
  • Figure 136: Eastern Europe Market Value Share (%) and BPS Analysis by Refrigerant Type, 2025 to 2035
  • Figure 137: Eastern Europe Market Y-o-Y Growth (%) Projections by Refrigerant Type, 2025 to 2035
  • Figure 138: Eastern Europe Market Value (USD Million) Analysis by End User, 2020 to 2035
  • Figure 139: Eastern Europe Market Volume (Tons) Analysis by End User, 2020 to 2035
  • Figure 140: Eastern Europe Market Value Share (%) and BPS Analysis by End User, 2025 to 2035
  • Figure 141: Eastern Europe Market Y-o-Y Growth (%) Projections by End User, 2025 to 2035
  • Figure 142: Eastern Europe Market Value (USD Million) Analysis by Application, 2020 to 2035
  • Figure 143: Eastern Europe Market Volume (Tons) Analysis by Application, 2020 to 2035
  • Figure 144: Eastern Europe Market Value Share (%) and BPS Analysis by Application, 2025 to 2035
  • Figure 145: Eastern Europe Market Y-o-Y Growth (%) Projections by Application, 2025 to 2035
  • Figure 146: Eastern Europe Market Attractiveness by Product Type, 2025 to 2035
  • Figure 147: Eastern Europe Market Attractiveness by Refrigerant Type, 2025 to 2035
  • Figure 148: Eastern Europe Market Attractiveness by End User, 2025 to 2035
  • Figure 149: Eastern Europe Market Attractiveness by Application, 2025 to 2035
  • Figure 150: Eastern Europe Market Attractiveness by Country, 2025 to 2035
  • Figure 151: South Asia and Pacific Market Value (USD Million) by Product Type, 2025 to 2035
  • Figure 152: South Asia and Pacific Market Value (USD Million) by Refrigerant Type, 2025 to 2035
  • Figure 153: South Asia and Pacific Market Value (USD Million) by End User, 2025 to 2035
  • Figure 154: South Asia and Pacific Market Value (USD Million) by Application, 2025 to 2035
  • Figure 155: South Asia and Pacific Market Value (USD Million) by Country, 2025 to 2035
  • Figure 156: South Asia and Pacific Market Value (USD Million) Analysis by Country, 2020 to 2035
  • Figure 157: South Asia and Pacific Market Volume (Tons) Analysis by Country, 2020 to 2035
  • Figure 158: South Asia and Pacific Market Value Share (%) and BPS Analysis by Country, 2025 to 2035
  • Figure 159: South Asia and Pacific Market Y-o-Y Growth (%) Projections by Country, 2025 to 2035
  • Figure 160: South Asia and Pacific Market Value (USD Million) Analysis by Product Type, 2020 to 2035
  • Figure 161: South Asia and Pacific Market Volume (Tons) Analysis by Product Type, 2020 to 2035
  • Figure 162: South Asia and Pacific Market Value Share (%) and BPS Analysis by Product Type, 2025 to 2035
  • Figure 163: South Asia and Pacific Market Y-o-Y Growth (%) Projections by Product Type, 2025 to 2035
  • Figure 164: South Asia and Pacific Market Value (USD Million) Analysis by Refrigerant Type, 2020 to 2035
  • Figure 165: South Asia and Pacific Market Volume (Tons) Analysis by Refrigerant Type, 2020 to 2035
  • Figure 166: South Asia and Pacific Market Value Share (%) and BPS Analysis by Refrigerant Type, 2025 to 2035
  • Figure 167: South Asia and Pacific Market Y-o-Y Growth (%) Projections by Refrigerant Type, 2025 to 2035
  • Figure 168: South Asia and Pacific Market Value (USD Million) Analysis by End User, 2020 to 2035
  • Figure 169: South Asia and Pacific Market Volume (Tons) Analysis by End User, 2020 to 2035
  • Figure 170: South Asia and Pacific Market Value Share (%) and BPS Analysis by End User, 2025 to 2035
  • Figure 171: South Asia and Pacific Market Y-o-Y Growth (%) Projections by End User, 2025 to 2035
  • Figure 172: South Asia and Pacific Market Value (USD Million) Analysis by Application, 2020 to 2035
  • Figure 173: South Asia and Pacific Market Volume (Tons) Analysis by Application, 2020 to 2035
  • Figure 174: South Asia and Pacific Market Value Share (%) and BPS Analysis by Application, 2025 to 2035
  • Figure 175: South Asia and Pacific Market Y-o-Y Growth (%) Projections by Application, 2025 to 2035
  • Figure 176: South Asia and Pacific Market Attractiveness by Product Type, 2025 to 2035
  • Figure 177: South Asia and Pacific Market Attractiveness by Refrigerant Type, 2025 to 2035
  • Figure 178: South Asia and Pacific Market Attractiveness by End User, 2025 to 2035
  • Figure 179: South Asia and Pacific Market Attractiveness by Application, 2025 to 2035
  • Figure 180: South Asia and Pacific Market Attractiveness by Country, 2025 to 2035
  • Figure 181: East Asia Market Value (USD Million) by Product Type, 2025 to 2035
  • Figure 182: East Asia Market Value (USD Million) by Refrigerant Type, 2025 to 2035
  • Figure 183: East Asia Market Value (USD Million) by End User, 2025 to 2035
  • Figure 184: East Asia Market Value (USD Million) by Application, 2025 to 2035
  • Figure 185: East Asia Market Value (USD Million) by Country, 2025 to 2035
  • Figure 186: East Asia Market Value (USD Million) Analysis by Country, 2020 to 2035
  • Figure 187: East Asia Market Volume (Tons) Analysis by Country, 2020 to 2035
  • Figure 188: East Asia Market Value Share (%) and BPS Analysis by Country, 2025 to 2035
  • Figure 189: East Asia Market Y-o-Y Growth (%) Projections by Country, 2025 to 2035
  • Figure 190: East Asia Market Value (USD Million) Analysis by Product Type, 2020 to 2035
  • Figure 191: East Asia Market Volume (Tons) Analysis by Product Type, 2020 to 2035
  • Figure 192: East Asia Market Value Share (%) and BPS Analysis by Product Type, 2025 to 2035
  • Figure 193: East Asia Market Y-o-Y Growth (%) Projections by Product Type, 2025 to 2035
  • Figure 194: East Asia Market Value (USD Million) Analysis by Refrigerant Type, 2020 to 2035
  • Figure 195: East Asia Market Volume (Tons) Analysis by Refrigerant Type, 2020 to 2035
  • Figure 196: East Asia Market Value Share (%) and BPS Analysis by Refrigerant Type, 2025 to 2035
  • Figure 197: East Asia Market Y-o-Y Growth (%) Projections by Refrigerant Type, 2025 to 2035
  • Figure 198: East Asia Market Value (USD Million) Analysis by End User, 2020 to 2035
  • Figure 199: East Asia Market Volume (Tons) Analysis by End User, 2020 to 2035
  • Figure 200: East Asia Market Value Share (%) and BPS Analysis by End User, 2025 to 2035
  • Figure 201: East Asia Market Y-o-Y Growth (%) Projections by End User, 2025 to 2035
  • Figure 202: East Asia Market Value (USD Million) Analysis by Application, 2020 to 2035
  • Figure 203: East Asia Market Volume (Tons) Analysis by Application, 2020 to 2035
  • Figure 204: East Asia Market Value Share (%) and BPS Analysis by Application, 2025 to 2035
  • Figure 205: East Asia Market Y-o-Y Growth (%) Projections by Application, 2025 to 2035
  • Figure 206: East Asia Market Attractiveness by Product Type, 2025 to 2035
  • Figure 207: East Asia Market Attractiveness by Refrigerant Type, 2025 to 2035
  • Figure 208: East Asia Market Attractiveness by End User, 2025 to 2035
  • Figure 209: East Asia Market Attractiveness by Application, 2025 to 2035
  • Figure 210: East Asia Market Attractiveness by Country, 2025 to 2035
  • Figure 211: Middle East and Africa Market Value (USD Million) by Product Type, 2025 to 2035
  • Figure 212: Middle East and Africa Market Value (USD Million) by Refrigerant Type, 2025 to 2035
  • Figure 213: Middle East and Africa Market Value (USD Million) by End User, 2025 to 2035
  • Figure 214: Middle East and Africa Market Value (USD Million) by Application, 2025 to 2035
  • Figure 215: Middle East and Africa Market Value (USD Million) by Country, 2025 to 2035
  • Figure 216: Middle East and Africa Market Value (USD Million) Analysis by Country, 2020 to 2035
  • Figure 217: Middle East and Africa Market Volume (Tons) Analysis by Country, 2020 to 2035
  • Figure 218: Middle East and Africa Market Value Share (%) and BPS Analysis by Country, 2025 to 2035
  • Figure 219: Middle East and Africa Market Y-o-Y Growth (%) Projections by Country, 2025 to 2035
  • Figure 220: Middle East and Africa Market Value (USD Million) Analysis by Product Type, 2020 to 2035
  • Figure 221: Middle East and Africa Market Volume (Tons) Analysis by Product Type, 2020 to 2035
  • Figure 222: Middle East and Africa Market Value Share (%) and BPS Analysis by Product Type, 2025 to 2035
  • Figure 223: Middle East and Africa Market Y-o-Y Growth (%) Projections by Product Type, 2025 to 2035
  • Figure 224: Middle East and Africa Market Value (USD Million) Analysis by Refrigerant Type, 2020 to 2035
  • Figure 225: Middle East and Africa Market Volume (Tons) Analysis by Refrigerant Type, 2020 to 2035
  • Figure 226: Middle East and Africa Market Value Share (%) and BPS Analysis by Refrigerant Type, 2025 to 2035
  • Figure 227: Middle East and Africa Market Y-o-Y Growth (%) Projections by Refrigerant Type, 2025 to 2035
  • Figure 228: Middle East and Africa Market Value (USD Million) Analysis by End User, 2020 to 2035
  • Figure 229: Middle East and Africa Market Volume (Tons) Analysis by End User, 2020 to 2035
  • Figure 230: Middle East and Africa Market Value Share (%) and BPS Analysis by End User, 2025 to 2035
  • Figure 231: Middle East and Africa Market Y-o-Y Growth (%) Projections by End User, 2025 to 2035
  • Figure 232: Middle East and Africa Market Value (USD Million) Analysis by Application, 2020 to 2035
  • Figure 233: Middle East and Africa Market Volume (Tons) Analysis by Application, 2020 to 2035
  • Figure 234: Middle East and Africa Market Value Share (%) and BPS Analysis by Application, 2025 to 2035
  • Figure 235: Middle East and Africa Market Y-o-Y Growth (%) Projections by Application, 2025 to 2035
  • Figure 236: Middle East and Africa Market Attractiveness by Product Type, 2025 to 2035
  • Figure 237: Middle East and Africa Market Attractiveness by Refrigerant Type, 2025 to 2035
  • Figure 238: Middle East and Africa Market Attractiveness by End User, 2025 to 2035
  • Figure 239: Middle East and Africa Market Attractiveness by Application, 2025 to 2035
  • Figure 240: Middle East and Africa Market Attractiveness by Country, 2025 to 2035

Frequently Asked Questions

What is the estimated market size of the global refrigeration oil market for 2025?

The global refrigeration oil market is projected to reach USD 1,695.5 million by the end of 2025.

At what rate is the market expected to grow during the forecast period?

The market is anticipated to grow at a CAGR of 5.5% over the forecast period.

What is the projected market worth by 2035?

By 2035, the refrigeration oil market is expected to reach USD 2,887.2 million.

Which segment is expected to dominate the market?

The air conditioners segment is expected to dominate due to rising demand for residential and commercial air conditioning systems, coupled with advancements in energy-efficient cooling technologies.

Who are the key players in the refrigeration oil market?

Key players in the refrigeration oil market include ExxonMobil Corporation, Idemitsu Kosan Co., Ltd., TotalEnergies, Shell plc, and FUCHS Petrolub SE.

Explore Similar Insights

Future Market Insights

Refrigeration Oil Market