

- Market Size (2026)
- USD 735.0 Mn
- Forecast (2036)
- USD 1291.6 Mn
- CAGR (2026 to 2036)
- 5.8%
How big is the Rumen Buffer Supplements Market in 2026?
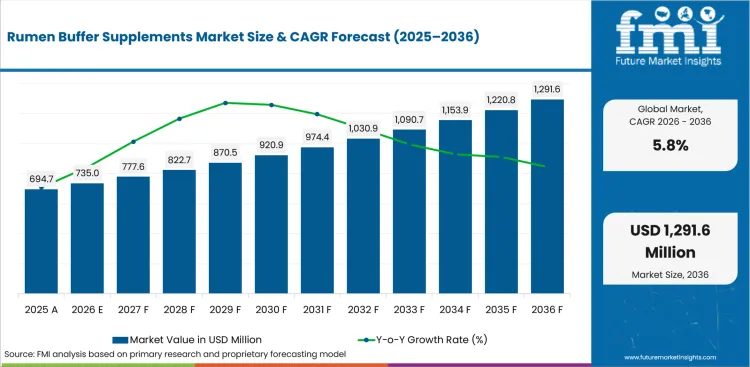
USD 735.0 million in 2026 and USD 1,291.6 million by 2036 at a 5.8% CAGR.
The rumen buffer supplements market was valued at USD 694.7 million in 2025. It is expected to grow from USD 735.0 million in 2026 to USD 1,291.6 million by 2036 at 5.8% CAGR. Feed-cost volatility is pushing ruminant nutrition programs toward additives that make rumen pH control easier to document. FAO Food Outlook reported that global milk production is forecast to expand by 1.4% in 2025, which raises the need for ration consistency in larger dairy systems. Feed mills linking buffer specifications to animal feed additives reviews are expected to treat documentation quality as part of purchase approval. The market exists around a narrow operating need rather than a broad supplement claim.
Premix manufacturers and dairy nutrition teams are the main commercial actors evaluating rumen buffer supplements. Their adoption decision is shaped by acidosis risk and grain-heavy diets. The same decision also reflects pressure to protect milk component results. Products that fit cattle feed production routines are likely to reduce formulation rework before farm trials move into repeat orders. Feed additive suppliers create value by providing blend guidance and batch records that QA teams accept without repeated follow-up. Dosing support also reduces handoffs between nutrition advisers and mill operators during commercial ration changes.
The link between ration design and farm performance gives buffer products their commercial prospect. Established dairy regions are projected to compare trial records and traceable batches before wider mill use. Access to feed premix channels receive greater preference in higher-growth markets during herd expansion and service network building. Sourcing teams face a practical decision around whether each product reduces service burden after the first commercial ration change. Supplier selection is expected to favor products that keep ration trials and mill handling aligned. Farm service also needs to remain connected after the first ration change.
Key Takeaways
-
Demand for rumen buffer supplements is driven by the need for feed stability and documented animal response, with premix makers screening products that reduce acidosis risk and keep ration changes traceable.
-
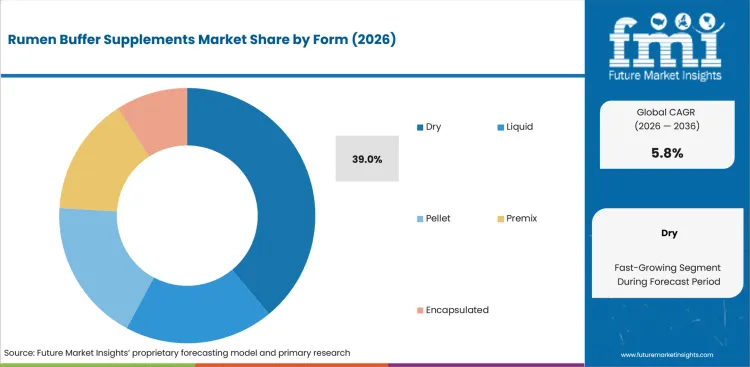
By form, dry is expected to lead with 39.0% share in 2026, supported by premix compatibility and lower handling disruption.
-
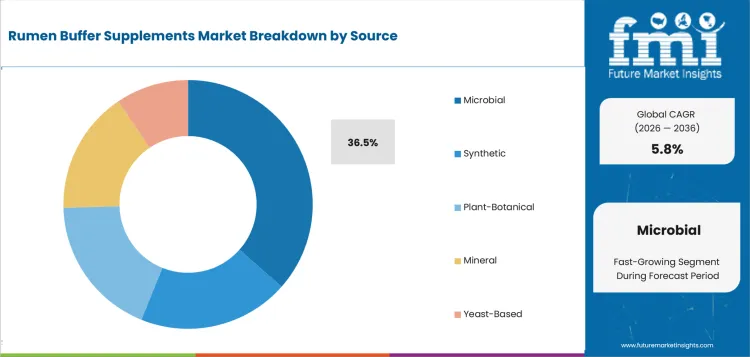
Microbial is the dominant source segment, projected to hold 36.5% share in 2026, reflecting traceability files and batch behavior claims.
-
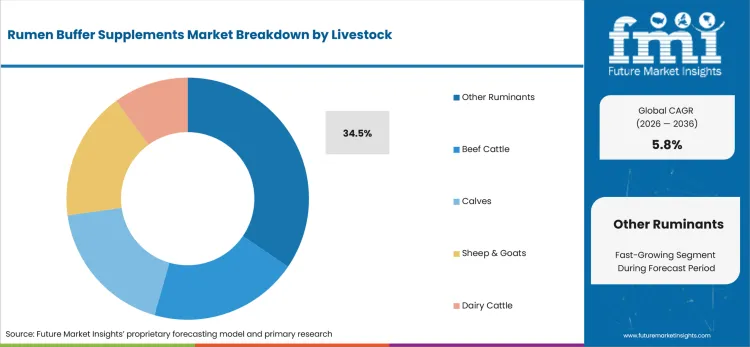
Other ruminants are estimated to lead the livestock category with 34.5% share in 2026, driven by flock ration programs and margin control.
-
Nutrient utilization is anticipated to capture 32.0% share of function demand in 2026, owing to formulation reviews that link additive cost to measurable feed response.
-
India and China are expected to form the higher-growth country tier, advancing at 5.2% and 4.3% CAGR respectively through 2036, supported by dairy output expansion and feed mill consolidation.
-
Competition centers on Cargill, ADM, Trouw Nutrition, Kemin Industries, Alltech, Adisseo, Novonesis, and DSM-Firmenich, with vendors differentiating through premix relationships, ruminant service depth, and biosolution expertise.
Analyst Perspective
"Demand for feed buffers is being shaped by the ability to deliver consistent ration performance under everyday production conditions rather than by product specifications alone. Nutrition professionals are seeking suppliers that can support pH management with well-documented field results, practical formulation guidance, and responsive technical expertise. Suppliers that simplify implementation while helping customers maintain stable feeding programs are likely to build stronger commercial relationships and stand out in a competitive market."
- Nandini Roy Choudhury, Principal Analyst at Future Market Insights
Source: FMI's proprietary forecasting model and primary research
How is the Rumen Buffer Supplements Market segmented?
The rumen buffer supplements industry is segmented by form, source, livestock, function, and region.
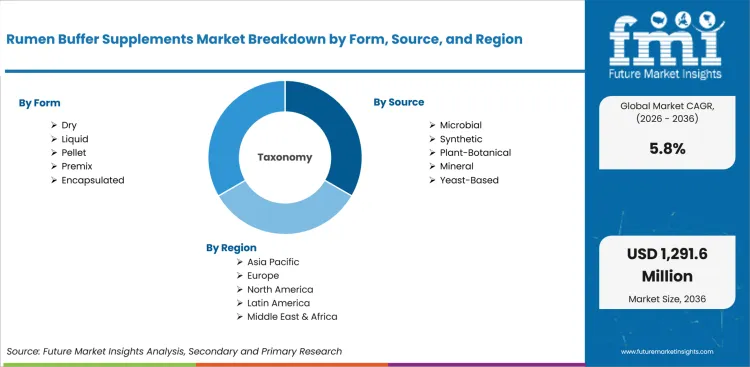
The rumen buffer supplements market is segmented by form, source, livestock, function, and region. By form, the market covers dry, liquid, pellet, premix, and encapsulated formats. By source, the market covers synthetic, microbial, plant or botanical, mineral, and yeast-based inputs. By livestock, the market covers dairy cattle, beef cattle, calves, sheep and goats, and other ruminants. By function, the market covers gut health, growth performance, immunity, nutrient utilization, and stress management. It focuses on ruminant feeding programs rather than unrelated monogastric-only additives. Regional coverage includes North America, Europe, East Asia, South Asia, and Latin America, which keeps adjacent animal feed ingredients demand visible in the article scope.
How does dry shape demand within the form category?
Mill blending systems require buffer inputs that move cleanly from storage to ration inclusion. Dry forms receive attention from feed mills due to dosing familiarity and easier premix handling. Cargill reported in 2025 that its mycotoxin research drew on 400,000+ global feed analyses, which shows the level of documentation now tied to feed quality decisions. The format choice also affects whether a plant tests the additive without reworking storage and conveying routines.
- Based on form, dry is projected to account for 39.0% of demand in 2026 driven by compatibility with premix lines and lower transport complexity. Cargill reported over 150 feed plants and storage locations in its feed-risk research, which reinforces why mills value formats that match routine quality checks. Sourcing teams also need evidence that dry products tolerate routine storage before longer contracts.
- Dry adoption is gaining momentum among feed mills supported by practical storage behavior and easier scale-up checks. Mills evaluating mineral feed inputs also compare dust control and blend uniformity before trial batches enter recurring production. Purchase teams use those checks to reduce rejected batches and dosing complaints during commercial scale-up.
What supports demand for microbial source choices?
Source selection affects how nutrition teams judge consistency before a buffer enters a commercial ration. Microbial inputs fit programs that connect rumen function to traceable production records. That proof need pushes source reviews beyond cost and into batch records before mill approval.
- By source, microbial is estimated to hold 36.5% of demand in 2026 attributable to tighter traceability expectations and batch-to-batch behavior claims. EFSA stated that feed additives are assessed for safety and efficacy before EU market placement, which links source choice to documentation discipline. The claim also needs production records that remain stable across supplier audits.
- Demand for microbial inputs is expected to grow among premix manufacturers owing to the need for clearer organism identity and production records. Nutrition teams comparing microbial feed additives use cases are likely to favor products with trial logic tied to rumen stability. Such proof reduces delays before microbial buffers enter recurring premix formulas.
How do nutrition teams evaluate other ruminants within livestock?
Small-ruminant and mixed-herd programs need buffer support that fits varied feeding routines. Other ruminants include sheep, goats and managed ruminant groups that do not receive the same trial budgets as dairy cattle. FAO dairy guidance notes that cattle produce 81% of world milk, which leaves smaller species needing clearer species-fit proof in supplier files. Supplier files need to explain species fit without relying on dairy-only trial language.
- In 2026, other ruminants are forecast to represent 34.5% of livestock demand supported by ration variability and service gaps in mixed-herd accounts. FAO identifies dairy animals as regular sources of food and cash for farmers, which links buffer use to income stability in smaller herds. The share reflects mixed-herd needs that require practical guidance beyond dairy farm protocols.
- Other ruminants are drawing attention from cooperatives shaped by feed conversion risk and limited on-farm nutrition staff. Trial support connected to animal feed probiotic comparisons helps advisers test buffer claims in smaller flock and herd settings. Advisers need product files that translate rumen claims into practical small-herd feeding routines during extension visits.
What drives nutrient utilization within function decisions?
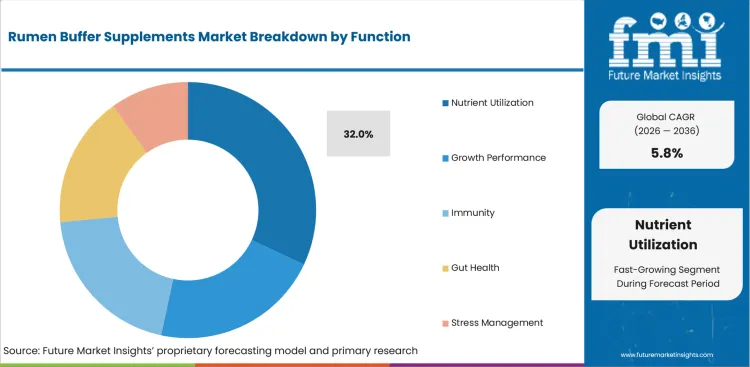
Function claims must show how the additive changes a feeding outcome rather than repeating a broad wellness promise. Nutrient utilization receives focus in feed mills that need ration economics tied to measurable intake and milk response. The function screen needs proof that pH support changes usable feed value.
- The function category is forecast to be led by nutrient utilization at 32.0% share in 2026 due to pressure for measurable ration outcomes. FDA animal food programs cover feed and veterinary oversight, which keeps additive records inside quality and safety review. Nutrition teams also need data that connects buffer use to milk response and ration value.
- Purchase activity for nutrient utilization is anticipated to rise driven by the need to reduce wasted ration value. Feed mills using novel feed additives comparisons are expected to request trial protocols that show how buffers influence ration economics. The review process keeps adoption tied to measurable ration returns rather than broad efficiency claims.
What are the drivers, restraints, and opportunities in the Rumen Buffer Supplements Market?
Near-term purchases are being shaped by ration stability, trial-data gaps, and service-backed premix expansion outlined below.
- Driver: Feed-cost pressure and variable forage quality are expected to push dairy producers toward buffers that support repeatable rumen pH control.
- Restraint: Adoption is likely to slow in accounts that lack alignment between farm trials and mill handling records across species programs.
- Opportunity: Species-specific premixes and field nutrition support are projected to open accounts that need measurable feed outcomes.
Dairy ration teams are expected to raise trial activity in programs that use concentrate feeding and face rumen stability risk. ADM unveiled Digest Carb in September 2025 for dairy performance and feed efficiency. The feed solution is expected to make nutrient-release logic more visible during ration review. Nutrition teams are expected to compare such claims against pH-control evidence before commercial use. Trial access is likely to depend on whether suppliers explain the buffer role in operational language and provide farm-ready proof.
EFSA stated in 2026 that new feed additives are assessed for safety and efficacy before placement on the EU market. Regulatory proof expectations keep weak claims from moving easily into audited feed programs. Adoption friction is concentrated in accounts that lack shared trial criteria across product approval teams. Shared scorecards are needed before supplier trials move into repeat mill orders.
Service-led programs are projected to turn restraint into account access for suppliers that bundle specification files and field support. Cargill completed an Engerwitzdorf capacity expansion in November 2025 to support 25,000 annual quality analyses. The development points to stricter supply expectations for micronutrition products and adjacent algae based animal feed programs. Feed mills are expected to favor suppliers that combine production scale and technical handover during local troubleshooting. Service packages become more persuasive by shortening the gap between formulation work and farm-level use.
Which country CAGRs are profiled in the Rumen Buffer Supplements Market?
.webp "Top Country Growth Comparison Rumen Buffer Supplements Market Cagr (2026 2036)")
| Country | CAGR |
|---|---|
| United States | 3.5% |
| China | 4.3% |
| India | 5.2% |
| Germany | 3.0% |
| United Kingdom | 3.2% |
| Japan | 2.5% |
| South Korea | 3.4% |
Source: FMI's proprietary forecasting model and primary research
How do country-level CAGRs compare in the Rumen Buffer Supplements Market?
The country comparison spans 2.7 percentage points and highlights three distinct growth groups across the Rumen Buffer Supplements Market. India and China form the upper growth tier with 0.9 percentage points separating the two markets. The United States, South Korea and the United Kingdom create a closely aligned middle group with only 0.3 percentage points separating the three markets. Germany and Japan form the lower-growth segment with a 0.5-point difference. Countries with expanding dairy production, increasing focus on rumen health and greater adoption of nutritional strategies that support feed efficiency generally demonstrate stronger market growth.
-
India holds the leading position within the comparison as dairy producers continue to adopt rumen buffer supplements to maintain rumen pH, improve feed utilization and support higher milk production.
-
China remains 0.9 percentage points below India and reflects a market where commercial dairy farms are placing greater emphasis on nutritional management to improve herd productivity and digestive health.
-
The United States remains 0.8 percentage points below China as rumen buffer supplements continue to gain traction in intensive dairy systems focused on maintaining consistent animal performance and reducing metabolic disorders.
-
South Korea sits 0.1 percentage points below the United States, highlighting continued interest in balanced feed programs that support rumen function and efficient nutrient utilization.
-
The United Kingdom remains 0.2 percentage points below South Korea, reflecting steady demand driven by improved transition feeding practices and greater attention to dairy herd health.
-
Germany records a CAGR 0.2 percentage points below the United Kingdom as established dairy operations continue to incorporate rumen buffering solutions that enhance feed efficiency and support animal well-being.
-
Japan remains 0.5 percentage points below Germany, reflecting a mature dairy market where precision feeding practices and consistent herd management sustain demand for rumen buffer supplements.
Comparable CAGRs can still produce different market entry conditions. Differences in dairy production systems, feeding practices, herd management approaches and adoption of nutritional technologies influence growth patterns and long-term market development. The full report provides country-level CAGR analysis across North America, Latin America, Europe, East Asia, South Asia, Oceania and the Middle East and Africa.
Country-wise Analysis
- By 2036, the United States is projected to grow at 3.5% CAGR driven by cattle inventories that keep ration efficiency under constant review. USDA National Agricultural Statistics Service reported 86.2 million cattle and calves on USA farms on January 1 2026. The inventory base keeps buffer supplements tied to pH control and milk-cow ration consistency. Feed mills face a challenge from tight trial windows and product comparisons that must satisfy nutrition and QA teams. Suppliers that document blending behavior and dairy field support are expected to receive closer consideration in accounts that require repeatable ration proof.
- China's rumen buffer supplements outlook is anticipated to advance at 4.3% CAGR over the assessment period supported by large dairy output and mill consolidation. National Bureau of Statistics of China reported milk output of 40.91 million tons in 2025. The production base increases demand for buffer products that help dairy farms manage concentrate feeding and rumen stability. Local adoption is constrained by uneven farm scale and price pressure across smaller producers.
- Rumen buffer supplement demand in India is forecast to rise at 5.2% CAGR over the forecast period propelled by dairy production scale and cooperative sourcing. Press Information Bureau reported milk production of 247.87 million tonnes during 2024 to 2025. The output base makes ration consistency commercially relevant for dairies that aggregate milk from varied herd systems. The local barrier remains fragmented farm advisory access outside larger cooperative networks and organized dealer routes. Feed additive suppliers that provide regional nutrition support are expected to receive closer consideration in accounts that require farmer-level dosing guidance.
- Adoption of rumen buffer supplements in Germany is estimated to expand at 3.0% CAGR through 2036 attributable to disciplined feed documentation and herd efficiency pressure. Destatis placed the German cattle count at 10,335,327 head in May 2025. The measured herd base keeps buffer demand tied to ration precision rather than broad herd expansion. German dairy and beef farms face stricter proof expectations under EU feed additive review culture.
- The United Kingdom rumen buffer supplements sector is projected to record 3.2% CAGR during the assessment period shaped by dairy value pressure and retailer-linked farm standards. Defra reported milk output value of GBP 6,316 million in 2024, which keeps dairy margin exposure visible during feed planning. The value base keeps dairy ration reliability central to feed programs that protect farm margins and processor supply agreements. Adoption is restrained by cost scrutiny among producers facing volatile feed and energy inputs.
- In Japan, rumen buffer supplement demand is predicted to advance at 2.5% CAGR through 2036 reinforced by cattle herd contraction and high production-cost discipline. USDA Foreign Agricultural Service reported Japan total cattle beginning stocks at 3,840 thousand head for 2026. The shrinking herd base shifts additive review toward proven productivity support for fewer animals nationwide. Local sourcing is cautious due to aging farm operators and limited appetite for unproven ration changes.
- Rumen buffer supplement sales in South Korea are forecast to expand at 3.4% CAGR by 2036 led by concentrated beef and dairy systems that demand measurable feed control. Korea Ministry of Data and Statistics recorded 3.422 million native and beef cattle in the third quarter of 2025. The concentration of cattle systems supports buffer review in systems that closely monitor feed conversion and carcass quality. Local opportunity is concentrated in feed mill programs serving larger farms and contracted channels.
Who are the notable companies in the Rumen Buffer Supplements Market?
Cargill, ADM, DSM-Firmenich, Kemin Industries, Alltech, Novonesis, Adisseo, and Trouw Nutrition (Nutreco) are the notable companies shaping this market.
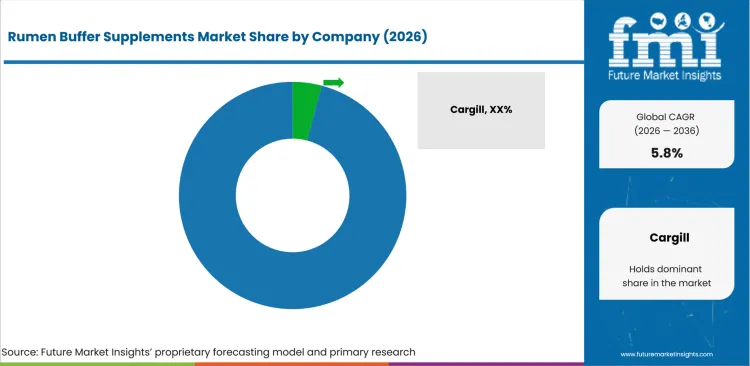
The market is moderately concentrated around multinational feed additive and animal nutrition companies that already serve feed mills and dairy accounts. Concentration is controlled by formulation support, portfolio breadth and proof documents that smaller regional players struggle to match. Regional specialists still compete in local service and price-sensitive premix accounts that need faster response. Competition centers on documentation, blending performance and field nutrition support rather than ingredient supply alone. Adjacent animal feed additive categories reinforce the need for product files that feed mills trust before scaling buffer use.
- Portfolio breadth separates broad feed suppliers from narrower additive manufacturers in commercial buffer programs. Cargill and ADM serve feed mills that prefer one accountable animal nutrition partner for premix support and commercial supply. Their advantage is practical account access across mills that already buy multiple nutrition inputs.
- Ruminant-specific service gives technical specialists a separate competitive role in dairy and small-herd accounts. Kemin Industries and Alltech compete in dairy programs that need support on gut health, feed safety and animal response. These companies are expected to gain consideration in accounts that require on-farm interpretation of buffer trials.
- Biotechnology capability creates a different route into accounts that connect buffers to microbial or enzyme-led ration concepts. Novonesis and DSM-Firmenich are relevant in feed programs that compare microbial source quality and proof requirements. Their position depends on showing how biosolutions fit commercial ruminant diets at mill scale.
- Mill integration and farm advisory depth are likely to decide longer account retention after scale-up. Trouw Nutrition and Cargill are better placed in programs that need premix access, local service and troubleshooting after scale-up. Their role is most visible in accounts that expect supplier support for ration implementation.
Competitive Benchmarking: Rumen Buffer Supplements Market
| Company | Feed Mill Access | Ruminant Service Fit | Footprint | Evidence Depth |
|---|---|---|---|---|
| Cargill | High | Strong | Global | High |
| ADM | High | Medium | Global | Medium |
| DSM-Firmenich | Medium | Strong | Global | Strong |
| Kemin Industries | Strong | Strong | Global | Strong |
| Alltech | Strong | Strong | Global | Medium |
| Novonesis | Medium | Strong | Global | Strong |
| Adisseo | Medium | Strong | Global | Medium |
| Trouw Nutrition (Nutreco) | High | Strong | Global | High |
Source: Future Market Insights competitive analysis, 2026. Ratings reflect relative portfolio relevance and workflow fit. Service capability and geographic reach shape the remaining comparison.
Key Developments in the Rumen Buffer Supplements Market
- In June 2025, Novonesis completed the acquisition of dsm-firmenich’s share of the Feed Enzyme Alliance. The company said regulatory approvals were completed before the deal closed, giving Novonesis full control of the alliance. The transaction is expected to strengthen feed enzyme ownership for animal nutrition accounts that compare microbial and enzyme inputs.
- In March 2025, Cargill Animal Nutrition & Health presented new mycotoxin and poultry gut-health research for the World Mycotoxin Forum. The research drew on global feed-risk work and farm-level sampling programs that support feed quality review.
- In March 2026, Adisseo launched Sanion Tetra 50 and Sanion Tetra 70 for animal feed. The protected sodium butyrate products contain 50% and 70% active content respectively. The launch signals a shift toward concentrated gut-health additives that emphasize handling quality and targeted delivery.
- In September 2025, ADM and Alltech announced plans for a North American animal feed joint venture. The companies said the venture would combine production assets, commercial teams and nutrition expertise, subject to closing steps. The deal is expected to reshape account access in feed programs that value mill coverage and technical support.
Key Players in the Rumen Buffer Supplements Market
Integrated Feed and Ingredient Suppliers
- Cargill
- ADM
- Trouw Nutrition (Nutreco)
Specialty Additive Suppliers
- Kemin Industries
- Alltech
- Adisseo
Biotechnology and Enzyme Specialists
- DSM-Firmenich
- Novonesis
Rumen Buffer Supplements Market - Report Scope
| Coverage field | Report scope |
|---|---|
| Market breakdown | Rumen Buffer Supplements Market Breakdown By Form, Source, Livestock, Function, and Region |
| Market Definition | Rumen buffer supplements are feed additive inputs used in ruminant diets to support rumen pH stability and help feed mills manage ration performance. |
| Regions Covered | North America, Latin America, Europe, East Asia, South Asia and Pacific, Middle East and Africa |
| Countries Covered | United States, China, India, Germany, United Kingdom, Japan, South Korea and 30+ countries |
| Key Companies Profiled | Cargill, ADM, DSM-Firmenich, Kemin Industries, Alltech, Novonesis, Adisseo, Trouw Nutrition (Nutreco) |
| Forecast Period | 2026 to 2036 |
| Approach | Hybrid bottom-up and top-down methodology using form adoption rates, source traceability needs, livestock program intensity and country-level dairy indicators |
Source: Future Market Insights - analysis driven by proprietary forecasting models and primary research
Rumen Buffer Supplements Market - Research Methodology
| Method | Approach |
|---|---|
| Primary Research | FMI analysts gathered input from manufacturers, service providers, technology developers, distributors, end users, sourcing teams, and subject-matter experts. Interviews examined purchasing decisions, product or service evaluation, adoption barriers, approval requirements, pricing considerations, and expectations for technical or commercial support. Respondents were also asked what evidence is required before a trial, pilot, or initial order develops into regular purchasing. |
| Desk Research | Desk research covered government statistics, regulatory publications, trade data, industry associations, technical literature, standards, company filings, product information, and official corporate announcements. Sources were reviewed for relevance, publication date, geographic coverage, and consistency with the defined market scope. Claims relating to performance, applications, approvals, capacity, investment, and commercial activity were retained only when supported by credible public evidence. |
| Market Sizing and Forecasting | The market model combined the baseline value with historical performance, segment structure, pricing and volume indicators, adoption levels, company participation, and country-level demand conditions. Forecast assumptions considered economic activity, investment trends, regulatory developments, technology adoption, purchasing cycles, supply availability, and barriers to wider market use. Segment and regional estimates were reconciled before the final market total was calculated. |
| Data Validation | Estimates were checked against multiple independent indicators, including public data, company activity, trade patterns, industry developments, and findings from primary interviews. Validation also tested whether products, services, applications, and company revenues fell within the defined market boundaries. Adjacent categories, unsupported claims, overlapping revenues, and activities without direct market relevance were excluded to reduce double counting and maintain consistency across segments and countries. |
Source: Future Market Insights (FMI) analysis, based on proprietary forecasting model and primary research
Rumen Buffer Supplements Market by Segments
Rumen Buffer Supplements Market segmented by Form:
- Dry
- Liquid
- Pellet
- Premix
- Encapsulated
Rumen Buffer Supplements Market segmented by Source:
- Synthetic
- Microbial
- Plant/Botanical
- Mineral
- Yeast-Based
Rumen Buffer Supplements Market segmented by Livestock:
- Dairy Cattle
- Beef Cattle
- Calves
- Sheep & Goats
- Other Ruminants
Rumen Buffer Supplements Market segmented by Function:
- Gut Health
- Growth Performance
- Immunity
- Nutrient Utilization
- Stress Management
Rumen Buffer Supplements Market by Region:
- North America
- United States
- Canada
- Mexico
- Latin America
- Brazil
- Chile
- Rest of Latin America
- Western Europe
- Germany
- United Kingdom
- Italy
- Spain
- France
- Nordic
- BENELUX
- Rest of Western Europe
- Eastern Europe
- Poland
- Hungary
- Balkan and Baltic
- Rest of Eastern Europe
- East Asia
- China
- Japan
- South Korea
- South Asia and Pacific
- India
- ASEAN
- Australia and New Zealand
- Rest of South Asia and Pacific
- Middle East and Africa
- Kingdom of Saudi Arabia
- Other GCC Countries
- Turkiye
- South Africa
- Other African Union
- Rest of Middle East and Africa
Research Sources and Bibliography
- Food and Agriculture Organization of the United Nations. (2025, November). Food Outlook - Biannual report on global food markets. Food and Agriculture Organization of the United Nations.
- USA Department of Agriculture National Agricultural Statistics Service. (2026, January). United States cattle inventory down slightly. USA Department of Agriculture.
- National Bureau of Statistics of China. (2026, February). Statistical Communiqué of the People’s Republic of China on the 2025 National Economic and Social Development. National Bureau of Statistics of China.
- Press Information Bureau. (2025, November). Release of Basic Animal Husbandry Statistics 2025 on the Occasion of National Milk Day 2025. Government of India.
- Statistisches Bundesamt. (2025, May). Holdings with cattle and stock of cattle. German Federal Statistical Office.
- Department for Environment, Food & Rural Affairs. (2025, July). Agriculture in the United Kingdom 2024. Government of the United Kingdom.
- USA Department of Agriculture Foreign Agricultural Service. (2026, January). Livestock and Products Annual. USA Department of Agriculture.
- Ministry of Data and Statistics. (2025, October). Livestock Statistics in the Third Quarter of 2025. Republic of Korea.
- European Food Safety Authority. (2024, December). Online event: Update on FEEDAP guidance on the assessment of the efficacy of feed additives: what’s new. European Food Safety Authority.
- European Food Safety Authority. (2026, May). Feed additives application procedure. European Food Safety Authority.
- Cargill. (2025, March). Cargill Animal Nutrition & Health Presents New Insights on Mycotoxins and Poultry Gut Health. Cargill.
- Cargill. (2025, November). Cargill Animal Nutrition & Health Increases Micronutrition Production Capacity to Meet Growing Customer Demand. Cargill.
- Novonesis. (2025, June). Deal to acquire dsm-firmenich’s share of the Feed Enzyme Alliance is completed, supporting Novonesis’ growth strategy. Novonesis.
- Adisseo. (2026, March). Adisseo Expands Butyrate Portfolio with Sanion Tetra. Adisseo.
- ADM. (2026, June). Animal Nutrition. ADM.
- Kemin Industries. (2026, June). Ruminants. Kemin Industries.
- Alltech. (2026, June). Who We Are. Alltech.
- Trouw Nutrition. (2026, June). Animal Nutrition. Trouw Nutrition.
- ADM. (2025, September). ADM Unveils New Feed Solution That Unlocks Nutrients for Optimized Dairy Performance. ADM.
- ADM. (2025, September). ADM, Alltech to Bring Together Unparalleled Expertise and Experience in New North American Animal Feed Joint Venture. ADM.
This bibliography is provided for reader reference and uses primary government, standards-body, official trade body, and company sources.
This Report Answers
- What is the expected value of the rumen buffer supplements market in 2026 and 2036?
- What CAGR is forecast for the rumen buffer supplements market from 2026 to 2036?
- Which form, source, livestock and function segments shape demand in the market?
- Which feed-cost and ration-management pressures support adoption of rumen buffer supplements?
- How do country CAGRs differ across the United States, China, India, Germany, the United Kingdom, Japan and South Korea?
- Which companies compete across portfolio breadth, ruminant service and evidence depth?
- How does FMI validate forecasts and avoid duplicate statistics in the article?
- What should feed mills and premix manufacturers address before broader sourcing commitment?
- How do claims review and feed additive documentation affect vendor selection?
Frequently Asked Questions
Why should executives track the rumen buffer supplements market?
Executives should track the market due to its direct link to feed-cost control, ration reliability and dairy output protection.
What business problem does the rumen buffer supplements market address?
It helps feed mills and dairy producers reduce uncertainty around rumen pH stability and ration performance under variable feed conditions.
What should procurement leaders evaluate before selecting feed additive suppliers?
Procurement leaders should compare specification depth, blending behavior, technical service, regional supply and evidence quality before supplier approval.
What limits return on investment for feed mills?
Return is limited by weak trial design, unclear ownership across nutrition teams and products that require unexpected handling changes.
How do suppliers build long-term account confidence?
Suppliers build confidence by providing trial protocols, clear batch documents and field support after commercial ration approval.
Preview the report firsthand - request a free sample
Get SampleGet the brochure for pricing and purchase details.
Get PDFTable of Content
- Key Takeaways
- Market Size and CAGR
- Top Growth Driver
- Fastest Growing Segment
- Leading Region
- Key Companies
- Emerging Opportunities
- Executive Summary
- Global Market Outlook
- Demand-side Trends
- Supply-side Trends
- Technology Roadmap Analysis
- Analysis and Recommendations
- Analyst Perspective (What is happening? Why now? What should investors know?)
- Key Questions Answered
- How large is the market?
- What is the CAGR?
- What are key trends?
- Which region dominates?
- Who are the leaders?
- Market Overview
- Market Coverage / Taxonomy
- Market Definition / Scope / Limitations
- Research Methodology
- Chapter Orientation
- Analytical Lens and Working Hypotheses
- Market Structure, Signals, and Trend Drivers
- Benchmarking and Cross-market Comparability
- Market Sizing, Forecasting, and Opportunity Mapping
- Research Design and Evidence Framework
- Desk Research Programme (Secondary Evidence)
- Expert Input and Fieldwork (Primary Evidence)
- Tooling, Models, and Reference Databases
- Data Engineering and Model Build
- Quality Assurance and Audit Trail
- Market Background
- Market Dynamics (Drivers, Restraints, Opportunity, Trends)
- Scenario Forecast (Optimistic, Likely, Conservative)
- Impact Analysis
- AI Impact
- Sustainability Impact
- Regulatory Impact
- Technology Impact
- Consumer / Buyer Analysis
- Purchase Drivers
- Adoption Barriers
- Buyer Journey
- Opportunity Map Analysis
- Product Life Cycle Analysis
- Supply Chain Analysis
- Investment Feasibility Matrix
- Value Chain Analysis
- PESTLE and Porter's Analysis
- Regulatory Landscape
- Regional Parent Market Outlook
- Production and Consumption Statistics
- Import and Export Statistics
- Global Market Analysis and Forecast, 2021 to 2036
- Historical Market Size Value (USD Million) & Volume (Unit) Analysis, 2021 to 2025
- Current and Future Market Size Value (USD Million) & Volume (Unit) Projections, 2026 to 2036
- Y-o-Y Growth Trend Analysis
- Absolute $ Opportunity Analysis
- Global Market Pricing Analysis, 2021 to 2036
- Global Market Analysis and Forecast, By Form, 2021 to 2036
- Introduction / Key Findings
- Historical Market Size Value (USD Million) & Volume (Unit) Analysis By Form, 2021 to 2025
- Current and Future Market Size Value (USD Million) & Volume (Unit) Analysis and Forecast By Form, 2026 to 2036
- Dry
- Liquid
- Pellet
- Premix
- Encapsulated
- Dry
- Y-o-Y Growth Trend Analysis By Form, 2021 to 2025
- Absolute $ Opportunity Analysis By Form, 2026 to 2036
- Global Market Analysis and Forecast, By Source, 2021 to 2036
- Introduction / Key Findings
- Historical Market Size Value (USD Million) & Volume (Unit) Analysis By Source, 2021 to 2025
- Current and Future Market Size Value (USD Million) & Volume (Unit) Analysis and Forecast By Source, 2026 to 2036
- Microbial
- Synthetic
- Plant-Botanical
- Mineral
- Yeast-Based
- Microbial
- Y-o-Y Growth Trend Analysis By Source, 2021 to 2025
- Absolute $ Opportunity Analysis By Source, 2026 to 2036
- Global Market Analysis and Forecast, By Livestock, 2021 to 2036
- Introduction / Key Findings
- Historical Market Size Value (USD Million) & Volume (Unit) Analysis By Livestock, 2021 to 2025
- Current and Future Market Size Value (USD Million) & Volume (Unit) Analysis and Forecast By Livestock, 2026 to 2036
- Other Ruminants
- Beef Cattle
- Calves
- Sheep & Goats
- Dairy Cattle
- Other Ruminants
- Y-o-Y Growth Trend Analysis By Livestock, 2021 to 2025
- Absolute $ Opportunity Analysis By Livestock, 2026 to 2036
- Global Market Analysis and Forecast, By Function, 2021 to 2036
- Introduction / Key Findings
- Historical Market Size Value (USD Million) & Volume (Unit) Analysis By Function, 2021 to 2025
- Current and Future Market Size Value (USD Million) & Volume (Unit) Analysis and Forecast By Function, 2026 to 2036
- Nutrient Utilization
- Growth Performance
- Immunity
- Gut Health
- Stress Management
- Nutrient Utilization
- Y-o-Y Growth Trend Analysis By Function, 2021 to 2025
- Absolute $ Opportunity Analysis By Function, 2026 to 2036
- Global Market Analysis and Forecast, By Region, 2021 to 2036
- Introduction
- Historical Market Size Value (USD Million) & Volume (Unit) Analysis By Region, 2021 to 2025
- Current Market Size Value (USD Million) & Volume (Unit) Analysis and Forecast By Region, 2026 to 2036
- North America
- Latin America
- Western Europe
- Eastern Europe
- East Asia
- South Asia and Pacific
- Middle East & Africa
- Market Attractiveness Analysis By Region
- North America Market Analysis and Forecast, By Country, 2021 to 2036
- Historical Market Size Value (USD Million) & Volume (Unit) Trend Analysis By Market Taxonomy, 2021 to 2025
- Market Size Value (USD Million) & Volume (Unit) Forecast By Market Taxonomy, 2026 to 2036
- By Country
- USA
- Canada
- Mexico
- By Form
- By Source
- By Livestock
- By Function
- By Country
- Market Attractiveness Analysis
- By Country
- By Form
- By Source
- By Livestock
- By Function
- Key Takeaways
- Latin America Market Analysis and Forecast, By Country
- Historical Market Size Value (USD Million) & Volume (Unit) Trend Analysis By Market Taxonomy, 2021 to 2025
- Market Size Value (USD Million) & Volume (Unit) Forecast By Market Taxonomy, 2026 to 2036
- By Country
- Brazil
- Chile
- Rest of Latin America
- By Form
- By Source
- By Livestock
- By Function
- By Country
- Market Attractiveness Analysis
- By Country
- By Form
- By Source
- By Livestock
- By Function
- Key Takeaways
- Western Europe Market Analysis and Forecast, By Country
- Historical Market Size Value (USD Million) & Volume (Unit) Trend Analysis By Market Taxonomy, 2021 to 2025
- Market Size Value (USD Million) & Volume (Unit) Forecast By Market Taxonomy, 2026 to 2036
- By Country
- Germany
- UK
- Italy
- Spain
- France
- Nordic
- BENELUX
- Rest of Western Europe
- By Form
- By Source
- By Livestock
- By Function
- By Country
- Market Attractiveness Analysis
- By Country
- By Form
- By Source
- By Livestock
- By Function
- Key Takeaways
- Eastern Europe Market Analysis and Forecast, By Country
- Historical Market Size Value (USD Million) & Volume (Unit) Trend Analysis By Market Taxonomy, 2021 to 2025
- Market Size Value (USD Million) & Volume (Unit) Forecast By Market Taxonomy, 2026 to 2036
- By Country
- Russia
- Poland
- Hungary
- Balkan & Baltic
- Rest of Eastern Europe
- By Form
- By Source
- By Livestock
- By Function
- By Country
- Market Attractiveness Analysis
- By Country
- By Form
- By Source
- By Livestock
- By Function
- Key Takeaways
- East Asia Market Analysis and Forecast, By Country
- Historical Market Size Value (USD Million) & Volume (Unit) Trend Analysis By Market Taxonomy, 2021 to 2025
- Market Size Value (USD Million) & Volume (Unit) Forecast By Market Taxonomy, 2026 to 2036
- By Country
- China
- Japan
- South Korea
- By Form
- By Source
- By Livestock
- By Function
- By Country
- Market Attractiveness Analysis
- By Country
- By Form
- By Source
- By Livestock
- By Function
- Key Takeaways
- South Asia and Pacific Market Analysis and Forecast, By Country
- Historical Market Size Value (USD Million) & Volume (Unit) Trend Analysis By Market Taxonomy, 2021 to 2025
- Market Size Value (USD Million) & Volume (Unit) Forecast By Market Taxonomy, 2026 to 2036
- By Country
- India
- ASEAN
- Australia & New Zealand
- Rest of South Asia and Pacific
- By Form
- By Source
- By Livestock
- By Function
- By Country
- Market Attractiveness Analysis
- By Country
- By Form
- By Source
- By Livestock
- By Function
- Key Takeaways
- Middle East & Africa Market Analysis and Forecast, By Country
- Historical Market Size Value (USD Million) & Volume (Unit) Trend Analysis By Market Taxonomy, 2021 to 2025
- Market Size Value (USD Million) & Volume (Unit) Forecast By Market Taxonomy, 2026 to 2036
- By Country
- Kingdom of Saudi Arabia
- Other GCC Countries
- Türkiye
- South Africa
- Other African Union
- Rest of Middle East & Africa
- By Form
- By Source
- By Livestock
- By Function
- By Country
- Market Attractiveness Analysis
- By Country
- By Form
- By Source
- By Livestock
- By Function
- Key Takeaways
- Key Countries Market Analysis
- USA
- Pricing Analysis
- Market Share Analysis, 2025
- By Form
- By Source
- By Livestock
- By Function
- Canada
- Pricing Analysis
- Market Share Analysis, 2025
- By Form
- By Source
- By Livestock
- By Function
- Mexico
- Pricing Analysis
- Market Share Analysis, 2025
- By Form
- By Source
- By Livestock
- By Function
- Brazil
- Pricing Analysis
- Market Share Analysis, 2025
- By Form
- By Source
- By Livestock
- By Function
- Chile
- Pricing Analysis
- Market Share Analysis, 2025
- By Form
- By Source
- By Livestock
- By Function
- Germany
- Pricing Analysis
- Market Share Analysis, 2025
- By Form
- By Source
- By Livestock
- By Function
- UK
- Pricing Analysis
- Market Share Analysis, 2025
- By Form
- By Source
- By Livestock
- By Function
- Italy
- Pricing Analysis
- Market Share Analysis, 2025
- By Form
- By Source
- By Livestock
- By Function
- Spain
- Pricing Analysis
- Market Share Analysis, 2025
- By Form
- By Source
- By Livestock
- By Function
- France
- Pricing Analysis
- Market Share Analysis, 2025
- By Form
- By Source
- By Livestock
- By Function
- India
- Pricing Analysis
- Market Share Analysis, 2025
- By Form
- By Source
- By Livestock
- By Function
- ASEAN
- Pricing Analysis
- Market Share Analysis, 2025
- By Form
- By Source
- By Livestock
- By Function
- Australia & New Zealand
- Pricing Analysis
- Market Share Analysis, 2025
- By Form
- By Source
- By Livestock
- By Function
- China
- Pricing Analysis
- Market Share Analysis, 2025
- By Form
- By Source
- By Livestock
- By Function
- Japan
- Pricing Analysis
- Market Share Analysis, 2025
- By Form
- By Source
- By Livestock
- By Function
- South Korea
- Pricing Analysis
- Market Share Analysis, 2025
- By Form
- By Source
- By Livestock
- By Function
- Russia
- Pricing Analysis
- Market Share Analysis, 2025
- By Form
- By Source
- By Livestock
- By Function
- Poland
- Pricing Analysis
- Market Share Analysis, 2025
- By Form
- By Source
- By Livestock
- By Function
- Hungary
- Pricing Analysis
- Market Share Analysis, 2025
- By Form
- By Source
- By Livestock
- By Function
- Kingdom of Saudi Arabia
- Pricing Analysis
- Market Share Analysis, 2025
- By Form
- By Source
- By Livestock
- By Function
- Türkiye
- Pricing Analysis
- Market Share Analysis, 2025
- By Form
- By Source
- By Livestock
- By Function
- South Africa
- Pricing Analysis
- Market Share Analysis, 2025
- By Form
- By Source
- By Livestock
- By Function
- USA
- Market Structure Analysis
- Competition Dashboard
- Competition Benchmarking
- Market Share Analysis of Top Players
- By Regional
- By Form
- By Source
- By Livestock
- By Function
- Emerging Startups
- Innovation Benchmarking
- Competition Analysis
- Competition Deep Dive
- Cargill
- Overview
- Product Portfolio
- Profitability by Market Segments (Product/Region/Sales Channel)
- Sales Footprint
- Strategy Overview
- Marketing Strategy
- Product Strategy
- Channel Strategy
- ADM
- DSM-Firmenich
- Kemin Industries
- Alltech
- Novonesis
- Adisseo
- Trouw Nutrition
- Cargill
- Case Studies
- Success Stories
- Recent Developments
- Competition Deep Dive
- Assumptions & Acronyms Used


