

- Market Size (2026)
- USD 1040.3 Mn
- Forecast (2036)
- USD 1743.7 Mn
- CAGR (2026 to 2036)
- 5.3%
How big is Sand Control Resins Market in 2026?
USD 1,040.3 million in 2026 and USD 1,743.7 million by 2036 at a 5.3% CAGR.
Demand for sand control resins is projected to expand at 5.3% CAGR between 2026 and 2036. Market valuation rose from USD 987.9 million in 2025 to USD 1,040.3 million in 2026 and is expected to reach USD 1,743.7 million by 2036. Resin treatment is garnering consideration by reducing flowback through bonded grains without imposing an unacceptable permeability penalty. Baker Hughes specifies a 75°F to 300°F range for ReSET FORM and makes temperature and placement conditions part of current qualification.
National well activity is also changing the commercial threshold for resin treatment because candidate wells and intervention economics differ by country. The USA Energy Information Administration reported record crude production averaging 13.6 million barrels per day during 2025. That producing base expands the well population available for comparing chemical consolidation with sand control screens. Germany and Japan offer narrower domestic routes because policy and upstream structure limit repeated treatment volumes.
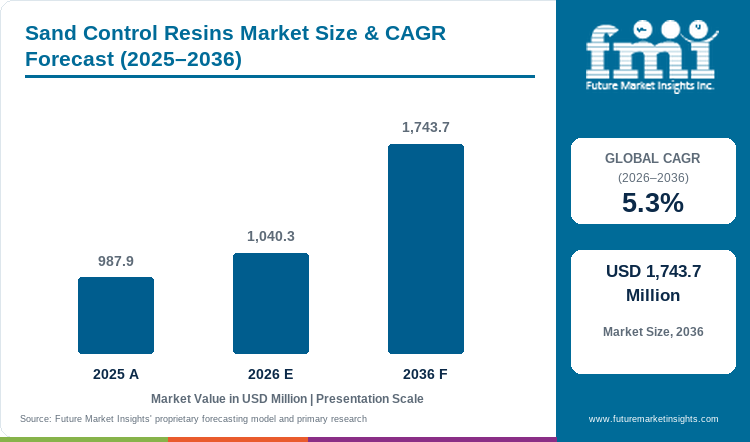
Key Takeaways
- Sand control resin demand rises when bonded grains or proppant reduce flowback risk without sacrificing productive permeability.
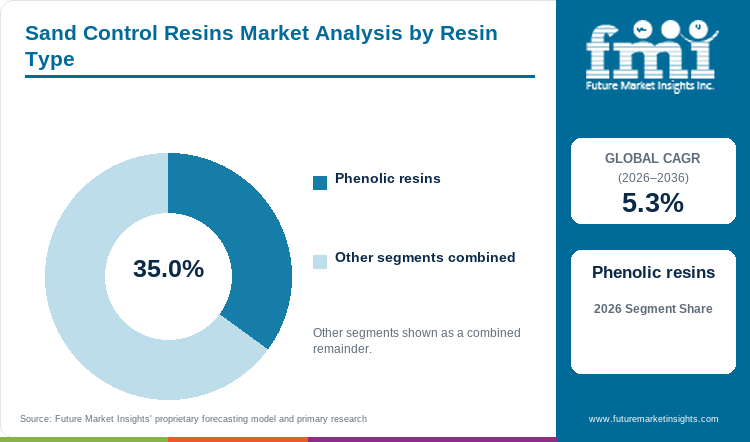
- Based on resin type, phenolic resins are projected to account for 35.0% in 2026 owing to established thermoset bonding workflows.
- Resin-coated sand is estimated to hold 39.0% of application demand in 2026, supported by direct substrate stabilization during field placement.
- Oilfield service companies are forecast to represent 41.0% of sales-channel demand in 2026, influenced by the need to coordinate treatment design and field execution.
- Condition-specific curing windows and permeability trade-offs can delay adoption when mechanical sand control satisfies the required operating limit.
- Some of the key players in this market include Bakelite Synthetics, Iron Oak Energy Solutions LLC, CARBO Ceramics, LLC, Halliburton Company, BASF SE, Baker Hughes Company, Preferred Sands, ChangQing Proppant Corporation, SLB, and Jinan Shengquan Group Share-Holding Co., Ltd.
Analyst Perspective
"Resin suppliers earn repeat work once bonding performance is proven against the actual temperature and fluid program. Commercial advantage comes from retaining permeability and matching the service route already used at the wellsite."
- Nikhil Kaitwade, Principal Consultant, Future Market Insights
How is the sand control resins market segmented?
The sand control resins market is segmented by resin type, application, well type, sales channel, performance and region.
The sand control resins market is segmented by resin type, application, well type, sales channel, performance and region. Resin types include phenolic, epoxy, furan, polyurethane and high-temperature systems. Applications cover resin-coated sand, consolidation treatments, gravel-pack support, frac sand coating and remedial sand control. Well types include onshore, offshore, unconventional, heavy oil and high-temperature wells. Sales channels cover service companies, proppant suppliers, direct resin suppliers and chemical distributors. Performance categories include high crush resistance, chemical resistance, thermal stability and flowback control.
How do phenolic resins satisfy coated-proppant bonding requirements?
Phenolic resins support coated-proppant workflows because heat and closure stress can activate a durable bond without changing the granular delivery route. Bakelite documents phenolic coating resins for hydraulic fracturing that raise crush resistance and limit fines on sand or ceramic substrates. Compatibility with oilfield production chemicals remains important because the coating must survive the selected fluid sequence.
- Phenolic resins are likely to capture 35.0% of resin type demand in 2026 driven by thermoset bonding performance in established coated-proppant workflows.
- Completion engineers verify cure behavior under actual temperature and closure stress before treating higher crush resistance as commercially useful.
What makes resin-coated sand practical for targeted flowback control?
Resin-coated sand places stabilization on the proppant substrate before hydraulic fracturing crews pump material into the target interval. Preferred Sands states that its coating systems reduce flowback and fines under cyclic stress. Coating earns its premium by improving pack behavior enough to offset the added material cost.
- In 2026, resin-coated sand is expected to lead the application category with 39.0% share enabled by one delivered material that provides placement and stabilization functions.
- Reservoir temperature and closure stress determine whether a curable coating bonds in the formation without restricting productive pore space.
How does repeated onshore completion activity affect resin selection?
Onshore programs give completion teams repeated opportunities to screen resin systems against identifiable flowback or crush risk. Iron Oak currently supplies resin-coated Northern White Sand for high-temperature and high-pressure wells through a North American distribution network. Resin systems must align with shale gas fracturing schedules without adding a separate handling bottleneck before pumping begins.
- Onshore wells are forecast to represent 34.0% of well-type demand in 2026, supported by repeated completion activity and established local qualification routes.
- Onshore programs reject a resin premium if pack stability does not reduce cleanouts or improve retained conductivity.
Why do service companies control complex resin-treatment execution?
Chemical consolidation requires fluid preparation and placement to match the intended formation interval. Halliburton documents SandTrap resin treatment with staged preflush and post-flush steps that preserve pay-zone permeability. That execution responsibility links laboratory qualification with pumping sequence and wellsite handling within oil and gas field services.
- Oilfield service companies are set to lead the sales-channel category with 41.0% share in 2026 attributable to their control over treatment design and field execution.
- Service companies gain specification influence when they can verify fluid compatibility and place the resin without extending well downtime.
How does high crush resistance affect resin-system value?
High crush resistance is valuable because grain breakage generates fines and reduces conductivity under fracture closure. CARBO documented a 2026 resin-coated proppant method that forms a consolidated pack upon contact with a reactive crosslinker. Qualification still compares pack strength with retained flow capacity because oilfield stimulation chemicals can change placement and cleanup conditions.
- High crush resistance is projected to hold 31.0% of performance demand in 2026 with its position shaped by pack-integrity requirements under closure stress.
- Qualification programs compare strength with conductivity because a harder bonded pack fails economically when productive flow declines excessively.
What are the drivers, restraints and opportunities in the Sand Control Resins Market?
Flowback control supports demand while qualification economics restrict routine use and alternative chemistries widen the qualified well set.
- Driver: Resin treatments gain orders when sand movement creates measurable intervention risk in an otherwise productive well.
- Restraint: Temperature windows and permeability trade-offs add qualification work before resin can replace simpler sand-control choices.
- Opportunity: Alternative coating and consolidation chemistries can extend resin use into intervals that reject conventional curing behavior.
Field exposure turns sand movement into a treatment decision
Produced particles turn sand movement into a resin purchase by threatening equipment or forcing repeated intervention on a productive well. A 2025 Society of Petroleum Engineers field case documented externally catalyzed resin consolidation in low-injectivity wells because mechanical options were less suitable. Durable bonding preserved deliverability and reduced the need for another remedial intervention. Hardware sand control tools still compete with resin systems by controlling solids with less chemical qualification. Intervention avoidance is the commercial driver because treatment value must exceed the cost and execution risk of alternative controls.
Narrow operating windows can delay resin qualification
A resin formulation must remain pumpable until it reaches the target interval and then cure under the intended downhole condition. Baker Hughes lists a 75°F to 300°F application range for ReSET FORM and generally limits matrix injection to 25 feet of perforated interval. Those limits make placement design part of the purchase decision because drilling and completion fluids can alter compatibility and activation behavior. Operators select a simpler mechanical solution if resin placement introduces disproportionate execution risk. Suppliers improve conversion by documenting fluid sequence and retained permeability before the field job is committed.
Alternative coating chemistry can widen the qualified well set
Alternative chemistry widens the qualified well set by addressing temperature or stress conditions that one curing route cannot satisfy. BASF stated in April 2025 that Lupranate 5253 isocyanate can be used to produce resin-coated proppant. The document establishes a directly relevant coating input without proving finished-treatment performance. Formulators use such oilfield chemicals to adjust coating chemistry for different curing conditions. Commercial adoption still depends on testing the completed proppant or consolidation system under intended reservoir fluids because material substitution alone does not establish retained conductivity or field durability.
Which country CAGRs are profiled in the Sand Control Resins Market?
| Country | CAGR |
|---|---|
| Poland | 5.8% |
| South Korea | 5.5% |
| Canada | 5.1% |
| USA | 4.8% |
| France | 4.5% |
| Germany | 4.1% |
| Japan | 3.8% |
How do country-level CAGRs compare in the Sand Control Resins Market?
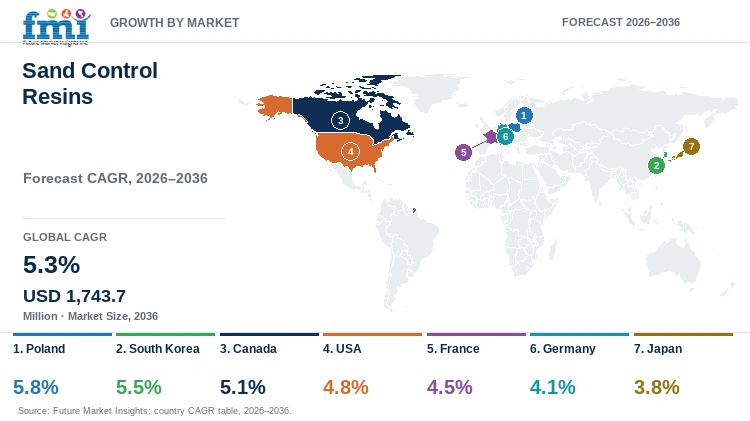
The country forecasts span 2.0 percentage points between Poland and Japan during the 2026 to 2036 period. Different resource bases and policy constraints shape this spread rather than current market size.
- Poland’s domestic gas reserves and ongoing concession activity help sustain a pipeline of future completion projects, supporting continued demand for sand control solutions.
- In South Korea, offshore exploration initiatives create opportunities for new well completions as development programs move from investment planning to execution.
- Canada benefits from a large producing asset base and efficient basin logistics, improving access to coated proppants and related completion materials.
- The USA’s mature onshore sector continues to generate demand from well interventions and completion candidates despite the widespread availability of low-cost in-basin sand.
- France relies increasingly on remedial and production-support activities, as a limited new-well pipeline shifts attention toward extending the performance of existing assets.
- Germany’s market is shaped by conventional hydrocarbon production, while restrictions on commercial shale development limit opportunities from unconventional resources.
- Japan maintains demand through participation in overseas upstream ventures, where long project cycles and operator-controlled investments influence completion activity.
The full report provides country-level CAGR analysis across North America, Latin America, Western Europe, Eastern Europe, East Asia, South Asia and Pacific, and the Middle East and Africa.
Country-wise Analysis
- Poland retains a domestic gas resource base that keeps selective field-development work relevant to sand-control suppliers. Poland's sand control resins outlook is anticipated to advance at 5.8% CAGR over the assessment period, supported by documented domestic gas resources that preserve future drilling options. The Polish Geological Institute reported 147.94 billion cubic meters of exploitable natural gas resources for 2025. Resource ownership does not automatically create resin orders because development schedules and completion designs remain project specific. Reliable regional delivery becomes important once a resin specification advances from laboratory qualification into repeated field use.
- South Korea's route is offshore and exploration led, which makes project sanction more important than current domestic production volume. Sand control resin demand in South Korea is forecast to rise at 5.5% CAGR over the forecast period, influenced by East Sea exploration that preserves a future completion route. Korea National Oil Corporation reported in September 2025 that multiple foreign companies entered offshore block investment bidding. The same release found no economic feasibility for the Blue Whale structure. Resin suppliers can pursue technical qualification during exploration, but recurring orders require sanctioned wells with completion conditions that justify consolidation or coated proppant.
- Canada combines large national production with concentrated Western Canadian activity that rewards reliable basin delivery. Adoption of sand control resins in Canada is estimated to expand at 5.1% CAGR through 2036, reinforced by producing scale that sustains selective treatment demand. The Canada Energy Regulator reported 5.35 million barrels per day of crude oil and equivalent production during 2025. Alberta supplied 83.8% of national crude production during that period. Basin concentration makes coating capacity and inventory placement commercially important for remote wellsites.
- USA has a large onshore well population that forces resin to compete with mature completion designs and inexpensive in-basin sand. Sand control resin demand in the USA is forecast to rise at 4.8% CAGR over the forecast period, driven by repeated completion activity that creates frequent qualification opportunities. The USA Energy Information Administration reported record crude production averaging 13.6 million barrels per day during 2025. That scale does not make resin the default choice because sand screens and uncoated proppant remain practical alternatives. Suppliers must connect pack stability or flowback control with measurable intervention savings before a resin treatment enters recurring schedules.
- France has a small domestic hydrocarbon base that limits the volume case for new resin-intensive completions. France's sand control resins outlook is anticipated to advance at 4.5% CAGR over the assessment period, constrained by a small domestic production base that shifts demand toward remedial work. The ecological ministry reported in April 2026 that domestic oil production represents about 1% of national consumption. National policy also targets a progressive end to hydrocarbon exploration and production on French territory. Resin suppliers need application support for existing wells instead of a high-volume domestic drilling strategy. Chemical consolidation must show intervention value before operators accept additional treatment complexity.
- Germany's current opportunity centers on conventional production and remedial work rather than broad unconventional shale programs. Germany's sand control resins sector is projected to record 4.1% CAGR during the assessment period, shaped by conventional production and national restrictions on commercial unconventional shale fracturing. The Federal Environment Agency states that commercial unconventional fracking in shale and related formations remains prohibited under national rules. That restriction narrows high-volume fracturing demand and increases the importance of reservoir-specific qualification. Resin suppliers must document placement behavior and retained permeability under the actual well condition before chemical consolidation can displace mechanical sand control.
- Japan's domestic production base is limited, but Japanese companies retain exposure to upstream projects outside the country. Sand control resin sales in Japan are forecast to expand at 3.8% CAGR by 2036, tied to Japanese-controlled overseas upstream development. The Ministry of Economy Trade and Industry reported a 42.1% FY2024 independent oil and gas development ratio in February 2026. The measure includes overseas production and offtake controlled by Japanese enterprises. Long marine project cycles can delay resin orders once laboratory qualification is complete.
Who are the notable companies in the Sand Control Resins Market?
Bakelite Synthetics, Iron Oak Energy Solutions LLC, CARBO Ceramics, LLC, Halliburton Company, BASF SE, Baker Hughes Company, Preferred Sands, ChangQing Proppant Corporation, SLB, and Jinan Shengquan Group Share-Holding Co., Ltd. are notable companies serving this market.
Competition separates resin chemistry ownership from coated-proppant manufacturing and field consolidation services used in oil and gas wells. Entry depends on verified coating chemistry, proppant performance or the ability to place resin treatment under defined downhole conditions.
- Bakelite Synthetics, BASF SE and Jinan Shengquan Group Share-Holding Co., Ltd. supply resin chemistry used in proppant coating routes.
- Iron Oak Energy Solutions LLC, CARBO Ceramics, LLC, Preferred Sands and ChangQing Proppant Corporation supply coated or specialty proppants.
- Halliburton Company, Baker Hughes Company and SLB provide field-applied chemical sand-control and completion-service routes.
Competitive Benchmarking: Sand Control Resins Market
| Company | Resin or Coating Control | Downhole Qualification Evidence | Completion Integration | Geographic Reach |
|---|---|---|---|---|
| Bakelite Synthetics | High | Medium | Low | Global |
| Iron Oak Energy Solutions LLC | High | Medium | Medium | North America |
| CARBO Ceramics, LLC | High | High | High | Americas and international projects |
| Halliburton Company | High | High | High | Global |
| BASF SE | Medium | Medium | Low | Global |
| Baker Hughes Company | High | High | High | Global |
| Preferred Sands | High | High | Medium | North America and exports |
| ChangQing Proppant Corporation | Medium | Medium | Low | China and international sales |
| SLB | High | High | High | Global |
| Jinan Shengquan Group Share-Holding Co., Ltd. | High | Medium | Low | China and international sales |
Scoring basis: High resin or coating control requires multiple documented exact-market routes. Medium requires one direct route or a closely matched coating input. Low indicates limited public control over resin formulation. High qualification evidence requires documented operating windows or field validation. Medium requires one bounded performance record. Low indicates limited public qualification detail. High completion integration requires direct material control and field execution. Medium requires one of those capabilities. Low has neither.
Key Developments in the Sand Control Resins Market
- In May 2026, CARBO Ceramics, LLC received USA Patent 12,637,935 covering resin-coated proppant reacted with a crosslinker to form consolidated packs.
- In March 2026, Schlumberger Technology Corporation received USA Patent 12,584,061 for a low-viscosity sand-consolidation fluid with more than 75% retained permeability.
- In December 2025, Halliburton Energy Services, Inc. published USA Patent Application 20250368887 covering plant-derived binder chemistry for formation sand and proppant consolidation.
Key Players in the Sand Control Resins Market
Resin Chemistry and Coating Suppliers
- Bakelite Synthetics
- BASF SE
- Jinan Shengquan Group Share-Holding Co., Ltd.
Resin-Coated and Specialty Proppant Companies
- Iron Oak Energy Solutions LLC
- CARBO Ceramics, LLC
- Preferred Sands
- ChangQing Proppant Corporation
Field Sand-Consolidation Service Companies
- Halliburton Company
- Baker Hughes Company
- SLB
Sand Control Resins Market - Report Scope
| Coverage field | Report scope |
|---|---|
| Market breakdown | By resin type, application, well type, sales channel, performance and region. |
| Quantitative Units | USD million. |
| Market Definition | Resin systems and resin-coated proppants used to bond formation grains or proppant packs for sand and flowback control in oil and gas wells. |
| Regions Covered | North America, Latin America, Western Europe, Eastern Europe, East Asia, South Asia and Pacific, and Middle East and Africa. |
| Countries Covered | Poland, South Korea, Canada, USA, France, Germany, Japan, and 20+ countries included in the full report. |
| Key Companies Profiled | Bakelite Synthetics, Iron Oak Energy Solutions LLC, CARBO Ceramics, LLC, Halliburton Company, BASF SE, Baker Hughes Company, Preferred Sands, ChangQing Proppant Corporation, SLB, and Jinan Shengquan Group Share-Holding Co., Ltd. |
| Forecast Period | 2026 to 2036. |
| Approach | Primary and secondary research with market triangulation. |
Sand Control Resins Market - Research Methodology
| Method | Approach |
|---|---|
| Primary Research | FMI analysts gathered input from manufacturers, service providers, technology developers, distributors, end users, procurement teams, and subject-matter experts. Interviews examined purchasing decisions, product or service evaluation, adoption barriers, approval requirements, pricing considerations, and expectations for technical or commercial support. Respondents were also asked what evidence is required before a trial, pilot, or initial order develops into regular purchasing. |
| Desk Research | Desk research covered government statistics, regulatory publications, trade data, industry associations, technical literature, standards, company filings, product information, and official corporate announcements. Sources were reviewed for relevance, publication date, geographic coverage, and consistency with the defined market scope. Claims relating to performance, applications, approvals, capacity, investment, and commercial activity were retained only when supported by credible public evidence. |
| Market Sizing and Forecasting | The market model combined the baseline value with historical performance, segment structure, pricing and volume indicators, adoption levels, company participation, and country-level demand conditions. Forecast assumptions considered economic activity, investment trends, regulatory developments, technology adoption, purchasing cycles, supply availability, and barriers to wider market use. Segment and regional estimates were reconciled before the final market total was calculated. |
| Data Validation | Estimates were checked against multiple independent indicators, including public data, company activity, trade patterns, industry developments, and findings from primary interviews. Validation also tested whether products, services, applications, and company revenues fell within the defined market boundaries. Adjacent categories, unsupported claims, overlapping revenues, and activities without direct market relevance were excluded to reduce double counting and maintain consistency across segments and countries. |
Sand Control Resins Market by Segments
Sand Control Resins Market segmented by Resin Type:
- Phenolic resins
- Epoxy resins
- Furan resins
- Polyurethane resins
- High-temperature resin systems
Sand Control Resins Market segmented by Application:
- Resin-coated sand
- Consolidation treatments
- Gravel-pack support
- Frac sand coating
- Remedial sand control
Sand Control Resins Market segmented by Well Type:
- Onshore wells
- Offshore wells
- Unconventional wells
- Heavy oil wells
- High-temperature wells
Sand Control Resins Market segmented by Sales Channel:
- Oilfield service companies
- Proppant suppliers
- Direct resin suppliers
- Chemical distributors
Sand Control Resins Market segmented by Performance:
- High crush resistance
- Chemical resistance
- Thermal stability
- Flowback control
Sand Control Resins Market by Region:
- North America
- United States
- Canada
- Latin America
- Brazil
- Mexico
- Argentina
- Chile
- Rest of Latin America
- Western Europe
- Germany
- France
- United Kingdom
- Italy
- Spain
- Benelux
- Nordics
- Rest of Western Europe
- Eastern Europe
- Poland
- Czech Republic
- Romania
- Hungary
- Rest of Eastern Europe
- East Asia
- China
- Japan
- South Korea
- South Asia and Pacific
- India
- ASEAN
- Australia and New Zealand
- Rest of South Asia and Pacific
- Middle East and Africa
- GCC Countries
- South Africa
- Türkiye
- Israel
- Rest of Middle East and Africa
Research Sources and Bibliography
- Baker Hughes. (2026). ReSET FORM formation consolidation system.
- USA Energy Information Administration. (2026, July 9). The United States produced more crude oil than any other country in 2025.
- Bakelite Synthetics. (n.d.). Bakelite chemicals for oil and natural gas production. Retrieved September 17, 2026.
- Preferred Sands. (n.d.). Preferred resins. Retrieved September 17, 2026.
- Halliburton. (n.d.). SandTrap formation consolidation service for sand control. Retrieved September 17, 2026.
- Iron Oak Energy Solutions LLC. (n.d.). Northern White Sand. Retrieved September 17, 2026.
- Society of Petroleum Engineers. (2025, March). Novel externally catalyzed resin expands the chemical sand consolidation horizons: Successful case of implementation and perdurability in Latin America. SPE 224059.
- BASF Corporation. (2025, April). Lupranate 5253 Isocyanate.
- Polish Geological Institute - National Research Institute. (2026). Natural gas.
- Korea National Oil Corporation. (2025, September 22).
- Canada Energy Regulator. (2026, June 17). Market Snapshot: Canada sets new record in crude oil production in 2025.
- Ministère de la Transition écologique. (2026, April 1). Ressources en hydrocarbures de la France.
- Umweltbundesamt. (2026, February 5). Fracking.
- Ministry of Economy, Trade and Industry. (2026, February 17). FY2024 Independent Development Ratio of Oil and Natural Gas in Japan Released.
- CARBO Ceramics Inc. (2026, May 26). Compositions and methods for use of proppant surface chemistry to improve proppant consolidation and flowback control. USA Patent No. 12,637,935.
- Schlumberger Technology Corporation. (2026, March 24). Method for consolidating subterranean formation. USA Patent No. 12,584,061.
- Halliburton Energy Services, Inc. (2025, December 4). Methods and compositions used in controlling formation sand production, proppant flowback, and fines migration. USA Patent Application No. 20250368887.
- Jinan Shengquan Group Share-Holding Co., Ltd. (2026, July 1).
- Schlumberger Technology Corporation. (2026, September 1). Curing accelerant for proppant coating and methods of use. USA Patent No. 12,723,190.
- 3M Innovative Properties Company. (2026, August 4). Sand consolidation and water block with multipodal compositions. USA Patent No. 12,698,433.
- China Oilfield Services Limited. (2026, February 24). A resin system for self-generating gas pore expansion and sand consolidation and its preparation method. CN119351068B.
- Saudi Arabian Oil Company. (2025, May 6). Blowing agent incorporated resin systems for consolidating subterranean oil and gas bearing formations. USA Patent No. 12,291,672.
- CARBO Ceramics Inc. (2025, March 18). Infused and coated proppant containing chemical treatment agents and methods of using the same. USA Patent No. 12,252,648.
- Iron Oak Energy Solutions LLC. (2026, June 1). Iron Oak Energy Solutions announces acquisition of Signal Peak.
- Halliburton Energy Services, Inc. (2025, October 9). Furan-based polymer compositions for well consolidation operations. CO2025013249A2.
- Preferred Sands. (2025, July 9). First operational use of West Texas SuperSand is live.
- BASF SE. (2026, February 27). Investments: MDI capacity expansion in Geismar remains on schedule for 2026 startup.
- Bakelite Synthetics. (2025, April 22). Bakelite Synthetics achieves Responsible Care certification.
- Baker Hughes. (2026, September 4). Baker Hughes awarded offshore production enhancement and stimulation services contract by bp.
- BASF SE. (2026, February 27). BASF Annual Press Conference 2025: MDI expansion in Geismar nears completion.
This bibliography is provided for reader reference and is not exhaustive. The full report contains the complete reference list and detailed citations
This Report Answers
- How large is the sand control resins market in 2026 and 2036?
- Which downhole conditions convert sand-production risk into demand for resin treatment?
- Which resin type accounts for 35.0% of demand within its 2026 category?
- Why does resin-coated sand represent 39.0% of application demand during 2026?
- How do service companies influence qualification and execution for field-applied resin treatments?
- Which national conditions separate the seven profiled country CAGR forecasts through 2036?
- How do resin chemistry suppliers and coated-proppant companies occupy different commercial roles?
- Which recent patents and field developments are changing chemical sand-consolidation design choices?
- What limits wider adoption when mechanical sand control or uncoated proppant remains commercially adequate?
Frequently Asked Questions
How big is the sand control resins market in 2026?
The sand control resins market is valued at USD 1,040.3 million in 2026 and is projected to reach USD 1,743.7 million by 2036. Growth depends on controlling particle movement without sacrificing productive permeability or making treatment economics uncompetitive.
What is the CAGR of the sand control resins market from 2026 to 2036?
The sand control resins market is projected to grow at 5.3% CAGR between 2026 and 2036. Operators select resin more often for wells with flowback or formation-sand risk that justifies added qualification and field execution cost.
Which application category holds a 39.0% share in the sand control resins market?
By application, resin-coated sand is estimated to hold 39.0% in 2026 because stabilization is applied directly to granular material already used in completion workflows. The format keeps placement and sand-control functions inside one delivered material.
Which countries carry the upper profiled growth rates for sand control resins?
Poland is projected at 5.8% CAGR and South Korea at 5.5% through 2036 within the profiled country set. Their outlooks depend on converting domestic resource work or offshore exploration into sanctioned completion programs.
Which companies are active in the sand control resins market?
Key companies active in the sand control resins market include Bakelite Synthetics, Iron Oak Energy Solutions LLC, CARBO Ceramics, LLC, Halliburton Company, BASF SE, Baker Hughes Company, Preferred Sands, ChangQing Proppant Corporation, SLB and Jinan Shengquan Group Share-Holding Co., Ltd. Their roles span resin chemistry, coated proppants and field consolidation services that control particle movement in oil and gas wells.
Preview the report firsthand - request a free sample
Get SampleGet the brochure for pricing and purchase details.
Get PDFTable of Content
- Key Takeaways
- Market Size and CAGR
- Top Growth Driver
- Fastest Growing Segment
- Leading Region
- Key Companies
- Emerging Opportunities
- Executive Summary
- Global Market Outlook
- Demand-side Trends
- Supply-side Trends
- Technology Roadmap Analysis
- Analysis and Recommendations
- Analyst Perspective (What is happening? Why now? What should investors know?)
- Key Questions Answered
- How large is the market?
- What is the CAGR?
- What are key trends?
- Which region dominates?
- Who are the leaders?
- Market Overview
- Market Coverage / Taxonomy
- Market Definition / Scope / Limitations
- Research Methodology
- Chapter Orientation
- Analytical Lens and Working Hypotheses
- Market Structure, Signals, and Trend Drivers
- Benchmarking and Cross-market Comparability
- Market Sizing, Forecasting, and Opportunity Mapping
- Research Design and Evidence Framework
- Desk Research Programme (Secondary Evidence)
- Expert Input and Fieldwork (Primary Evidence)
- Tooling, Models, and Reference Databases
- Data Engineering and Model Build
- Quality Assurance and Audit Trail
- Market Background
- Market Dynamics (Drivers, Restraints, Opportunity, Trends)
- Scenario Forecast (Optimistic, Likely, Conservative)
- Impact Analysis
- AI Impact
- Sustainability Impact
- Regulatory Impact
- Technology Impact
- Consumer / Buyer Analysis
- Purchase Drivers
- Adoption Barriers
- Buyer Journey
- Opportunity Map Analysis
- Product Life Cycle Analysis
- Supply Chain Analysis
- Investment Feasibility Matrix
- Value Chain Analysis
- PESTLE and Porter's Analysis
- Regulatory Landscape
- Regional Parent Market Outlook
- Production and Consumption Statistics
- Import and Export Statistics
- Global Market Analysis and Forecast, 2021 to 2036
- Historical Market Size Value (USD Million) Analysis, 2021 to 2025
- Current and Future Market Size Value (USD Million) Projections, 2026 to 2036
- Y-o-Y Growth Trend Analysis
- Absolute $ Opportunity Analysis
- Global Market Pricing Analysis, 2021 to 2036
- Global Market Analysis and Forecast, By Resin Type, 2021 to 2036
- Introduction / Key Findings
- Historical Market Size Value (USD Million) Analysis By Resin Type, 2021 to 2025
- Current and Future Market Size Value (USD Million) Analysis and Forecast By Resin Type, 2026 to 2036
- Phenolic resins
- Epoxy resins
- Furan resins
- Polyurethane resins
- High-temperature resin systems
- Y-o-Y Growth Trend Analysis By Resin Type, 2021 to 2025
- Absolute $ Opportunity Analysis By Resin Type, 2026 to 2036
- Global Market Analysis and Forecast, By Application, 2021 to 2036
- Introduction / Key Findings
- Historical Market Size Value (USD Million) Analysis By Application, 2021 to 2025
- Current and Future Market Size Value (USD Million) Analysis and Forecast By Application, 2026 to 2036
- Resin-coated sand
- Consolidation treatments
- Gravel-pack support
- Frac sand coating
- Remedial sand control
- Y-o-Y Growth Trend Analysis By Application, 2021 to 2025
- Absolute $ Opportunity Analysis By Application, 2026 to 2036
- Global Market Analysis and Forecast, By Well Type, 2021 to 2036
- Introduction / Key Findings
- Historical Market Size Value (USD Million) Analysis By Well Type, 2021 to 2025
- Current and Future Market Size Value (USD Million) Analysis and Forecast By Well Type, 2026 to 2036
- Onshore wells
- Offshore wells
- Unconventional wells
- Heavy oil wells
- High-temperature wells
- Y-o-Y Growth Trend Analysis By Well Type, 2021 to 2025
- Absolute $ Opportunity Analysis By Well Type, 2026 to 2036
- Global Market Analysis and Forecast, By Sales Channel, 2021 to 2036
- Introduction / Key Findings
- Historical Market Size Value (USD Million) Analysis By Sales Channel, 2021 to 2025
- Current and Future Market Size Value (USD Million) Analysis and Forecast By Sales Channel, 2026 to 2036
- Oilfield service companies
- Proppant suppliers
- Direct resin suppliers
- Chemical distributors
- Y-o-Y Growth Trend Analysis By Sales Channel, 2021 to 2025
- Absolute $ Opportunity Analysis By Sales Channel, 2026 to 2036
- Global Market Analysis and Forecast, By Performance, 2021 to 2036
- Introduction / Key Findings
- Historical Market Size Value (USD Million) Analysis By Performance, 2021 to 2025
- Current and Future Market Size Value (USD Million) Analysis and Forecast By Performance, 2026 to 2036
- High crush resistance
- Chemical resistance
- Thermal stability
- Flowback control
- Y-o-Y Growth Trend Analysis By Performance, 2021 to 2025
- Absolute $ Opportunity Analysis By Performance, 2026 to 2036
- Global Market Analysis and Forecast, By Region, 2021 to 2036
- Introduction
- Historical Market Size Value (USD Million) Analysis By Region, 2021 to 2025
- Current Market Size Value (USD Million) Analysis and Forecast By Region, 2026 to 2036
- North America
- Latin America
- Western Europe
- Eastern Europe
- East Asia
- South Asia and Pacific
- Middle East and Africa
- Market Attractiveness Analysis By Region
- North America Market Analysis and Forecast, By Country, 2021 to 2036
- Historical Market Size Value (USD Million) Trend Analysis By Market Taxonomy, 2021 to 2025
- Market Size Value (USD Million) Forecast By Market Taxonomy, 2026 to 2036
- By Country
- United States
- Canada
- By Resin Type
- By Application
- By Well Type
- By Sales Channel
- By Performance
- By Country
- Market Attractiveness Analysis
- By Country
- By Resin Type
- By Application
- By Well Type
- By Sales Channel
- By Performance
- Key Takeaways
- Latin America Market Analysis and Forecast, By Country
- Historical Market Size Value (USD Million) Trend Analysis By Market Taxonomy, 2021 to 2025
- Market Size Value (USD Million) Forecast By Market Taxonomy, 2026 to 2036
- By Country
- Brazil
- Mexico
- Argentina
- Chile
- Rest of Latin America
- By Resin Type
- By Application
- By Well Type
- By Sales Channel
- By Performance
- By Country
- Market Attractiveness Analysis
- By Country
- By Resin Type
- By Application
- By Well Type
- By Sales Channel
- By Performance
- Key Takeaways
- Western Europe Market Analysis and Forecast, By Country
- Historical Market Size Value (USD Million) Trend Analysis By Market Taxonomy, 2021 to 2025
- Market Size Value (USD Million) Forecast By Market Taxonomy, 2026 to 2036
- By Country
- Germany
- France
- United Kingdom
- Italy
- Spain
- Benelux
- Nordics
- Rest of Western Europe
- By Resin Type
- By Application
- By Well Type
- By Sales Channel
- By Performance
- By Country
- Market Attractiveness Analysis
- By Country
- By Resin Type
- By Application
- By Well Type
- By Sales Channel
- By Performance
- Key Takeaways
- Eastern Europe Market Analysis and Forecast, By Country
- Historical Market Size Value (USD Million) Trend Analysis By Market Taxonomy, 2021 to 2025
- Market Size Value (USD Million) Forecast By Market Taxonomy, 2026 to 2036
- By Country
- Poland
- Czech Republic
- Romania
- Hungary
- Rest of Eastern Europe
- By Resin Type
- By Application
- By Well Type
- By Sales Channel
- By Performance
- By Country
- Market Attractiveness Analysis
- By Country
- By Resin Type
- By Application
- By Well Type
- By Sales Channel
- By Performance
- Key Takeaways
- East Asia Market Analysis and Forecast, By Country
- Historical Market Size Value (USD Million) Trend Analysis By Market Taxonomy, 2021 to 2025
- Market Size Value (USD Million) Forecast By Market Taxonomy, 2026 to 2036
- By Country
- China
- Japan
- South Korea
- By Resin Type
- By Application
- By Well Type
- By Sales Channel
- By Performance
- By Country
- Market Attractiveness Analysis
- By Country
- By Resin Type
- By Application
- By Well Type
- By Sales Channel
- By Performance
- Key Takeaways
- South Asia and Pacific Market Analysis and Forecast, By Country
- Historical Market Size Value (USD Million) Trend Analysis By Market Taxonomy, 2021 to 2025
- Market Size Value (USD Million) Forecast By Market Taxonomy, 2026 to 2036
- By Country
- India
- ASEAN
- Australia and New Zealand
- Rest of South Asia and Pacific
- By Resin Type
- By Application
- By Well Type
- By Sales Channel
- By Performance
- By Country
- Market Attractiveness Analysis
- By Country
- By Resin Type
- By Application
- By Well Type
- By Sales Channel
- By Performance
- Key Takeaways
- Middle East and Africa Market Analysis and Forecast, By Country
- Historical Market Size Value (USD Million) Trend Analysis By Market Taxonomy, 2021 to 2025
- Market Size Value (USD Million) Forecast By Market Taxonomy, 2026 to 2036
- By Country
- GCC Countries
- South Africa
- Türkiye
- Israel
- Rest of Middle East and Africa
- By Resin Type
- By Application
- By Well Type
- By Sales Channel
- By Performance
- By Country
- Market Attractiveness Analysis
- By Country
- By Resin Type
- By Application
- By Well Type
- By Sales Channel
- By Performance
- Key Takeaways
- Key Countries Market Analysis
- United States
- Pricing Analysis
- Market Share Analysis, 2025
- By Resin Type
- By Application
- By Well Type
- By Sales Channel
- By Performance
- Canada
- Pricing Analysis
- Market Share Analysis, 2025
- By Resin Type
- By Application
- By Well Type
- By Sales Channel
- By Performance
- Mexico
- Pricing Analysis
- Market Share Analysis, 2025
- By Resin Type
- By Application
- By Well Type
- By Sales Channel
- By Performance
- Brazil
- Pricing Analysis
- Market Share Analysis, 2025
- By Resin Type
- By Application
- By Well Type
- By Sales Channel
- By Performance
- Chile
- Pricing Analysis
- Market Share Analysis, 2025
- By Resin Type
- By Application
- By Well Type
- By Sales Channel
- By Performance
- Germany
- Pricing Analysis
- Market Share Analysis, 2025
- By Resin Type
- By Application
- By Well Type
- By Sales Channel
- By Performance
- United Kingdom
- Pricing Analysis
- Market Share Analysis, 2025
- By Resin Type
- By Application
- By Well Type
- By Sales Channel
- By Performance
- Italy
- Pricing Analysis
- Market Share Analysis, 2025
- By Resin Type
- By Application
- By Well Type
- By Sales Channel
- By Performance
- Spain
- Pricing Analysis
- Market Share Analysis, 2025
- By Resin Type
- By Application
- By Well Type
- By Sales Channel
- By Performance
- France
- Pricing Analysis
- Market Share Analysis, 2025
- By Resin Type
- By Application
- By Well Type
- By Sales Channel
- By Performance
- India
- Pricing Analysis
- Market Share Analysis, 2025
- By Resin Type
- By Application
- By Well Type
- By Sales Channel
- By Performance
- ASEAN
- Pricing Analysis
- Market Share Analysis, 2025
- By Resin Type
- By Application
- By Well Type
- By Sales Channel
- By Performance
- Australia and New Zealand
- Pricing Analysis
- Market Share Analysis, 2025
- By Resin Type
- By Application
- By Well Type
- By Sales Channel
- By Performance
- China
- Pricing Analysis
- Market Share Analysis, 2025
- By Resin Type
- By Application
- By Well Type
- By Sales Channel
- By Performance
- Japan
- Pricing Analysis
- Market Share Analysis, 2025
- By Resin Type
- By Application
- By Well Type
- By Sales Channel
- By Performance
- South Korea
- Pricing Analysis
- Market Share Analysis, 2025
- By Resin Type
- By Application
- By Well Type
- By Sales Channel
- By Performance
- Poland
- Pricing Analysis
- Market Share Analysis, 2025
- By Resin Type
- By Application
- By Well Type
- By Sales Channel
- By Performance
- Hungary
- Pricing Analysis
- Market Share Analysis, 2025
- By Resin Type
- By Application
- By Well Type
- By Sales Channel
- By Performance
- Türkiye
- Pricing Analysis
- Market Share Analysis, 2025
- By Resin Type
- By Application
- By Well Type
- By Sales Channel
- By Performance
- South Africa
- Pricing Analysis
- Market Share Analysis, 2025
- By Resin Type
- By Application
- By Well Type
- By Sales Channel
- By Performance
- United States
- Market Structure Analysis
- Competition Dashboard
- Competition Benchmarking
- Market Share Analysis of Top Players
- By Regional
- By Resin Type
- By Application
- By Well Type
- By Sales Channel
- By Performance
- Emerging Startups
- Innovation Benchmarking
- Competition Analysis
- Competition Deep Dive
- Bakelite Synthetics
- Overview
- Product Portfolio
- Profitability by Market Segments
- Sales Footprint
- Strategy Overview
- Marketing Strategy
- Product Strategy
- Channel Strategy
- Iron Oak Energy Solutions LLC
- CARBO Ceramics, LLC
- Halliburton Company
- BASF SE
- Baker Hughes Company
- Preferred Sands
- ChangQing Proppant Corporation
- SLB
- Jinan Shengquan Group Share-Holding Co., Ltd.
- Bakelite Synthetics
- Case Studies
- Success Stories
- Recent Developments
- Competition Deep Dive
- Assumptions & Acronyms Used


