Saturated Polyester Resin Market Size and Share Forecast Outlook From 2024 to 2034

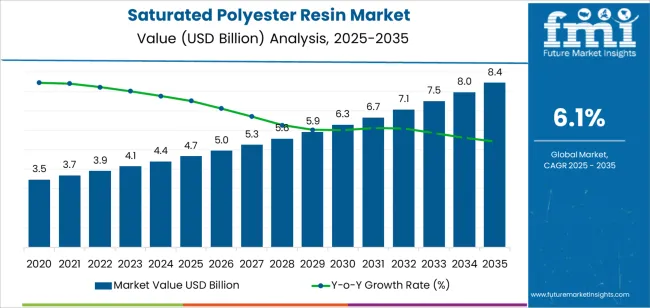
The saturated polyester resin market is set to be valued at USD 4.4 billion in 2024 and is projected to reach USD 8 billion by 2034, exhibiting a modest CAGR of 6.10% over the forecast period.

Attributes Key Statistics
Estimated Saturated Polyester Resin Market Value (2024) USD 4.4 billion
Forecasted Market Value (2034) USD 8 billion
Projected Growth (2024 to 2034) 6.10% CAGR

Factors Driving the Demand for Saturated Polyester Resin

The saturated polyester resin market generated an estimated revenue of USD 2.9 billion in 2019. Over the span of four years, the market grew at a pace of 9.00% CAGR and added revenue of USD 4.1 billion in 2023. Several reasons can be attributed to this growth:

  • Increased demand from the automotive industry for coatings and composite materials due to their excellent mechanical properties and durability.
  • Growing construction activities worldwide, particularly in emerging economies, are driving the demand for high-performance coatings, adhesives, and sealants.
  • Expansion of the packaging industry, particularly in the food and beverage sector, is leading to increased usage of saturated polyester resins for flexible packaging applications.
  • Advancements in resin technology are leading to the development of novel formulations with improved performance characteristics, such as enhanced UV resistance and thermal stability.
  • Rising consumer awareness regarding sustainable and environmentally friendly products is leading to the adoption of bio-based and recycled saturated polyester resins.
  • Increasing investments in infrastructure projects, such as bridges, roads, and railways, are boosting the demand for corrosion-resistant coatings and composite materials.
  • Growing adoption of powder coatings in various end-use industries due to their superior performance, ease of application, and environmental advantages.
  • Expansion of the electronics industry, particularly in the Asia Pacific, is driving the demand for specialized coatings and encapsulation materials.
  • Rapid industrialization and urbanization in developing countries are leading to increased demand for industrial coatings, composites, and laminates for infrastructure and manufacturing applications.

Consumption Trends Shaping the Saturated Polyester Resin Market

  • The global automotive sector is increasingly adopting saturated polyester resins, which are used in coatings for automotive parts and components, as well as in composite materials for lightweight and structural applications.
  • The sales of saturated polyester resins are also growing among companies involved in the construction sector. They are utilized in architectural coatings, flooring materials, adhesives, sealants, and composite materials for infrastructure projects.
  • Saturated polyester resins are also experiencing increasing demand from packaging companies. They are used in flexible packaging films, laminates, and coatings for food and beverage, pharmaceutical, and consumer goods packaging.
  • Businesses involved in the electronics industry also incorporate saturated polyester resins in coatings, encapsulants, and potting materials for electronic components and devices.
  • The growing adoption of saturated polyester resins is also observed in aerospace applications, where they are used in coatings for aircraft exteriors and interiors, as well as in composite materials for lightweight and structural components.
  • The sales of saturated polyester resins are also soaring in furniture and woodwork ventures. They provide coatings and laminates for furniture, cabinetry, and woodworking applications.

Factors Restraining the Growth of the Saturated Polyester Resin Market

The market is anticipated to surpass a valuation of USD 8 billion by 2034, with a growth rate of 6.10% CAGR. While the market is expected to experience remarkable growth, several restraining factors could adversely affect its development:

  • Alternative resin technologies and materials such as epoxy, polyurethane, and acrylic resins are considered to offer enhanced performance at comparatively lower prices. This perception among consumers is slowing down the adoption of saturated polyester resins in the international market.
  • The adoption of saturated polyester resins is also hindered by limited availability, higher costs, and technical challenges in formulation and processing.
  • The world is constantly moving toward sustainability and eco-friendly packaging materials. Polyester resins are considered harmful to the environment and are thus avoided by eco-conscious businesses and individuals.

Saturated Polyester Resin Industry Analysis by Top Investment Segments

Industries are Increasingly Preferring Saturated Polyester Resins for Coatings

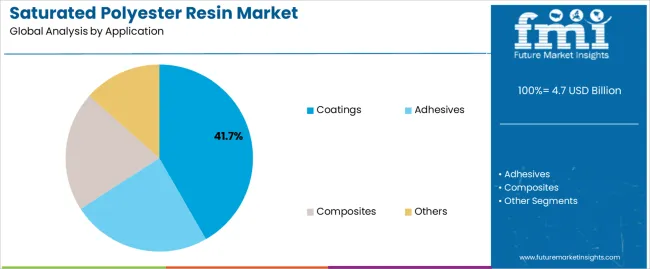
Depending on the applications, the saturated polyester resin market is bifurcated into coatings, adhesives, and composites. The coatings segment is anticipated to develop at a moderate CAGR of 6.00% through 2034.

  • The demand for saturated polyester resins for coatings is skyrocketing among manufacturing units as they provide long-lasting protection against corrosion, weathering, and abrasion.
  • They also ensure strong bonding to various substrates, including metals, plastics, and wood, making them highly versatile and suitable for a wide range of applications.
  • Saturated polyester resins are also preferred by businesses as they maintain color stability and prevent degradation when exposed to sunlight.
Attributes Details
Applications Coatings
Forecasted CAGR (2024 to 2034) 6.00%

Saturated Polyester Resins Find their Place in the Automotive Industry

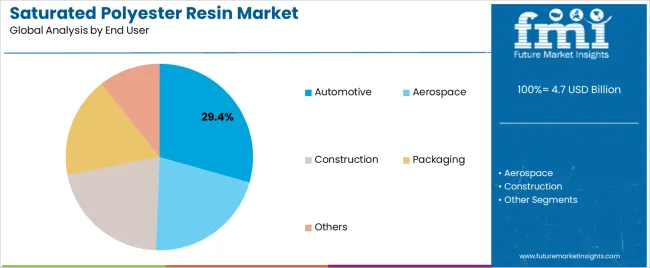
The saturated polyester resin market is categorized by end-users into automotive, aerospace, construction, and packaging. The automotive segment dominates the market and is anticipated to develop at a modest CAGR of 5.70% through 2034.

  • Businesses are increasingly preferring saturated polyester resins as they provide long-lasting protection against rust and corrosion, enhancing the durability of automotive components.
  • Saturated polyester resins can also withstand exposure to automotive fluids such as fuels, oils, and solvents. This is essential for vehicles in harsh weather conditions such as deserts, snow, and rough terrains.
Attributes Details
End-user Automotive
Forecasted CAGR (2024 to 2034) 5.70%

Analysis of Top Countries, Producing and Utilizing Saturated Polyester Resin

The section provides an analysis of the saturated polyester resin market by country, including Japan, China, the United States, South Korea, and the United Kingdom. The table presents the CAGR for each country, indicating the expected market growth in each respective country through 2034.

Countries Forecasted CAGR (2024 to 2034)
Japan 7.40%
United Kingdom 7.20%
South Korea 6.90%
China 6.80%
United States 6.20%

Saturated Polyester Resin Market in South Korea

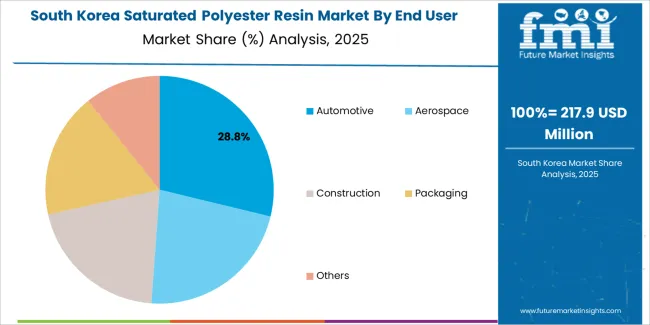
South Korea is one of the leading countries in this market. The South Korea saturated polyester resin market is anticipated to maintain its position by progressing at an annual growth rate of 6.90% until 2034.

  • South Korea is blessed with a robust manufacturing hub, particularly in electronics, automotive, and construction. This naturally drives the demand for high-quality coatings and composite materials made from saturated polyester resins, contributing to the global market.
  • A significant portion of South Korea's GDP comes from the export of electronics, automotive, and petrochemicals, which extensively utilize saturated polyester resins in various applications, leading to sustained market growth for saturated resins in the country.

Saturated Polyester Resin Market in the United Kingdom

The United Kingdom also holds a strong position in the saturated polyester resin industry. The United Kingdom saturated polyester resin market is anticipated to maintain its dominance by progressing at an annual growth rate of 7.20% until 2034.

  • The United Kingdom government has been heavily investing in infrastructural development projects, including construction, transportation, and utilities, for the past few years. This has fueled the demand for protective coatings and composite materials made from saturated polyester resins, contributing to market growth.
  • The United Kingdom is highly concerned about its environmental impact, which has stimulated the demand for sustainable alternatives in industries for coatings, thus boosting the market for eco-friendly saturated polyester resins.

Saturated Polyester Resin Market in China

China, too, dominates the saturated polyester resin industry in the international marketplace after the United States. The Chinese saturated polyester resin market is anticipated to exhibit an annual growth rate of 6.80% until 2034.

  • The automotive industry in China is experiencing a massive surge due to supportive government policies and rising consumer demand. Saturated polyester resins are one of the essential components in this industry, aiding the growth of the market.
  • China's position as a global manufacturing hub for various industries, including electronics, packaging, and consumer goods, generates significant demand for saturated polyester resins in applications such as coatings. This factor also contributes to the exponential expansion of the saturated polyester resins market in the country.

Saturated Polyester Resin Market in the United States

The United States tops the chart when it comes to dominating the saturated polyester resin market, which is anticipated to register a CAGR of 6.20% through 2034.

  • The revival of manufacturing activities in the United States due to reshoring initiatives, technological advancements, and a favorable business environment has also fueled the demand for saturated polyester resins in industries such as automotive, aerospace, and construction.
  • Similar to the United Kingdom, the United States government's investments in infrastructure renewal and modernization projects, including transportation, utilities, and public facilities, have also driven the demand for protective coatings and composite materials made from saturated polyester resins.

Saturated polyester resin Market in Japan

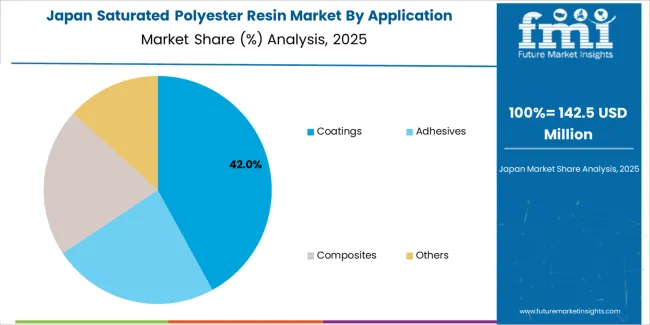
Japan, too, is one of the leading countries in the saturated polyester resin industry. Over the next ten years, the Japanese demand for saturated polyester resins is projected to rise at a 7.40% CAGR.
  • Japan is home to some of the leading automobile companies in the world, such as Toyota and Nissan. These companies' presence in the country automatically drives excellent demand for saturated polyester resins for high-quality coatings and composite materials.
  • The country is also known for its technological innovations in material science and its drive towards sustainability. Key market players in Japan have already started adopting saturated polyester resins for coatings as they are less harmful to the environment. This is one of the main factors for their widespread adoption in the country.

Key Players and Market Concentration in the Saturated Polyester Resin Industry

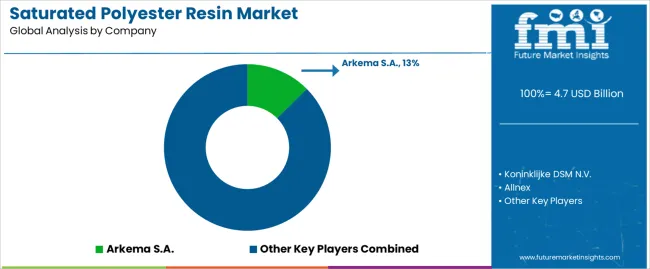
The global market for saturated polyester resins is very competitive and includes many players catering to both international and domestic consumers, such as Koninklijke DSM N.V., Allnex, Arkema S.A., Hitachi Chemical Co. Ltd., and Stepan Company.

These companies generally serve automotive, aerospace, and manufacturing sectors where polyester resins are used to provide protective coatings, adhesives, and composite materials. Key market players are also heavily investing to make their offerings less harmful to the environment, lightweight, and affordable to expand their consumer base.

Recent Developments

  • In December 2023, BASF supplied Neopentyl Glycol from Zhanjiang to KHUA, aiding in meeting the rising demand for low-emission powder coatings not only in China but also in the entire Asia Pacific region. KHUA planned a 100 KT/a production plant for high-end saturated polyester resins in Zhanjiang.
  • In January 2024, Arkema, a leading player in saturated polyester resins, finalized a 20-year solar PPA with EDF Renewables, securing 70% of Bostik's French sites' electricity needs. The deal, totaling 400 GWh annually, marks a significant step toward sustainable energy consumption.

Leading Suppliers in the Global Saturated Polyester Resin Market

  • Koninklijke DSM N.V.
  • Allnex
  • Arkema S.A.
  • Hitachi Chemical Co. Ltd.
  • Stepan Company
  • Nuplex Industries Ltd.
  • Evonik Industries AG
  • Covestro AG
  • Eternal Materials Co., Ltd.
  • Dynea AS
  • Hexion Inc.
  • Polynt SpA
  • Reichhold LLC
  • Royal Adhesives & Sealants
  • Showa Denko K.K.
  • Helios Group
  • Sika AG
  • Scott Bader Company Ltd.
  • Interplastic Corporation
  • AOC Resins

Key Shifting Preferences Covered in the Saturated Polyester Resin Market Report

  • Saturated Polyester Resin Manufacturers in India
  • Advantages of Saturated Polyester Resin over Unsaturated Resins
  • Applications of Saturated Polyester Resin in the Industrial Landscape
  • Competition Analysis of the Largest Exporter of Saturated Polyester Resins
  • In-depth Study on the Most Preferred Resin in the Manufacturing Industry
  • Demand Analysis of Saturated Polyester Resin for Durable TGIC Powder Coatings

Top Segments Studied in the Saturated Polyester Resin Market

By Application:

  • Coatings
  • Adhesives
  • Composites
  • Others

By End-user:

  • Automotive
  • Aerospace
  • Construction
  • Packaging
  • Others

By Region:

  • North America
  • Latin America
  • Asia Pacific
  • Middle East and Africa (MEA)
  • Europe

Table of Content

  • 1. Executive Summary
  • 2. Market Overview
  • 3. Market Background
  • 4. Global Market Analysis 2019 to 2023 and Forecast, 2024 to 2034
  • 5. Global Market Analysis 2019 to 2023 and Forecast 2024 to 2034, By Application
    • 5.1. Coatings
    • 5.2. Adhesives
    • 5.3. Composites
    • 5.4. Others
  • 6. Global Market Analysis 2019 to 2023 and Forecast 2024 to 2034, By End-user
    • 6.1. Automotive
    • 6.2. Aerospace
    • 6.3. Construction
    • 6.4. Packaging
    • 6.5. Others
  • 7. Global Market Analysis 2019 to 2023 and Forecast 2024 to 2034, By Region
    • 7.1. North America
    • 7.2. Latin America
    • 7.3. Western Europe
    • 7.4. Eastern Europe
    • 7.5. South Asia and Pacific
    • 7.6. East Asia
    • 7.7. Middle East and Africa
  • 8. North America Market Analysis 2019 to 2023 and Forecast 2024 to 2034, By Country
  • 9. Latin America Market Analysis 2019 to 2023 and Forecast 2024 to 2034, By Country
  • 10. Western Europe Market Analysis 2019 to 2023 and Forecast 2024 to 2034, By Country
  • 11. Eastern Europe Market Analysis 2019 to 2023 and Forecast 2024 to 2034, By Country
  • 12. South Asia and Pacific Market Analysis 2019 to 2023 and Forecast 2024 to 2034, By Country
  • 13. East Asia Market Analysis 2019 to 2023 and Forecast 2024 to 2034, By Country
  • 14. Middle East and Africa Market Analysis 2019 to 2023 and Forecast 2024 to 2034, By Country
  • 15. Key Countries Market Analysis
  • 16. Market Structure Analysis
  • 17. Competition Analysis
    • 17.1. Koninklijke DSM N.V.
    • 17.2. Allnex
    • 17.3. Arkema S.A.
    • 17.4. Stepan Company
    • 17.5. Evonik Industries
    • 17.6. Mitsubishi Chemical Corporation
    • 17.7. Covestro AG
    • 17.8. Eternal Materials Co., Ltd.
    • 17.9. CIECH S.A.
  • 18. Assumptions & Acronyms Used
  • 19. Research Methodology

List of Tables

Table 1: Global Market Value (US$ Million) Forecast by Region, 2019 to 2034

Table 2: Global Market Volume (Tons) Forecast by Region, 2019 to 2034

Table 3: Global Market Value (US$ Million) Forecast by Application, 2019 to 2034

Table 4: Global Market Volume (Tons) Forecast by Application, 2019 to 2034

Table 5: Global Market Value (US$ Million) Forecast by End-user, 2019 to 2034

Table 6: Global Market Volume (Tons) Forecast by End-user, 2019 to 2034

Table 7: North America Market Value (US$ Million) Forecast by Country, 2019 to 2034

Table 8: North America Market Volume (Tons) Forecast by Country, 2019 to 2034

Table 9: North America Market Value (US$ Million) Forecast by Application, 2019 to 2034

Table 10: North America Market Volume (Tons) Forecast by Application, 2019 to 2034

Table 11: North America Market Value (US$ Million) Forecast by End-user, 2019 to 2034

Table 12: North America Market Volume (Tons) Forecast by End-user, 2019 to 2034

Table 13: Latin America Market Value (US$ Million) Forecast by Country, 2019 to 2034

Table 14: Latin America Market Volume (Tons) Forecast by Country, 2019 to 2034

Table 15: Latin America Market Value (US$ Million) Forecast by Application, 2019 to 2034

Table 16: Latin America Market Volume (Tons) Forecast by Application, 2019 to 2034

Table 17: Latin America Market Value (US$ Million) Forecast by End-user, 2019 to 2034

Table 18: Latin America Market Volume (Tons) Forecast by End-user, 2019 to 2034

Table 19: Western Europe Market Value (US$ Million) Forecast by Country, 2019 to 2034

Table 20: Western Europe Market Volume (Tons) Forecast by Country, 2019 to 2034

Table 21: Western Europe Market Value (US$ Million) Forecast by Application, 2019 to 2034

Table 22: Western Europe Market Volume (Tons) Forecast by Application, 2019 to 2034

Table 23: Western Europe Market Value (US$ Million) Forecast by End-user, 2019 to 2034

Table 24: Western Europe Market Volume (Tons) Forecast by End-user, 2019 to 2034

Table 25: Eastern Europe Market Value (US$ Million) Forecast by Country, 2019 to 2034

Table 26: Eastern Europe Market Volume (Tons) Forecast by Country, 2019 to 2034

Table 27: Eastern Europe Market Value (US$ Million) Forecast by Application, 2019 to 2034

Table 28: Eastern Europe Market Volume (Tons) Forecast by Application, 2019 to 2034

Table 29: Eastern Europe Market Value (US$ Million) Forecast by End-user, 2019 to 2034

Table 30: Eastern Europe Market Volume (Tons) Forecast by End-user, 2019 to 2034

Table 31: South Asia and Pacific Market Value (US$ Million) Forecast by Country, 2019 to 2034

Table 32: South Asia and Pacific Market Volume (Tons) Forecast by Country, 2019 to 2034

Table 33: South Asia and Pacific Market Value (US$ Million) Forecast by Application, 2019 to 2034

Table 34: South Asia and Pacific Market Volume (Tons) Forecast by Application, 2019 to 2034

Table 35: South Asia and Pacific Market Value (US$ Million) Forecast by End-user, 2019 to 2034

Table 36: South Asia and Pacific Market Volume (Tons) Forecast by End-user, 2019 to 2034

Table 37: East Asia Market Value (US$ Million) Forecast by Country, 2019 to 2034

Table 38: East Asia Market Volume (Tons) Forecast by Country, 2019 to 2034

Table 39: East Asia Market Value (US$ Million) Forecast by Application, 2019 to 2034

Table 40: East Asia Market Volume (Tons) Forecast by Application, 2019 to 2034

Table 41: East Asia Market Value (US$ Million) Forecast by End-user, 2019 to 2034

Table 42: East Asia Market Volume (Tons) Forecast by End-user, 2019 to 2034

Table 43: Middle East and Africa Market Value (US$ Million) Forecast by Country, 2019 to 2034

Table 44: Middle East and Africa Market Volume (Tons) Forecast by Country, 2019 to 2034

Table 45: Middle East and Africa Market Value (US$ Million) Forecast by Application, 2019 to 2034

Table 46: Middle East and Africa Market Volume (Tons) Forecast by Application, 2019 to 2034

Table 47: Middle East and Africa Market Value (US$ Million) Forecast by End-user, 2019 to 2034

Table 48: Middle East and Africa Market Volume (Tons) Forecast by End-user, 2019 to 2034

List of Figures

Figure 1: Global Market Value (US$ Million) by Application, 2024 to 2034

Figure 2: Global Market Value (US$ Million) by End-user, 2024 to 2034

Figure 3: Global Market Value (US$ Million) by Region, 2024 to 2034

Figure 4: Global Market Value (US$ Million) Analysis by Region, 2019 to 2034

Figure 5: Global Market Volume (Tons) Analysis by Region, 2019 to 2034

Figure 6: Global Market Value Share (%) and BPS Analysis by Region, 2024 to 2034

Figure 7: Global Market Y-o-Y Growth (%) Projections by Region, 2024 to 2034

Figure 8: Global Market Value (US$ Million) Analysis by Application, 2019 to 2034

Figure 9: Global Market Volume (Tons) Analysis by Application, 2019 to 2034

Figure 10: Global Market Value Share (%) and BPS Analysis by Application, 2024 to 2034

Figure 11: Global Market Y-o-Y Growth (%) Projections by Application, 2024 to 2034

Figure 12: Global Market Value (US$ Million) Analysis by End-user, 2019 to 2034

Figure 13: Global Market Volume (Tons) Analysis by End-user, 2019 to 2034

Figure 14: Global Market Value Share (%) and BPS Analysis by End-user, 2024 to 2034

Figure 15: Global Market Y-o-Y Growth (%) Projections by End-user, 2024 to 2034

Figure 16: Global Market Attractiveness by Application, 2024 to 2034

Figure 17: Global Market Attractiveness by End-user, 2024 to 2034

Figure 18: Global Market Attractiveness by Region, 2024 to 2034

Figure 19: North America Market Value (US$ Million) by Application, 2024 to 2034

Figure 20: North America Market Value (US$ Million) by End-user, 2024 to 2034

Figure 21: North America Market Value (US$ Million) by Country, 2024 to 2034

Figure 22: North America Market Value (US$ Million) Analysis by Country, 2019 to 2034

Figure 23: North America Market Volume (Tons) Analysis by Country, 2019 to 2034

Figure 24: North America Market Value Share (%) and BPS Analysis by Country, 2024 to 2034

Figure 25: North America Market Y-o-Y Growth (%) Projections by Country, 2024 to 2034

Figure 26: North America Market Value (US$ Million) Analysis by Application, 2019 to 2034

Figure 27: North America Market Volume (Tons) Analysis by Application, 2019 to 2034

Figure 28: North America Market Value Share (%) and BPS Analysis by Application, 2024 to 2034

Figure 29: North America Market Y-o-Y Growth (%) Projections by Application, 2024 to 2034

Figure 30: North America Market Value (US$ Million) Analysis by End-user, 2019 to 2034

Figure 31: North America Market Volume (Tons) Analysis by End-user, 2019 to 2034

Figure 32: North America Market Value Share (%) and BPS Analysis by End-user, 2024 to 2034

Figure 33: North America Market Y-o-Y Growth (%) Projections by End-user, 2024 to 2034

Figure 34: North America Market Attractiveness by Application, 2024 to 2034

Figure 35: North America Market Attractiveness by End-user, 2024 to 2034

Figure 36: North America Market Attractiveness by Country, 2024 to 2034

Figure 37: Latin America Market Value (US$ Million) by Application, 2024 to 2034

Figure 38: Latin America Market Value (US$ Million) by End-user, 2024 to 2034

Figure 39: Latin America Market Value (US$ Million) by Country, 2024 to 2034

Figure 40: Latin America Market Value (US$ Million) Analysis by Country, 2019 to 2034

Figure 41: Latin America Market Volume (Tons) Analysis by Country, 2019 to 2034

Figure 42: Latin America Market Value Share (%) and BPS Analysis by Country, 2024 to 2034

Figure 43: Latin America Market Y-o-Y Growth (%) Projections by Country, 2024 to 2034

Figure 44: Latin America Market Value (US$ Million) Analysis by Application, 2019 to 2034

Figure 45: Latin America Market Volume (Tons) Analysis by Application, 2019 to 2034

Figure 46: Latin America Market Value Share (%) and BPS Analysis by Application, 2024 to 2034

Figure 47: Latin America Market Y-o-Y Growth (%) Projections by Application, 2024 to 2034

Figure 48: Latin America Market Value (US$ Million) Analysis by End-user, 2019 to 2034

Figure 49: Latin America Market Volume (Tons) Analysis by End-user, 2019 to 2034

Figure 50: Latin America Market Value Share (%) and BPS Analysis by End-user, 2024 to 2034

Figure 51: Latin America Market Y-o-Y Growth (%) Projections by End-user, 2024 to 2034

Figure 52: Latin America Market Attractiveness by Application, 2024 to 2034

Figure 53: Latin America Market Attractiveness by End-user, 2024 to 2034

Figure 54: Latin America Market Attractiveness by Country, 2024 to 2034

Figure 55: Western Europe Market Value (US$ Million) by Application, 2024 to 2034

Figure 56: Western Europe Market Value (US$ Million) by End-user, 2024 to 2034

Figure 57: Western Europe Market Value (US$ Million) by Country, 2024 to 2034

Figure 58: Western Europe Market Value (US$ Million) Analysis by Country, 2019 to 2034

Figure 59: Western Europe Market Volume (Tons) Analysis by Country, 2019 to 2034

Figure 60: Western Europe Market Value Share (%) and BPS Analysis by Country, 2024 to 2034

Figure 61: Western Europe Market Y-o-Y Growth (%) Projections by Country, 2024 to 2034

Figure 62: Western Europe Market Value (US$ Million) Analysis by Application, 2019 to 2034

Figure 63: Western Europe Market Volume (Tons) Analysis by Application, 2019 to 2034

Figure 64: Western Europe Market Value Share (%) and BPS Analysis by Application, 2024 to 2034

Figure 65: Western Europe Market Y-o-Y Growth (%) Projections by Application, 2024 to 2034

Figure 66: Western Europe Market Value (US$ Million) Analysis by End-user, 2019 to 2034

Figure 67: Western Europe Market Volume (Tons) Analysis by End-user, 2019 to 2034

Figure 68: Western Europe Market Value Share (%) and BPS Analysis by End-user, 2024 to 2034

Figure 69: Western Europe Market Y-o-Y Growth (%) Projections by End-user, 2024 to 2034

Figure 70: Western Europe Market Attractiveness by Application, 2024 to 2034

Figure 71: Western Europe Market Attractiveness by End-user, 2024 to 2034

Figure 72: Western Europe Market Attractiveness by Country, 2024 to 2034

Figure 73: Eastern Europe Market Value (US$ Million) by Application, 2024 to 2034

Figure 74: Eastern Europe Market Value (US$ Million) by End-user, 2024 to 2034

Figure 75: Eastern Europe Market Value (US$ Million) by Country, 2024 to 2034

Figure 76: Eastern Europe Market Value (US$ Million) Analysis by Country, 2019 to 2034

Figure 77: Eastern Europe Market Volume (Tons) Analysis by Country, 2019 to 2034

Figure 78: Eastern Europe Market Value Share (%) and BPS Analysis by Country, 2024 to 2034

Figure 79: Eastern Europe Market Y-o-Y Growth (%) Projections by Country, 2024 to 2034

Figure 80: Eastern Europe Market Value (US$ Million) Analysis by Application, 2019 to 2034

Figure 81: Eastern Europe Market Volume (Tons) Analysis by Application, 2019 to 2034

Figure 82: Eastern Europe Market Value Share (%) and BPS Analysis by Application, 2024 to 2034

Figure 83: Eastern Europe Market Y-o-Y Growth (%) Projections by Application, 2024 to 2034

Figure 84: Eastern Europe Market Value (US$ Million) Analysis by End-user, 2019 to 2034

Figure 85: Eastern Europe Market Volume (Tons) Analysis by End-user, 2019 to 2034

Figure 86: Eastern Europe Market Value Share (%) and BPS Analysis by End-user, 2024 to 2034

Figure 87: Eastern Europe Market Y-o-Y Growth (%) Projections by End-user, 2024 to 2034

Figure 88: Eastern Europe Market Attractiveness by Application, 2024 to 2034

Figure 89: Eastern Europe Market Attractiveness by End-user, 2024 to 2034

Figure 90: Eastern Europe Market Attractiveness by Country, 2024 to 2034

Figure 91: South Asia and Pacific Market Value (US$ Million) by Application, 2024 to 2034

Figure 92: South Asia and Pacific Market Value (US$ Million) by End-user, 2024 to 2034

Figure 93: South Asia and Pacific Market Value (US$ Million) by Country, 2024 to 2034

Figure 94: South Asia and Pacific Market Value (US$ Million) Analysis by Country, 2019 to 2034

Figure 95: South Asia and Pacific Market Volume (Tons) Analysis by Country, 2019 to 2034

Figure 96: South Asia and Pacific Market Value Share (%) and BPS Analysis by Country, 2024 to 2034

Figure 97: South Asia and Pacific Market Y-o-Y Growth (%) Projections by Country, 2024 to 2034

Figure 98: South Asia and Pacific Market Value (US$ Million) Analysis by Application, 2019 to 2034

Figure 99: South Asia and Pacific Market Volume (Tons) Analysis by Application, 2019 to 2034

Figure 100: South Asia and Pacific Market Value Share (%) and BPS Analysis by Application, 2024 to 2034

Figure 101: South Asia and Pacific Market Y-o-Y Growth (%) Projections by Application, 2024 to 2034

Figure 102: South Asia and Pacific Market Value (US$ Million) Analysis by End-user, 2019 to 2034

Figure 103: South Asia and Pacific Market Volume (Tons) Analysis by End-user, 2019 to 2034

Figure 104: South Asia and Pacific Market Value Share (%) and BPS Analysis by End-user, 2024 to 2034

Figure 105: South Asia and Pacific Market Y-o-Y Growth (%) Projections by End-user, 2024 to 2034

Figure 106: South Asia and Pacific Market Attractiveness by Application, 2024 to 2034

Figure 107: South Asia and Pacific Market Attractiveness by End-user, 2024 to 2034

Figure 108: South Asia and Pacific Market Attractiveness by Country, 2024 to 2034

Figure 109: East Asia Market Value (US$ Million) by Application, 2024 to 2034

Figure 110: East Asia Market Value (US$ Million) by End-user, 2024 to 2034

Figure 111: East Asia Market Value (US$ Million) by Country, 2024 to 2034

Figure 112: East Asia Market Value (US$ Million) Analysis by Country, 2019 to 2034

Figure 113: East Asia Market Volume (Tons) Analysis by Country, 2019 to 2034

Figure 114: East Asia Market Value Share (%) and BPS Analysis by Country, 2024 to 2034

Figure 115: East Asia Market Y-o-Y Growth (%) Projections by Country, 2024 to 2034

Figure 116: East Asia Market Value (US$ Million) Analysis by Application, 2019 to 2034

Figure 117: East Asia Market Volume (Tons) Analysis by Application, 2019 to 2034

Figure 118: East Asia Market Value Share (%) and BPS Analysis by Application, 2024 to 2034

Figure 119: East Asia Market Y-o-Y Growth (%) Projections by Application, 2024 to 2034

Figure 120: East Asia Market Value (US$ Million) Analysis by End-user, 2019 to 2034

Figure 121: East Asia Market Volume (Tons) Analysis by End-user, 2019 to 2034

Figure 122: East Asia Market Value Share (%) and BPS Analysis by End-user, 2024 to 2034

Figure 123: East Asia Market Y-o-Y Growth (%) Projections by End-user, 2024 to 2034

Figure 124: East Asia Market Attractiveness by Application, 2024 to 2034

Figure 125: East Asia Market Attractiveness by End-user, 2024 to 2034

Figure 126: East Asia Market Attractiveness by Country, 2024 to 2034

Figure 127: Middle East and Africa Market Value (US$ Million) by Application, 2024 to 2034

Figure 128: Middle East and Africa Market Value (US$ Million) by End-user, 2024 to 2034

Figure 129: Middle East and Africa Market Value (US$ Million) by Country, 2024 to 2034

Figure 130: Middle East and Africa Market Value (US$ Million) Analysis by Country, 2019 to 2034

Figure 131: Middle East and Africa Market Volume (Tons) Analysis by Country, 2019 to 2034

Figure 132: Middle East and Africa Market Value Share (%) and BPS Analysis by Country, 2024 to 2034

Figure 133: Middle East and Africa Market Y-o-Y Growth (%) Projections by Country, 2024 to 2034

Figure 134: Middle East and Africa Market Value (US$ Million) Analysis by Application, 2019 to 2034

Figure 135: Middle East and Africa Market Volume (Tons) Analysis by Application, 2019 to 2034

Figure 136: Middle East and Africa Market Value Share (%) and BPS Analysis by Application, 2024 to 2034

Figure 137: Middle East and Africa Market Y-o-Y Growth (%) Projections by Application, 2024 to 2034

Figure 138: Middle East and Africa Market Value (US$ Million) Analysis by End-user, 2019 to 2034

Figure 139: Middle East and Africa Market Volume (Tons) Analysis by End-user, 2019 to 2034

Figure 140: Middle East and Africa Market Value Share (%) and BPS Analysis by End-user, 2024 to 2034

Figure 141: Middle East and Africa Market Y-o-Y Growth (%) Projections by End-user, 2024 to 2034

Figure 142: Middle East and Africa Market Attractiveness by Application, 2024 to 2034

Figure 143: Middle East and Africa Market Attractiveness by End-user, 2024 to 2034

Figure 144: Middle East and Africa Market Attractiveness by Country, 2024 to 2034

Frequently Asked Questions

How Big is the Saturated Polyester Resin Market?

The current worth of the saturated polyester resin market is USD 4.4 billion in 2024.

What is the Sales Forecast for Saturated Polyester Resins through 2034?

The market for saturated polyester resins is expected to reach USD 8 billion by 2034.

At What Rate is the Saturated Polyester Resin Market Growing?

The market is projected to develop at a CAGR of 6.10% from 2024 to 2034.

Who are the Key Companies Offering Saturated Polyester Resins?

Koninklijke DSM N.V., Allnex, Arkema S.A., Hitachi Chemical Co. Ltd., and Stepan Company are some of the key players in the market.

What was the Overall Value of the Saturated Polyester Resin Market in 2023?

The valuation of the market in 2023 was USD 4.1 billion.

Explore Similar Insights

Future Market Insights

Saturated Polyester Resin Market