
- Market Size (2026)
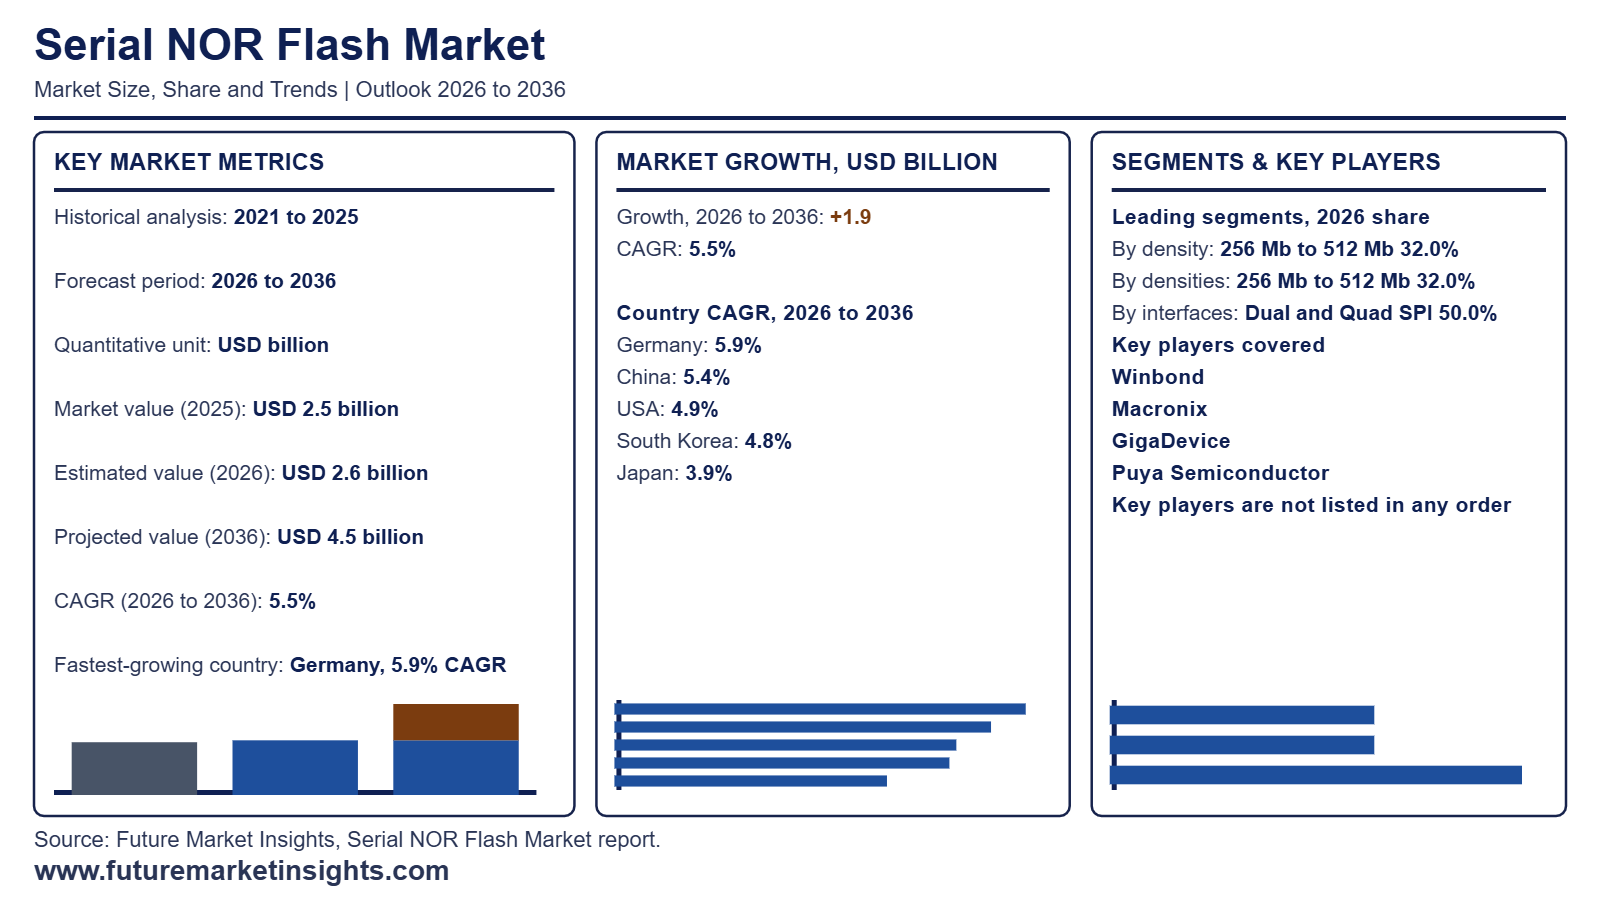
- USD 2.6 Bn
- Forecast (2036)
- USD 4.5 Bn
- CAGR (2026 to 2036)
- 5.5%
How Big Is the Serial NOR Flash Market in 2026?
The global serial NOR flash market is valued at USD 2.6 billion in 2026, up from USD 2.5 billion in 2025, and is projected by Future Market Insights (FMI) to reach USD 4.5 billion by 2036, expanding at a 5.5% CAGR over the 2026 to 2036 forecast period.
| Market Metric | Valuation / Share / Forecast Benchmark |
|---|---|
| 2025 Market Size (Historical) | USD 2.5 billion |
| 2026 Market Size (Estimated) | USD 2.6 billion |
| 2036 Market Size (Projected) | USD 4.5 billion |
| Compound Annual Growth Rate (2026 to 2036) | 5.5% CAGR |
| Incremental Dollar Opportunity (2026 to 2036) | USD 1.9 billion |
| Dominant Density (2026 to 2036 Share) | 256 Mb to 512 Mb (32.0% in 2026, rising to 33.1% by 2036) |
| Leading & Fastest-Growing Densities | 256 Mb to 512 Mb (32.0% share in 2026; 6.0% CAGR) | 1 Gb and Above (7.0% CAGR) |
| Leading & Fastest-Growing Interfaces | Dual and Quad SPI (50.0% share in 2026; 5.6% CAGR) | Octal and XSPI (8.0% CAGR) |
| Leading & Fastest-Growing Applications | Consumer Electronics (27.3% share in 2026; 5.6% CAGR) | Automotive (6.5% CAGR) |
| Largest Country Markets (2026 Global Share) | China (33.0%), USA (14.0%), Japan (11.0%) |
| Fastest-Growing Country Markets (2026 to 2036) | Germany (5.9% CAGR), China (5.4% CAGR), Taiwan (5.0% CAGR) |
| Leading Tier-1 Companies | Winbond, Macronix, GigaDevice, Puya Semiconductor |
Source: Future Market Insights analysis of the serial NOR flash market, 2026.
Executive Market Overview
Serial NOR flash stays embedded in nearly every connected device because it stores the boot code and firmware that processors must read quickly at start-up. AI servers have widened that role since server boards need dedicated memory to load microcode and configuration data. Memory leads the semiconductor industry with a 302% full-year 2026 growth outlook after first-half sales rose 305% (World Semiconductor Trade Statistics August 2026). Higher densities gain from this pull as 1 Gb and Above advances fastest at a 7.0% CAGR while 256 Mb to 512 Mb leads Density at 32.0% with 6.0%. Octal and XSPI grows fastest among interfaces at 8.0% as controllers seek more bandwidth and Dual and Quad SPI holds 50.0% at 5.6%.
Capacity competition from higher-margin NAND and DRAM lines is the restraint specific to this market since fabs serving several memory types can steer wafer starts toward those products. Automotive keeps suppliers committed as the fastest-growing Application at 6.5% while Consumer Electronics holds 27.3% at 5.6%. Germany is the fastest-growing country at a 5.9% CAGR ahead of China at 5.4% and Taiwan at 5.0% as carmakers add software-defined features and zonal controllers. The USA at 4.9% and South Korea at 4.8% advance alongside Japan at 3.9% inside automotive semiconductor programs. Regional demand stays broad as the Americas and Asia Pacific lead the 2027 outlook (World Semiconductor Trade Statistics June 2026). Market sizing covers standalone serial interface NOR chips while excluding parallel NOR and flash embedded in microcontrollers.
Analyst Perspective
The serial NOR flash market is gaining strength as automotive electronics and edge devices call for fast and reliable code storage. Suppliers that deliver higher density and secure low power memory will earn lasting design wins and steady volume growth with leading device makers.
- Sudip Saha, Principal Consultant, Future Market Insights.
Major Market Trends and Insights
- AI Servers Push Serial NOR Toward Higher Density Sockets: Data center builds are changing what a serial NOR socket looks like because boot code and microcode loads now call for larger and faster devices. Suppliers respond by steering wafers toward high density parts that earn richer pricing. Macronix (October 2026) reported NOR flash at 46% of third quarter revenue with growth of 158% year over year and 47% of NOR revenue tied to computers and data centers. Automotive electronics added 10% of NOR revenue. A higher density mix is lifting value per device and placing capacity decisions at the center of supplier strategy. That shift favors providers with advanced process nodes and reliable yield.
- EU Cyber Resilience Act Raises Secure Boot Storage Needs: Connected products sold in Europe must now be built and maintained with security across their full life so firmware storage carries new duties. Secure boot images and signed update copies call for larger flash with built in protection. The European Commission (2026) lists 11 September 2026 as the start of reporting obligations and 11 December 2027 as the date main obligations apply under the Cyber Resilience Act. Manufacturers are therefore specifying secure serial NOR now for designs that will ship through 2027 and beyond. Vendors offering hardware root of trust features gain a clear edge in design wins.
- Winbond Infineon Deal Consolidates Automotive Serial NOR Supply: Automakers want long lived qualified memory so supplier scale and portfolio depth now shape sourcing choices. Infineon (September 2026) agreed to sell its NOR flash and F-RAM business to Winbond in an all cash transaction valued at $1.12 billion with closing targeted for the second half of 2027. The business will carry the Spansion name and serve automotive industrial and infrastructure customers. Rivals are answering with capacity investment as Macronix raised its 2026 capital expenditure to NT$37.8 billion. Long qualification cycles in vehicles keep switching costs high for programs already in production. Customers gain a broader catalog while competition shifts toward supply assurance.
What Are the Main Drivers, Restraints, and Opportunities?
Higher density parts for AI servers and vehicles keep serial NOR orders moving while fab limits and a pending supplier merger complicate allocation and that tension favors suppliers that pair octal xSPI speed with functional safety credentials for German and Chinese automotive programs.
Driver: AI Server Firmware Sockets Pull Densities Upward
An AI server is a collection of processors that each boot from separate code images. BIOS and GPU along with BMC and SmartNIC blocks each keep firmware and recovery copies in NOR so does every added accelerator or controller add a socket and often a larger part. Winbond (November 2026) reported record high-density NOR contribution and called supply tight with price support running into the next year while Winbond (May 2026) pointed to strong end demand earlier. System builders in China and the USA therefore lock density plans well ahead of production across the broader semiconductor memory landscape.
Restraint: Capacity Ceilings and Ownership Change Complicate Supply
Supply responds slowly because larger parts take more silicon per unit and fabs already run close to full. Winbond (November 2026) reported memory utilization near full and a new fab module still awaiting groundbreaking. Ownership is also shifting since Infineon (September 2026) agreed to sell its NOR Flash and F-RAM business to Winbond with closing aimed at the second half of next year. Automotive and industrial buyers in Germany and Japan using Infineon parts need second sources and fresh qualification plans across the broader automotive semiconductor chain. Pricing power meanwhile stays with fab owners while smaller module makers wait for allocation.
Opportunity: Octal Speed Plus Safety Credentials Attract Carmakers
Software-defined vehicles depend on boot memory that starts quickly and meets strict safety classes. Macronix (January 2026) announced ASIL D verification for its OctaFlash and QSPI families and linked that level to risks in ADAS and driver monitoring. GigaDevice (March 2026) showed a family carrying the top functional safety level and the highest automotive grade qualification with eight-channel modes next to its automotive microcontrollers. FMI sees Octal and xSPI leading interface growth and Automotive leading application growth while Germany grows fastest and China is largest. Suppliers pairing certified NOR with microcontroller platforms hold the edge with German and Chinese carmakers.
How Is the Serial NOR Flash Market Segmented?
The global serial NOR flash market is assessed through density and interface and voltage and application and region with each axis presented as its own distribution of revenue that reconciles to the full market.
| Segmentation Axis | Sub-Segments Covered | 2026 Leading Segment and Share | Main Growth Benchmark (2026 to 2036) |
|---|---|---|---|
| Density | 256 Mb to 512 Mb / 64 Mb to 128 Mb / 1 Gb and Above / Up to 32 Mb | 256 Mb to 512 Mb (32.0% revenue share) | 256 Mb to 512 Mb share rises to 33.1% by 2036 at 6.0% CAGR |
| Interface | Dual and Quad SPI / Standard SPI / Octal and XSPI | Dual and Quad SPI (50.0% revenue share) | Dual and Quad SPI grows at 5.6% CAGR to a 50.5% share by 2036 |
| Voltage | 2.7 V to 3.6 V / 1.8 V / 1.2 V / 2.5 V | 2.7 V to 3.6 V (58.0% revenue share) | 2.7 V to 3.6 V grows at 5.2% CAGR to a 56.4% share by 2036 |
| Application | Consumer Electronics / Automotive / Industrial / Computing and Storage / Communications and Networking | Consumer Electronics (27.3% revenue share) | Consumer Electronics grows at 5.6% CAGR to a 27.6% share by 2036 |
| Region | North America / Latin America / Western Europe / Eastern Europe / East Asia / South Asia and Pacific / Middle East and Africa | China (33.0% global country share) | Germany leads country growth at 5.9% CAGR |
Source. Future Market Insights analysis of the serial NOR flash market 2026.
Why Does the 256 Mb to 512 Mb Band Lead by Density?
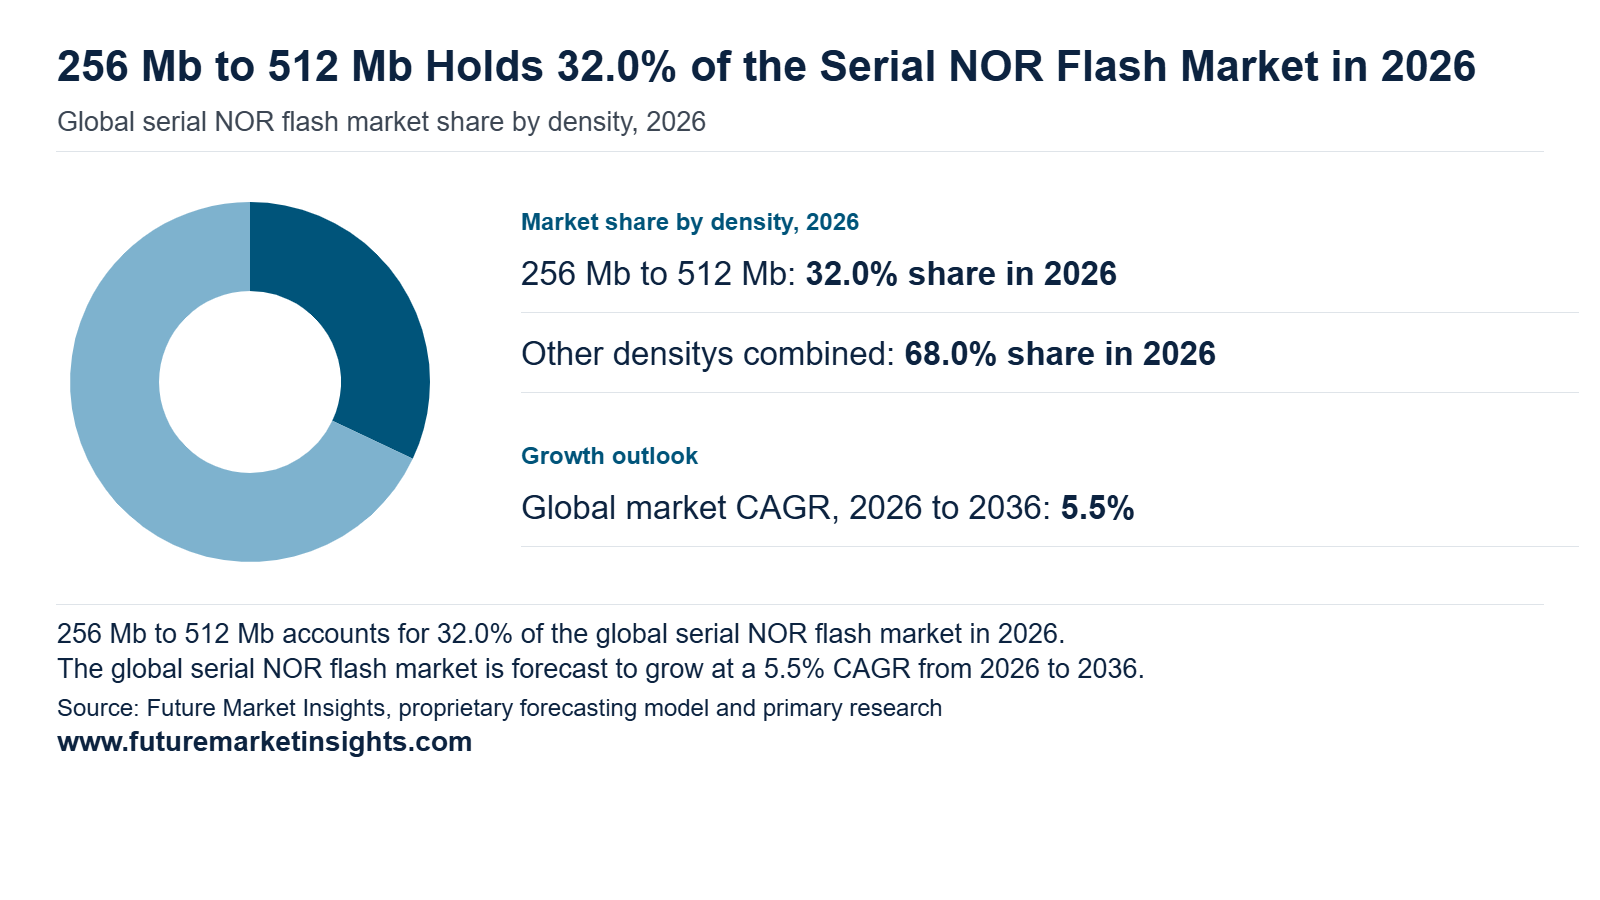
The 256 Mb to 512 Mb band leads by density with a 32.0% share in 2026 and is projected to reach 33.1% by 2036 at a 6.0% CAGR. Firmware images for smartphones and set-top boxes and automotive cockpits have outgrown 128 Mb parts while staying economical against larger arrays. Winbond and Macronix and GigaDevice price this band competitively for design wins at module makers in Shenzhen and Taiwan. Rising code size from over-the-air update partitions and secure boot images sustains upgrades across the wider semiconductor memory landscape. Larger and smaller density tiers serve data-heavy and cost-driven designs.
Why Does Dual and Quad SPI Lead by Interface?
Dual and quad SPI leads by interface with a 50.0% share in 2026 and is projected to move to 50.5% by 2036 at a 5.6% CAGR. Controller designers favor it since it multiplies read bandwidth over the same pin count and supports execute-in-place boot from the microcontrollers and system-on-chip devices in routers and smart meters. Industrial gateways and sensors feeding industrial IoT deployments rely on this interface for fast wake-up and firmware updates. Mature software drivers across Linux and real-time operating systems shorten qualification for engineering teams. Standard SPI serves cost-driven designs while Octal and XSPI targets high-throughput automotive and computing boards under the JEDEC xSPI specification.
Why Does the 2.7 V to 3.6 V Range Lead by Voltage?
The 2.7 V to 3.6 V range leads by voltage with a 58.0% share in 2026 and is projected to account for 56.4% by 2036 at a 5.2% CAGR. This range matches the 3.3 V rails found in most consumer and industrial boards so engineers can place a flash device directly on existing rails. Long product lifecycles in factory controllers and network equipment keep reordering steady. Suppliers such as Infineon and Micron stock broad catalogs in this range with extended temperature grades for industrial customers. The 1.8 V and 1.2 V and 2.5 V options serve wearables and compact modules on lean power budgets.
Why Does Consumer Electronics Lead by Application?
Consumer electronics leads by application with a 27.3% share in 2026 and is projected to reach 27.6% by 2036 at a 5.6% CAGR. Smartphone and television and wearable brands in China and South Korea and Japan store boot code and display firmware in serial NOR since it delivers instant start and dependable reads. Product refresh cycles across the broader consumer electronics landscape keep unit volumes high for Winbond and Puya Semiconductor. Automotive follows as the fastest-growing application as cockpit and ADAS modules built on automotive semiconductor platforms require qualified parts under AEC-Q100 and ISO 26262. Industrial and computing and storage and communications and networking designs add steady volumes.
Serial NOR Flash Market by Region and Country (2026 to 2036)
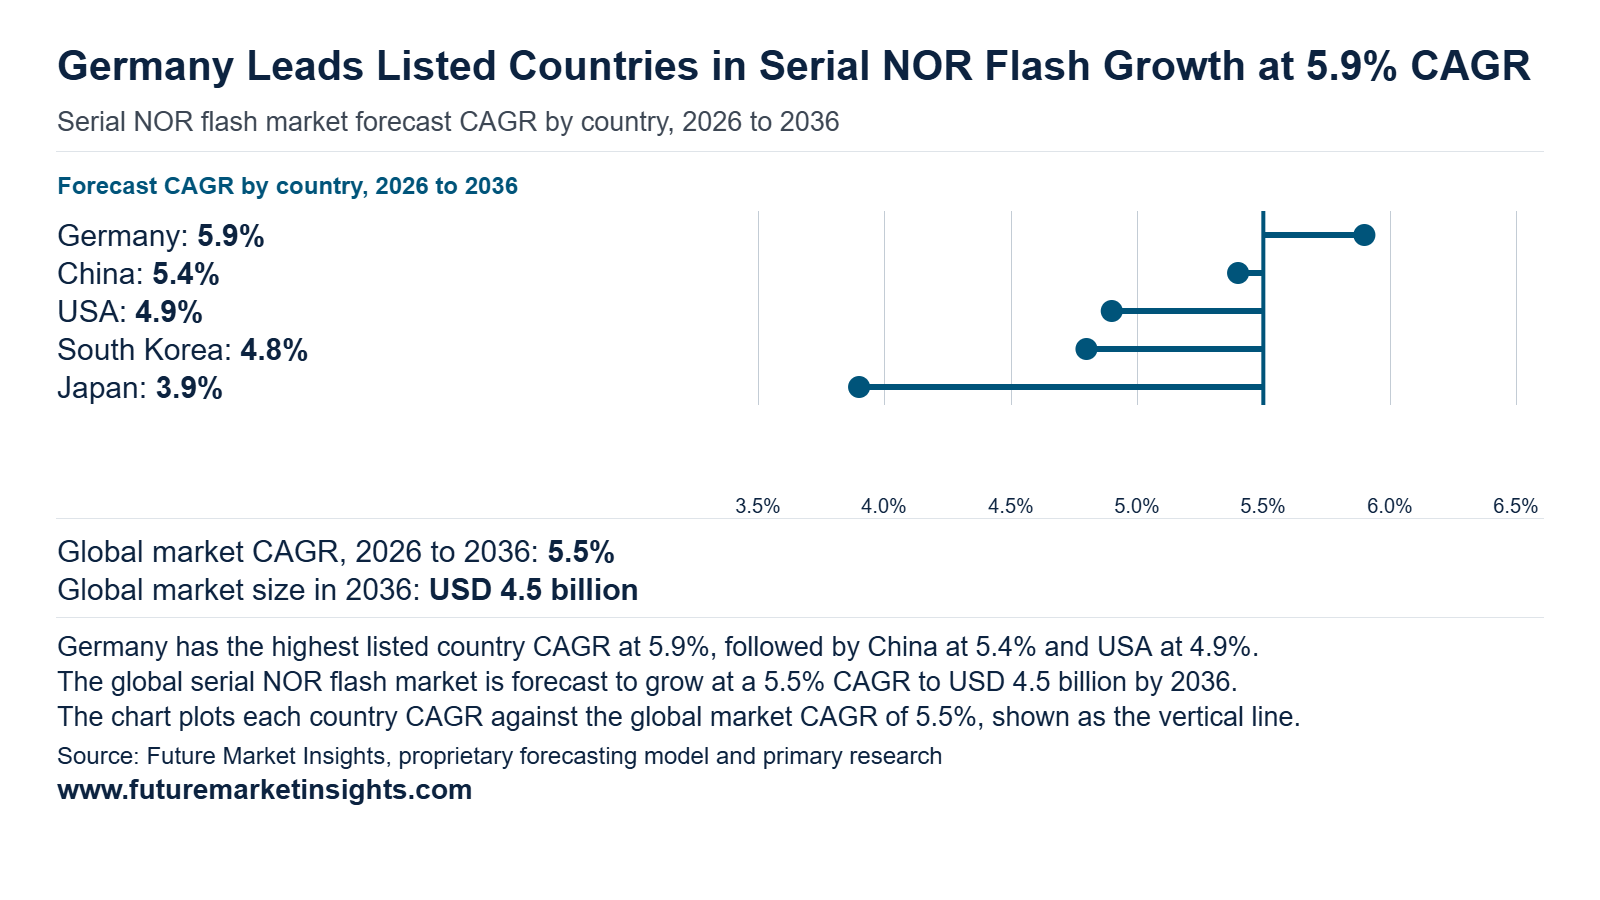
Demand for serial NOR flash is spread across four regions. East Asia holds the largest base through China and Japan and Taiwan and South Korea. North America adds scale through the USA. Western Europe gains pace through Germany. Buyers in these countries use NOR flash to store boot code and firmware in vehicles and servers and consumer devices and industrial equipment. Germany leads on growth, followed by China and Taiwan.
| Country | 2026 Revenue (USD million) | 2036 Revenue (USD million) | 10-Year Addition (USD million) | 2026 to 2036 CAGR | Global Share (2026 → 2036) |
|---|---|---|---|---|---|
| Germany | 160 | 284 | 124 | 5.9% | 5.0% → 5.4% |
| China | 1056 | 1787 | 731 | 5.4% | 33.0% → 34.3% |
| Taiwan | 288 | 469 | 181 | 5.0% | 9.0% → 9.0% |
| USA | 448 | 723 | 275 | 4.9% | 14.0% → 13.9% |
| South Korea | 240 | 384 | 144 | 4.8% | 7.5% → 7.4% |
| Japan | 352 | 516 | 164 | 3.9% | 11.0% → 9.9% |
| Rest of World | 656 | 1050 | 394 | 4.8% | 20.5% → 20.1% |
Source: Future Market Insights analysis of the serial NOR flash market, 2026.
Germany
Germany is the fastest-growing country in the serial NOR flash market at a 5.9% CAGR and lifts its global share from 5.0% in 2026 to 5.4% by 2036. The European Commission lists ESMC in Dresden as a joint venture of TSMC with Bosch and Infineon and NXP with over €10 billion of public and private investment. Infineon adds a Dresden facility backed by €3.54 billion for analog and mixed-signal chips. The Commission proposed Chips Act 2.0 in June 2026. Automotive electronics suppliers and industrial automation makers around these fabs hold boot code in NOR flash on every controller. Closer local sourcing of chips should lift design wins for NOR memory in German vehicle platforms through 2036.
China
China remains the largest country market with a 33.0% global share in 2026 and a 5.4% CAGR that ranks second. The National Bureau of Statistics (October 2026) reports integrated circuit output of 442.8 billion pieces for January to September 2026 which is up 23.3% year on year. High-technology manufacturing grew 14.3% over the same period. Smartphone and wearable and smart home makers in Shenzhen and the Yangtze River Delta pair each device with a NOR flash for firmware. Electric vehicle makers add further demand through cockpit and driver assistance modules. Rising domestic output should keep China near 34.3% of global revenue by 2036.
Taiwan
Taiwan ranks third at a 5.0% CAGR and holds a steady 9.0% share across the forecast period. The Directorate General of Budget and Accounting and Statistics (May 2026) reports that manufacturing grew 26.18% in the first quarter of 2026. Output expansion in semiconductors and computers and electronics and optical products led the gain. Real exports rose 35.76% on AI-related external demand. Server and networking board makers in Taiwan place NOR flash on each board for firmware and boot functions. Expanding capacity at local manufacturers should keep these programs growing through 2036 and anchor Taiwan as a dependable demand center in East Asia.
USA
The USA holds the second largest share at 14.0% in 2026 and records a 4.9% CAGR that ranks fourth. The Department of Commerce signed a Direct Funding Agreement worth $225 million with Robert Bosch Semiconductor on July 13 2026. The award converts the Roseville California plant into a silicon carbide semiconductor facility. Domestic investment in vehicle power electronics raises steadily the number of electronic control units built in the country. Data center server builders and industrial equipment makers add recurring orders for code storage memory. Automotive and cloud buyers should keep US volumes rising through 2036 while the share holds near 13.9%.
South Korea
South Korea records a 4.8% CAGR with its global share easing from 7.5% in 2026 to 7.4% by 2036. The Ministry of Trade Industry and Resources reported semiconductor exports of USD 60.3 billion for September 2026 which is up 262.8% year on year on memory chip demand. This export boom keeps the national electronics supply chain busy. Makers of smartphones and displays and home appliances buy NOR flash for camera modules and display drivers and embedded controllers. Automotive suppliers add further orders for infotainment and sensor units. Steady production across these buyers should support gradual volume gains in South Korea through 2036.
Japan
Japan holds the third largest share at 11.0% in 2026 and posts the lowest CAGR among the profiled countries at 3.9%. Taiwan authorities approved TSMC’s upgraded plan for a second Kumamoto plant on March 31 2026 which enables 3-nanometer production in Japan. The METI minister called this very meaningful for the country’s economic security. Japan has a mature base of automotive and factory automation and camera module buyers that already specify NOR flash in most designs. Demand therefore follows model replacement cycles across these programs. New fab capacity should add local supply options and keep Japan near 9.9% of global revenue by 2036.
Competitive Environment and Notable Companies
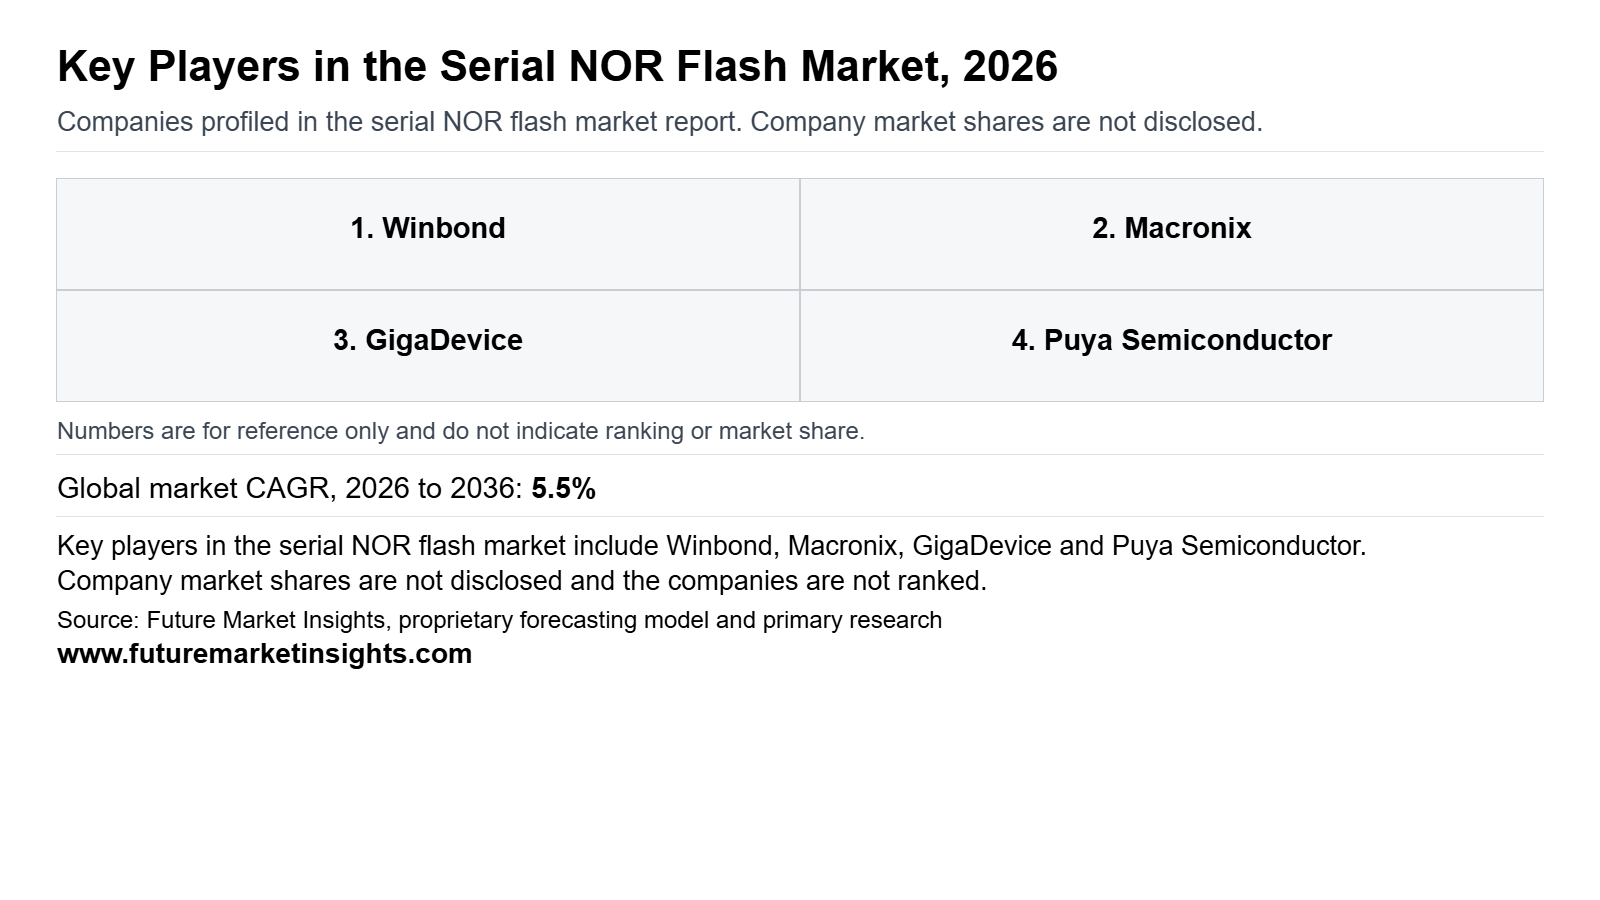
Notable companies operating in the global serial NOR flash market include Winbond, Macronix, GigaDevice, Puya Semiconductor, ISSI, Microchip Technology, Renesas, Fudan Microelectronics, Zbit Semiconductor, and BoyaMicro. Competition forms at two structural levels. Integrated memory makers such as Winbond and Macronix run broad flash lines across automotive and industrial and infrastructure programs. Fabless specialists such as GigaDevice and Puya and Fudan compete through density coverage and low-voltage designs while Microchip and Renesas place serial NOR inside wider microcontroller and analog offers. Scale and product depth keep Winbond as the leading company. Acquisitions and distribution agreements beyond the East Asian base show the clearest partnership scope.
How Are Companies Positioned in the Serial NOR Flash Market?
Positioning is shifting toward scale at the top and specialization below it. Winbond agreed on 16 September 2026 to acquire the NOR Flash and F-RAM business of Infineon for a base price of USD 1.12 billion with closing expected in the second half of 2027 and the unit to operate as Spansion (Winbond, September 2026). Winbond expects wider R&D resources and stronger supply services for customers worldwide. Meanwhile Fudan reported non-volatile memory revenue of RMB 621 million in the first half of 2026 against RMB 440 million a year earlier (Shanghai Fudan, August 2026).
What Matters When a Buyer Selects a Serial NOR Flash Supplier?
Buyers weigh functional safety credentials and power efficiency and density coverage before price. Automotive programs value certified error protection because boot code supports driver assistance functions. Macronix reported that its OctaFlash and QSPI families under the MXSMIO line became compliant with ISO 26262 ASIL D with ECC and bus CRC protection (Macronix, January 2026). Battery-powered designs favor low-voltage parts. GigaDevice reports that GD25UF devices cut power use by 50% to 70% against 1.8 V flash (GigaDevice, March 2026). Fudan notes rising volumes and prices for 64M and above densities (Shanghai Fudan, August 2026).
Which Capabilities Distinguish Product Offers?
Offers separate on interface speed and operating voltage and reliability ratings. GigaDevice lists its GD25UF series at 8 Mb to 256 Mb with read speeds of up to 120 MHz in single transfer mode and 100000 program and erase cycles and 20 years of data retention (GigaDevice, March 2026). Macronix extends the family with x8 interface OctaFlash parts for bandwidth-hungry systems (Macronix, January 2026). Fudan moved its ETOX 5xnm NOR series into mass production and started work on 1.2 V ultra-low-voltage products (Shanghai Fudan, August 2026). Each step widens the range of sockets a supplier can serve.
How Does Geographic Reach Affect Competition?
Reach now depends on channel partners and acquired footprints as much as on fabs. The Infineon business will keep a standalone headquarters in the United States and Winbond expects to add talent from more than 10 countries (Winbond, September 2026). Memphis Electronic signed a distribution agreement with Puya Semiconductor that brings Puya NOR flash and EEPROM lines to its worldwide customers (Memphis Electronic, October 2026). Chinese suppliers therefore gain European design-in access while Taiwanese leaders deepen North American presence.
| Verified Company Evidence (2026) | Commercial Effect | Buyer Action |
|---|---|---|
| 16 September 2026 Winbond agreed to acquire 100% of the Infineon NOR Flash and F-RAM business for a base price of USD 1.12 billion with the unit to be named Spansion at closing [Winbond (September 2026)]. | Combines two NOR Flash portfolios under one owner and adds a US-headquartered standalone unit. | Confirm part number continuity and supply terms for Infineon-branded devices through the closing period. |
| 5 January 2026 Macronix reported that its MXSMIO OctaFlash and QSPI families are compliant with ISO 26262 ASIL D [Macronix (January 2026)]. | Gives automotive programs a certified serial NOR option for driver assistance and autonomous driving functions. | Match the safety documentation to the integrity level of each program. |
| 10 March 2026 GigaDevice expanded its GD25UF 1.2 V SPI NOR series to cover 8 Mb to 256 Mb [GigaDevice (March 2026)]. | Extends low-voltage serial NOR into higher densities for AI computing and compact IoT designs. | Qualify the 1.2 V parts early where SoC supply rails allow. |
Source: Verified corporate disclosures and Future Market Insights analysis, 2026.
| Company | Core Positioning | Verified Activity & Source Attribution |
|---|---|---|
| Winbond | Memory maker with serial NOR as a core line and the leading company | Agreed on 16 September 2026 to acquire the Infineon NOR Flash and F-RAM business (Winbond, September 2026). |
| Macronix | Non-volatile memory maker with the MXSMIO and OctaFlash serial NOR families | Reported ISO 26262 ASIL D compliance for MXSMIO devices on 5 January 2026 (Macronix, January 2026). |
| GigaDevice | Flash and microcontroller specialist with the GD25 SPI NOR range | Expanded the GD25UF series to 256 Mb on 10 March 2026 (GigaDevice, March 2026). |
| Puya Semiconductor | Shanghai-based NOR flash and EEPROM supplier | Added Memphis Electronic as a worldwide distributor in October 2026 (Memphis Electronic, October 2026). |
| ISSI | Memory supplier with the IS25 serial NOR family | Positioning only. Recent activity sits outside the source list. |
| Microchip Technology | Embedded control group with SST serial flash | Positioning only. Recent activity sits outside the source list. |
| Renesas | Semiconductor group with the AT25 SPI NOR family | Positioning only. Recent activity sits outside the source list. |
| Fudan Microelectronics | Integrated circuit designer with NOR Flash and EEPROM and SLC NAND lines | Reported non-volatile memory revenue of RMB 621 million for the first half of 2026 and mass production of its ETOX 5xnm NOR series (Shanghai Fudan, August 2026). |
| Zbit Semiconductor | Serial NOR flash supplier | Positioning only. Recent activity sits outside the source list. |
| BoyaMicro | Serial NOR flash supplier | Positioning only. Recent activity sits outside the source list. |
Source: Verified corporate disclosures and Future Market Insights analysis, 2026.
Serial NOR Flash Market Report Scope and Research Methodology
FMI sizes the serial NOR flash market from the number of devices shipped into each country multiplied by the average selling price per device at each density. National semiconductor trade and electronics production totals provide the cross-check. The 256 Mb to 512 Mb density band anchors the model because it leads every other band on revenue. Shipments across densities and interfaces and voltages convert to unit counts so every device shares one volume basis. Revenue is counted in the country where the device is delivered for end-product assembly. Density and application and country figures sum to the global total in every year. Company disclosures verify product positioning and capacity plans rather than estimate proprietary company revenue.
| Coverage Field | Report Scope |
|---|---|
| Market definition | Revenue from serial interface NOR flash memory devices sold for code storage and boot and execute-in-place use across consumer and automotive and industrial and computing and communications products. |
| Product types | Up to 32 Mb / 64 Mb to 128 Mb / 256 Mb to 512 Mb / 1 Gb and above |
| Variants | Standard SPI / dual and quad SPI / octal and XSPI interfaces / 1.2 V and 1.8 V and 2.5 V and 2.7 V to 3.6 V voltage classes |
| Ingredients or materials included | Silicon NOR flash memory dies and controller logic and package substrates |
| Packaging formats | SOIC and WSON and BGA and wafer-level packages / bare die / tape and reel |
| Distribution channels | Direct sales to OEMs and ODMs / authorized distributors / design houses and module makers |
| End users | Consumer electronics / automotive / industrial / computing and storage / communications and networking makers |
| Exclusions | Parallel NOR flash / NAND flash / embedded flash inside microcontrollers / memory modules and cards |
| Quantitative units | USD billion for value and million units for volume |
| Volume basis | Million devices shipped with all densities and interfaces and voltages counted as single units |
| Value basis | Revenue from device sales in each country counted where the device is delivered for end-product assembly |
| Regions covered | North America / Latin America / Western Europe / Eastern Europe / East Asia / South Asia and Pacific / Middle East and Africa |
| National coverage | United States / China / Japan / Taiwan / South Korea / Germany |
| Companies covered | Winbond / Macronix / GigaDevice / Puya Semiconductor / ISSI / Microchip Technology / Renesas / Fudan Microelectronics / Zbit Semiconductor / BoyaMicro |
Source: Future Market Insights analysis of the serial NOR flash market, 2026.
Research Sources and Bibliography
- Directorate General of Budget, Accounting and Statistics, Taiwan (May 2026). GDP: Preliminary Estimate for 2026Q1, and Outlook for 2026 [press release, 29 May 2026]. https://eng.dgbas.gov.tw/News_Content.aspx?n=4438&s=236299
- European Commission (2026). Cyber Resilience Act. https://digital-strategy.ec.europa.eu/en/policies/cyber-resilience-act
- European Commission (November 2026). European Chips Act [policy page, accessed 17 November 2026]. https://digital-strategy.ec.europa.eu/en/policies/european-chips-act
- GigaDevice (March 2026). Embedded World 2026 exhibition page [event page, March 10-12, 2026]. https://www.gigadevice.com/about/news-and-event/event/embedded-world-2026
- Infineon (September 2026). Infineon enters into agreement to sell NOR Flash and F-RAM business to Winbond and sharpens focus on core growth areas [press release, September 16, 2026]. https://www.infineon.com/press-release/2026/infpr202609-140
- Infineon Technologies (September 2026). Infineon to sell NOR Flash and F-RAM business to Winbond [16 September 2026]. https://evertiq.com/design/2026-09-17-infineon-to-sell-nor-flash-and-f-ram-business-to-winbond
- Korea.net, Ministry of Trade, Industry and Resources data (October 2026). September exports shatter all-time monthly record with USD 121B [news release, 1 October 2026]. https://www.korea.net/NewsFocus/Business/view?articleId=300437
- Macronix International (November 2026). Interview on AI and memory architecture. https://www.eetasia.com/?p=77596
- Macronix (January 2026). Macronix Flash Memory Family Includes Highest Level of Automotive Safety [press release, January 6, 2026]. https://www.macronix.com/en-us/about/news/Pages/ASILD2025.aspx
- Macronix International (October 2026). Third quarter 2026 investor briefing [27 October 2026]. https://finance.technews.tw/2026/10/27/macronixs-third-quarter-financial-report-hit-a-record-high/
- Ministry of Economy, Trade and Industry, Japan (April 2026). Press Conference by Minister Akazawa (Excerpt) [press conference, 3 April 2026]. https://www.meti.go.jp/english/speeches/press_conferences/2026/0403001.html
- National Bureau of Statistics of China (October 2026). Industrial Production Operation in September 2026 [statistical release, 20 October 2026]. https://www.stats.gov.cn/english/PressRelease/202610/t20261020_1965665.html
- U.S. Department of Commerce, CHIPS for America (July 2026). CHIPS Program Office Awards, Robert Bosch Semiconductor LLC [award announcement, 13 July 2026]. https://www.nist.gov/chips/chips-program-office-awards
- Winbond (May 2026). 1Q26 Investor Conference [investor presentation, May 5, 2026]. https://winbond.com/export/sites/winbond/about-winbond/investor/investor-conference/1Q26-investor-conference_EN_Final.pdf
- Winbond (November 2026). 3Q26 Investor Conference [investor presentation, November 3, 2026]. https://winbond.com/export/sites/winbond/about-winbond/investor/investor-conference/3Q26-investor-conference_EN_Final.pdf
- Winbond Electronics (September 2026). Winbond to acquire 100% equity interest in Infineon’s NOR Flash and F-RAM business [29 September 2026]. https://www.storagenewsletter.com/2026/09/29/winbond-to-acquire-100-equity-interest-in-infineons-nor-flash-and-f-ram-business/
- World Semiconductor Trade Statistics (August 2026). Global Semiconductor Market Records Exceptional Growth in Q2 2026 [press release, August 6, 2026]. https://www.wsts.org/esraCMS/extension/media/f/WST/7745/WSTS-Q2-Release-2026-08-06.pdf
- World Semiconductor Trade Statistics (June 2026). Global Semiconductor Market Surges Beyond USD 1.5 Trillion in 2026 Driven by Extraordinary Memory Expansion [press release, June 2, 2026]. https://www.wsts.org/esraCMS/extension/media/f/WST/7618/WSTS_FC-Release-2026-May.pdf
Table of Content
- Key Takeaways
- Market Size and CAGR
- Top Growth Driver
- Fastest Growing Segment
- Leading Region
- Key Companies
- Emerging Opportunities
- Executive Summary
- Global Market Outlook
- Demand-side Trends
- Supply-side Trends
- Technology Roadmap Analysis
- Analysis and Recommendations
- Analyst Perspective (What is happening? Why now? What should investors know?)
- Key Questions Answered
- How large is the market?
- What is the CAGR?
- What are key trends?
- Which region dominates?
- Who are the leaders?
Read More...
- Market Overview
- Market Coverage / Taxonomy
- Market Definition / Scope / Limitations
- Research Methodology
- Chapter Orientation
- Analytical Lens and Working Hypotheses
- Market Structure, Signals, and Trend Drivers
- Benchmarking and Cross-market Comparability
- Market Sizing, Forecasting, and Opportunity Mapping
- Research Design and Evidence Framework
- Desk Research Programme (Secondary Evidence)
- Expert Input and Fieldwork (Primary Evidence)
- Tooling, Models, and Reference Databases
- Data Engineering and Model Build
- Quality Assurance and Audit Trail
- Market Background
- Market Dynamics (Drivers, Restraints, Opportunity, Trends)
- Scenario Forecast (Optimistic, Likely, Conservative)
- Impact Analysis
- AI Impact
- Sustainability Impact
- Regulatory Impact
- Technology Impact
- Consumer / Buyer Analysis
- Purchase Drivers
- Adoption Barriers
- Buyer Journey
- Opportunity Map Analysis
- Product Life Cycle Analysis
- Supply Chain Analysis
- Investment Feasibility Matrix
- Value Chain Analysis
- PESTLE and Porter's Analysis
- Regulatory Landscape
- Regional Parent Market Outlook
- Production and Consumption Statistics
- Import and Export Statistics
- Global Market Analysis and Forecast, 2021 to 2036
- Historical Market Size Value (USD Billion) Analysis, 2021 to 2025
- Current and Future Market Size Value (USD Billion) Projections, 2026 to 2036
- Y-o-Y Growth Trend Analysis
- Absolute $ Opportunity Analysis
- Global Market Pricing Analysis, 2021 to 2036
- Global Market Analysis and Forecast, By Density, 2021 to 2036
- Introduction / Key Findings
- Historical Market Size Value (USD Billion) Analysis By Density, 2021 to 2025
- Current and Future Market Size Value (USD Billion) Analysis and Forecast By Density, 2026 to 2036
- 256 Mb to 512 Mb
- 64 Mb to 128 Mb
- 1 Gb and Above
- Up to 32 Mb
- Y-o-Y Growth Trend Analysis By Density, 2021 to 2025
- Absolute $ Opportunity Analysis By Density, 2026 to 2036
- Global Market Analysis and Forecast, By Interface, 2021 to 2036
- Introduction / Key Findings
- Historical Market Size Value (USD Billion) Analysis By Interface, 2021 to 2025
- Current and Future Market Size Value (USD Billion) Analysis and Forecast By Interface, 2026 to 2036
- Dual and Quad SPI
- Standard SPI
- Octal and XSPI
- Y-o-Y Growth Trend Analysis By Interface, 2021 to 2025
- Absolute $ Opportunity Analysis By Interface, 2026 to 2036
- Global Market Analysis and Forecast, By Voltage, 2021 to 2036
- Introduction / Key Findings
- Historical Market Size Value (USD Billion) Analysis By Voltage, 2021 to 2025
- Current and Future Market Size Value (USD Billion) Analysis and Forecast By Voltage, 2026 to 2036
- 2.7 V to 3.6 V
- 1.8 V
- 1.2 V
- 2.5 V
- Y-o-Y Growth Trend Analysis By Voltage, 2021 to 2025
- Absolute $ Opportunity Analysis By Voltage, 2026 to 2036
- Global Market Analysis and Forecast, By Application, 2021 to 2036
- Introduction / Key Findings
- Historical Market Size Value (USD Billion) Analysis By Application, 2021 to 2025
- Current and Future Market Size Value (USD Billion) Analysis and Forecast By Application, 2026 to 2036
- Consumer Electronics
- Automotive
- Industrial
- Computing and Storage
- Communications and Networking
- Y-o-Y Growth Trend Analysis By Application, 2021 to 2025
- Absolute $ Opportunity Analysis By Application, 2026 to 2036
- Global Market Analysis and Forecast, By Region, 2021 to 2036
- Introduction
- Historical Market Size Value (USD Billion) Analysis By Region, 2021 to 2025
- Current Market Size Value (USD Billion) Analysis and Forecast By Region, 2026 to 2036
- North America
- Latin America
- Western Europe
- Eastern Europe
- East Asia
- South Asia and Pacific
- Middle East and Africa
- Market Attractiveness Analysis By Region
- North America Market Analysis and Forecast, By Country, 2021 to 2036
- Historical Market Size Value (USD Billion) Trend Analysis By Market Taxonomy, 2021 to 2025
- Market Size Value (USD Billion) Forecast By Market Taxonomy, 2026 to 2036
- By Country
- United States
- Canada
- By Density
- By Interface
- By Voltage
- By Application
- By Country
- Market Attractiveness Analysis
- By Country
- By Density
- By Interface
- By Voltage
- By Application
- Key Takeaways
- Latin America Market Analysis and Forecast, By Country, 2021 to 2036
- Historical Market Size Value (USD Billion) Trend Analysis By Market Taxonomy, 2021 to 2025
- Market Size Value (USD Billion) Forecast By Market Taxonomy, 2026 to 2036
- By Country
- Brazil
- Mexico
- Argentina
- Chile
- By Density
- By Interface
- By Voltage
- By Application
- By Country
- Market Attractiveness Analysis
- By Country
- By Density
- By Interface
- By Voltage
- By Application
- Key Takeaways
- Western Europe Market Analysis and Forecast, By Country, 2021 to 2036
- Historical Market Size Value (USD Billion) Trend Analysis By Market Taxonomy, 2021 to 2025
- Market Size Value (USD Billion) Forecast By Market Taxonomy, 2026 to 2036
- By Country
- Germany
- France
- United Kingdom
- Italy
- Spain
- Benelux
- Nordics
- By Density
- By Interface
- By Voltage
- By Application
- By Country
- Market Attractiveness Analysis
- By Country
- By Density
- By Interface
- By Voltage
- By Application
- Key Takeaways
- Eastern Europe Market Analysis and Forecast, By Country, 2021 to 2036
- Historical Market Size Value (USD Billion) Trend Analysis By Market Taxonomy, 2021 to 2025
- Market Size Value (USD Billion) Forecast By Market Taxonomy, 2026 to 2036
- By Country
- Poland
- Czech Republic
- Romania
- Hungary
- By Density
- By Interface
- By Voltage
- By Application
- By Country
- Market Attractiveness Analysis
- By Country
- By Density
- By Interface
- By Voltage
- By Application
- Key Takeaways
- East Asia Market Analysis and Forecast, By Country, 2021 to 2036
- Historical Market Size Value (USD Billion) Trend Analysis By Market Taxonomy, 2021 to 2025
- Market Size Value (USD Billion) Forecast By Market Taxonomy, 2026 to 2036
- By Country
- China
- Japan
- South Korea
- By Density
- By Interface
- By Voltage
- By Application
- By Country
- Market Attractiveness Analysis
- By Country
- By Density
- By Interface
- By Voltage
- By Application
- Key Takeaways
- South Asia and Pacific Market Analysis and Forecast, By Country, 2021 to 2036
- Historical Market Size Value (USD Billion) Trend Analysis By Market Taxonomy, 2021 to 2025
- Market Size Value (USD Billion) Forecast By Market Taxonomy, 2026 to 2036
- By Country
- India
- ASEAN
- Australia and New Zealand
- By Density
- By Interface
- By Voltage
- By Application
- By Country
- Market Attractiveness Analysis
- By Country
- By Density
- By Interface
- By Voltage
- By Application
- Key Takeaways
- Middle East and Africa Market Analysis and Forecast, By Country, 2021 to 2036
- Historical Market Size Value (USD Billion) Trend Analysis By Market Taxonomy, 2021 to 2025
- Market Size Value (USD Billion) Forecast By Market Taxonomy, 2026 to 2036
- By Country
- GCC Countries
- South Africa
- Türkiye
- Israel
- By Density
- By Interface
- By Voltage
- By Application
- By Country
- Market Attractiveness Analysis
- By Country
- By Density
- By Interface
- By Voltage
- By Application
- Key Takeaways
- Key Countries Market Analysis
- United States
- Pricing Analysis
- Market Share Analysis, 2025
- By Density
- By Interface
- By Voltage
- By Application
- Canada
- Pricing Analysis
- Market Share Analysis, 2025
- By Density
- By Interface
- By Voltage
- By Application
- Brazil
- Pricing Analysis
- Market Share Analysis, 2025
- By Density
- By Interface
- By Voltage
- By Application
- Mexico
- Pricing Analysis
- Market Share Analysis, 2025
- By Density
- By Interface
- By Voltage
- By Application
- Argentina
- Pricing Analysis
- Market Share Analysis, 2025
- By Density
- By Interface
- By Voltage
- By Application
- Chile
- Pricing Analysis
- Market Share Analysis, 2025
- By Density
- By Interface
- By Voltage
- By Application
- Germany
- Pricing Analysis
- Market Share Analysis, 2025
- By Density
- By Interface
- By Voltage
- By Application
- France
- Pricing Analysis
- Market Share Analysis, 2025
- By Density
- By Interface
- By Voltage
- By Application
- United Kingdom
- Pricing Analysis
- Market Share Analysis, 2025
- By Density
- By Interface
- By Voltage
- By Application
- Italy
- Pricing Analysis
- Market Share Analysis, 2025
- By Density
- By Interface
- By Voltage
- By Application
- Spain
- Pricing Analysis
- Market Share Analysis, 2025
- By Density
- By Interface
- By Voltage
- By Application
- Benelux
- Pricing Analysis
- Market Share Analysis, 2025
- By Density
- By Interface
- By Voltage
- By Application
- Nordics
- Pricing Analysis
- Market Share Analysis, 2025
- By Density
- By Interface
- By Voltage
- By Application
- Poland
- Pricing Analysis
- Market Share Analysis, 2025
- By Density
- By Interface
- By Voltage
- By Application
- Czech Republic
- Pricing Analysis
- Market Share Analysis, 2025
- By Density
- By Interface
- By Voltage
- By Application
- Romania
- Pricing Analysis
- Market Share Analysis, 2025
- By Density
- By Interface
- By Voltage
- By Application
- Hungary
- Pricing Analysis
- Market Share Analysis, 2025
- By Density
- By Interface
- By Voltage
- By Application
- China
- Pricing Analysis
- Market Share Analysis, 2025
- By Density
- By Interface
- By Voltage
- By Application
- Japan
- Pricing Analysis
- Market Share Analysis, 2025
- By Density
- By Interface
- By Voltage
- By Application
- South Korea
- Pricing Analysis
- Market Share Analysis, 2025
- By Density
- By Interface
- By Voltage
- By Application
- India
- Pricing Analysis
- Market Share Analysis, 2025
- By Density
- By Interface
- By Voltage
- By Application
- ASEAN
- Pricing Analysis
- Market Share Analysis, 2025
- By Density
- By Interface
- By Voltage
- By Application
- Australia and New Zealand
- Pricing Analysis
- Market Share Analysis, 2025
- By Density
- By Interface
- By Voltage
- By Application
- GCC Countries
- Pricing Analysis
- Market Share Analysis, 2025
- By Density
- By Interface
- By Voltage
- By Application
- South Africa
- Pricing Analysis
- Market Share Analysis, 2025
- By Density
- By Interface
- By Voltage
- By Application
- Türkiye
- Pricing Analysis
- Market Share Analysis, 2025
- By Density
- By Interface
- By Voltage
- By Application
- Israel
- Pricing Analysis
- Market Share Analysis, 2025
- By Density
- By Interface
- By Voltage
- By Application
- United States
- Market Structure Analysis
- Competition Dashboard
- Competition Benchmarking
- Market Share Analysis of Top Players
- By Region
- By Density
- By Interface
- By Voltage
- By Application
- Emerging Startups
- Innovation Benchmarking
- Competition Analysis
- Competition Deep Dive
- Winbond
- Overview
- Product Portfolio
- Profitability by Market Segments
- Sales Footprint
- Strategy Overview
- Marketing Strategy
- Product Strategy
- Channel Strategy
- Macronix
- GigaDevice
- Puya Semiconductor
- ISSI
- Microchip Technology
- Renesas
- Fudan Microelectronics
- Zbit Semiconductor
- BoyaMicro
- Winbond
- Case Studies
- Success Stories
- Recent Developments
- Competition Deep Dive
- Assumptions & Acronyms Used
List of Tables
- Table 1: Global Market Value (USD Billion) Forecast by Region, 2021 to 2036
- Table 2: Global Market Value (USD Billion) Forecast by Density, 2021 to 2036
- Table 3: Global Market Value (USD Billion) Forecast by Interface, 2021 to 2036
- Table 4: Global Market Value (USD Billion) Forecast by Voltage, 2021 to 2036
- Table 5: Global Market Value (USD Billion) Forecast by Application, 2021 to 2036
- Table 6: North America Market Value (USD Billion) Forecast by Country, 2021 to 2036
- Table 7: North America Market Value (USD Billion) Forecast by Density, 2021 to 2036
- Table 8: North America Market Value (USD Billion) Forecast by Interface, 2021 to 2036
- Table 9: North America Market Value (USD Billion) Forecast by Voltage, 2021 to 2036
- Table 10: North America Market Value (USD Billion) Forecast by Application, 2021 to 2036
- Table 11: Latin America Market Value (USD Billion) Forecast by Country, 2021 to 2036
- Table 12: Latin America Market Value (USD Billion) Forecast by Density, 2021 to 2036
- Table 13: Latin America Market Value (USD Billion) Forecast by Interface, 2021 to 2036
- Table 14: Latin America Market Value (USD Billion) Forecast by Voltage, 2021 to 2036
- Table 15: Latin America Market Value (USD Billion) Forecast by Application, 2021 to 2036
- Table 16: Western Europe Market Value (USD Billion) Forecast by Country, 2021 to 2036
- Table 17: Western Europe Market Value (USD Billion) Forecast by Density, 2021 to 2036
- Table 18: Western Europe Market Value (USD Billion) Forecast by Interface, 2021 to 2036
- Table 19: Western Europe Market Value (USD Billion) Forecast by Voltage, 2021 to 2036
- Table 20: Western Europe Market Value (USD Billion) Forecast by Application, 2021 to 2036
- Table 21: Eastern Europe Market Value (USD Billion) Forecast by Country, 2021 to 2036
- Table 22: Eastern Europe Market Value (USD Billion) Forecast by Density, 2021 to 2036
- Table 23: Eastern Europe Market Value (USD Billion) Forecast by Interface, 2021 to 2036
- Table 24: Eastern Europe Market Value (USD Billion) Forecast by Voltage, 2021 to 2036
- Table 25: Eastern Europe Market Value (USD Billion) Forecast by Application, 2021 to 2036
- Table 26: East Asia Market Value (USD Billion) Forecast by Country, 2021 to 2036
- Table 27: East Asia Market Value (USD Billion) Forecast by Density, 2021 to 2036
- Table 28: East Asia Market Value (USD Billion) Forecast by Interface, 2021 to 2036
- Table 29: East Asia Market Value (USD Billion) Forecast by Voltage, 2021 to 2036
- Table 30: East Asia Market Value (USD Billion) Forecast by Application, 2021 to 2036
- Table 31: South Asia and Pacific Market Value (USD Billion) Forecast by Country, 2021 to 2036
- Table 32: South Asia and Pacific Market Value (USD Billion) Forecast by Density, 2021 to 2036
- Table 33: South Asia and Pacific Market Value (USD Billion) Forecast by Interface, 2021 to 2036
- Table 34: South Asia and Pacific Market Value (USD Billion) Forecast by Voltage, 2021 to 2036
- Table 35: South Asia and Pacific Market Value (USD Billion) Forecast by Application, 2021 to 2036
- Table 36: Middle East and Africa Market Value (USD Billion) Forecast by Country, 2021 to 2036
- Table 37: Middle East and Africa Market Value (USD Billion) Forecast by Density, 2021 to 2036
- Table 38: Middle East and Africa Market Value (USD Billion) Forecast by Interface, 2021 to 2036
- Table 39: Middle East and Africa Market Value (USD Billion) Forecast by Voltage, 2021 to 2036
- Table 40: Middle East and Africa Market Value (USD Billion) Forecast by Application, 2021 to 2036
List of Figures
- Figure 1: Global Market Pricing Analysis
- Figure 2: Global Market Value (USD Billion) Forecast 2021-2036
- Figure 3: Global Market Value Share and BPS Analysis by Density, 2026 and 2036
- Figure 4: Global Market Y-o-Y Growth Comparison by Density, 2026-2036
- Figure 5: Global Market Attractiveness Analysis by Density
- Figure 6: Global Market Value Share and BPS Analysis by Interface, 2026 and 2036
- Figure 7: Global Market Y-o-Y Growth Comparison by Interface, 2026-2036
- Figure 8: Global Market Attractiveness Analysis by Interface
- Figure 9: Global Market Value Share and BPS Analysis by Voltage, 2026 and 2036
- Figure 10: Global Market Y-o-Y Growth Comparison by Voltage, 2026-2036
- Figure 11: Global Market Attractiveness Analysis by Voltage
- Figure 12: Global Market Value Share and BPS Analysis by Application, 2026 and 2036
- Figure 13: Global Market Y-o-Y Growth Comparison by Application, 2026-2036
- Figure 14: Global Market Attractiveness Analysis by Application
- Figure 15: Global Market Value (USD Billion) Share and BPS Analysis by Region, 2026 and 2036
- Figure 16: Global Market Y-o-Y Growth Comparison by Region, 2026-2036
- Figure 17: Global Market Attractiveness Analysis by Region
- Figure 18: North America Market Incremental Dollar Opportunity, 2026-2036
- Figure 19: Latin America Market Incremental Dollar Opportunity, 2026-2036
- Figure 20: Western Europe Market Incremental Dollar Opportunity, 2026-2036
- Figure 21: Eastern Europe Market Incremental Dollar Opportunity, 2026-2036
- Figure 22: East Asia Market Incremental Dollar Opportunity, 2026-2036
- Figure 23: South Asia and Pacific Market Incremental Dollar Opportunity, 2026-2036
- Figure 24: Middle East and Africa Market Incremental Dollar Opportunity, 2026-2036
- Figure 25: North America Market Value Share and BPS Analysis by Country, 2026 and 2036
- Figure 26: North America Market Value Share and BPS Analysis by Density, 2026 and 2036
- Figure 27: North America Market Y-o-Y Growth Comparison by Density, 2026-2036
- Figure 28: North America Market Attractiveness Analysis by Density
- Figure 29: North America Market Value Share and BPS Analysis by Interface, 2026 and 2036
- Figure 30: North America Market Y-o-Y Growth Comparison by Interface, 2026-2036
- Figure 31: North America Market Attractiveness Analysis by Interface
- Figure 32: North America Market Value Share and BPS Analysis by Voltage, 2026 and 2036
- Figure 33: North America Market Y-o-Y Growth Comparison by Voltage, 2026-2036
- Figure 34: North America Market Attractiveness Analysis by Voltage
- Figure 35: North America Market Value Share and BPS Analysis by Application, 2026 and 2036
- Figure 36: North America Market Y-o-Y Growth Comparison by Application, 2026-2036
- Figure 37: North America Market Attractiveness Analysis by Application
- Figure 38: Latin America Market Value Share and BPS Analysis by Country, 2026 and 2036
- Figure 39: Latin America Market Value Share and BPS Analysis by Density, 2026 and 2036
- Figure 40: Latin America Market Y-o-Y Growth Comparison by Density, 2026-2036
- Figure 41: Latin America Market Attractiveness Analysis by Density
- Figure 42: Latin America Market Value Share and BPS Analysis by Interface, 2026 and 2036
- Figure 43: Latin America Market Y-o-Y Growth Comparison by Interface, 2026-2036
- Figure 44: Latin America Market Attractiveness Analysis by Interface
- Figure 45: Latin America Market Value Share and BPS Analysis by Voltage, 2026 and 2036
- Figure 46: Latin America Market Y-o-Y Growth Comparison by Voltage, 2026-2036
- Figure 47: Latin America Market Attractiveness Analysis by Voltage
- Figure 48: Latin America Market Value Share and BPS Analysis by Application, 2026 and 2036
- Figure 49: Latin America Market Y-o-Y Growth Comparison by Application, 2026-2036
- Figure 50: Latin America Market Attractiveness Analysis by Application
- Figure 51: Western Europe Market Value Share and BPS Analysis by Country, 2026 and 2036
- Figure 52: Western Europe Market Value Share and BPS Analysis by Density, 2026 and 2036
- Figure 53: Western Europe Market Y-o-Y Growth Comparison by Density, 2026-2036
- Figure 54: Western Europe Market Attractiveness Analysis by Density
- Figure 55: Western Europe Market Value Share and BPS Analysis by Interface, 2026 and 2036
- Figure 56: Western Europe Market Y-o-Y Growth Comparison by Interface, 2026-2036
- Figure 57: Western Europe Market Attractiveness Analysis by Interface
- Figure 58: Western Europe Market Value Share and BPS Analysis by Voltage, 2026 and 2036
- Figure 59: Western Europe Market Y-o-Y Growth Comparison by Voltage, 2026-2036
- Figure 60: Western Europe Market Attractiveness Analysis by Voltage
- Figure 61: Western Europe Market Value Share and BPS Analysis by Application, 2026 and 2036
- Figure 62: Western Europe Market Y-o-Y Growth Comparison by Application, 2026-2036
- Figure 63: Western Europe Market Attractiveness Analysis by Application
- Figure 64: Eastern Europe Market Value Share and BPS Analysis by Country, 2026 and 2036
- Figure 65: Eastern Europe Market Value Share and BPS Analysis by Density, 2026 and 2036
- Figure 66: Eastern Europe Market Y-o-Y Growth Comparison by Density, 2026-2036
- Figure 67: Eastern Europe Market Attractiveness Analysis by Density
- Figure 68: Eastern Europe Market Value Share and BPS Analysis by Interface, 2026 and 2036
- Figure 69: Eastern Europe Market Y-o-Y Growth Comparison by Interface, 2026-2036
- Figure 70: Eastern Europe Market Attractiveness Analysis by Interface
- Figure 71: Eastern Europe Market Value Share and BPS Analysis by Voltage, 2026 and 2036
- Figure 72: Eastern Europe Market Y-o-Y Growth Comparison by Voltage, 2026-2036
- Figure 73: Eastern Europe Market Attractiveness Analysis by Voltage
- Figure 74: Eastern Europe Market Value Share and BPS Analysis by Application, 2026 and 2036
- Figure 75: Eastern Europe Market Y-o-Y Growth Comparison by Application, 2026-2036
- Figure 76: Eastern Europe Market Attractiveness Analysis by Application
- Figure 77: East Asia Market Value Share and BPS Analysis by Country, 2026 and 2036
- Figure 78: East Asia Market Value Share and BPS Analysis by Density, 2026 and 2036
- Figure 79: East Asia Market Y-o-Y Growth Comparison by Density, 2026-2036
- Figure 80: East Asia Market Attractiveness Analysis by Density
- Figure 81: East Asia Market Value Share and BPS Analysis by Interface, 2026 and 2036
- Figure 82: East Asia Market Y-o-Y Growth Comparison by Interface, 2026-2036
- Figure 83: East Asia Market Attractiveness Analysis by Interface
- Figure 84: East Asia Market Value Share and BPS Analysis by Voltage, 2026 and 2036
- Figure 85: East Asia Market Y-o-Y Growth Comparison by Voltage, 2026-2036
- Figure 86: East Asia Market Attractiveness Analysis by Voltage
- Figure 87: East Asia Market Value Share and BPS Analysis by Application, 2026 and 2036
- Figure 88: East Asia Market Y-o-Y Growth Comparison by Application, 2026-2036
- Figure 89: East Asia Market Attractiveness Analysis by Application
- Figure 90: South Asia and Pacific Market Value Share and BPS Analysis by Country, 2026 and 2036
- Figure 91: South Asia and Pacific Market Value Share and BPS Analysis by Density, 2026 and 2036
- Figure 92: South Asia and Pacific Market Y-o-Y Growth Comparison by Density, 2026-2036
- Figure 93: South Asia and Pacific Market Attractiveness Analysis by Density
- Figure 94: South Asia and Pacific Market Value Share and BPS Analysis by Interface, 2026 and 2036
- Figure 95: South Asia and Pacific Market Y-o-Y Growth Comparison by Interface, 2026-2036
- Figure 96: South Asia and Pacific Market Attractiveness Analysis by Interface
- Figure 97: South Asia and Pacific Market Value Share and BPS Analysis by Voltage, 2026 and 2036
- Figure 98: South Asia and Pacific Market Y-o-Y Growth Comparison by Voltage, 2026-2036
- Figure 99: South Asia and Pacific Market Attractiveness Analysis by Voltage
- Figure 100: South Asia and Pacific Market Value Share and BPS Analysis by Application, 2026 and 2036
- Figure 101: South Asia and Pacific Market Y-o-Y Growth Comparison by Application, 2026-2036
- Figure 102: South Asia and Pacific Market Attractiveness Analysis by Application
- Figure 103: Middle East and Africa Market Value Share and BPS Analysis by Country, 2026 and 2036
- Figure 104: Middle East and Africa Market Value Share and BPS Analysis by Density, 2026 and 2036
- Figure 105: Middle East and Africa Market Y-o-Y Growth Comparison by Density, 2026-2036
- Figure 106: Middle East and Africa Market Attractiveness Analysis by Density
- Figure 107: Middle East and Africa Market Value Share and BPS Analysis by Interface, 2026 and 2036
- Figure 108: Middle East and Africa Market Y-o-Y Growth Comparison by Interface, 2026-2036
- Figure 109: Middle East and Africa Market Attractiveness Analysis by Interface
- Figure 110: Middle East and Africa Market Value Share and BPS Analysis by Voltage, 2026 and 2036
- Figure 111: Middle East and Africa Market Y-o-Y Growth Comparison by Voltage, 2026-2036
- Figure 112: Middle East and Africa Market Attractiveness Analysis by Voltage
- Figure 113: Middle East and Africa Market Value Share and BPS Analysis by Application, 2026 and 2036
- Figure 114: Middle East and Africa Market Y-o-Y Growth Comparison by Application, 2026-2036
- Figure 115: Middle East and Africa Market Attractiveness Analysis by Application
- Figure 116: Global Market - Tier Structure Analysis
- Figure 117: Global Market - Company Share Analysis
Frequently Asked Questions
How big is the Serial NOR Flash Market in 2026?
Future Market Insights estimates the global serial NOR flash market at USD 2.6 billion in 2026 and projects it to reach USD 4.5 billion by 2036.
How fast is the Serial NOR Flash Market expected to grow through 2036?
FMI projects the market to expand at a 5.5% CAGR from 2026 to 2036, reflecting continued use of non-volatile memory in consumer electronics, automotive systems, and industrial applications.
Which density segment leads the Serial NOR Flash Market?
The 256 Mb to 512 Mb density segment leads with a 32.0% share, reflecting the need for higher storage capacity in embedded systems and connected devices.
Which interface leads the Serial NOR Flash Market?
Dual and Quad SPI interfaces lead the interface segment with a 50.0% share, supported by their ability to provide faster data transfer than standard SPI interfaces.
Which country is expected to record the fastest growth in the Serial NOR Flash Market?
Germany is projected to record the fastest growth at a 5.9% CAGR from 2026 to 2036, followed by China at 5.4% and Taiwan at 5.0%.
Who are the leading players in the Serial NOR Flash Market?
Key players in the serial NOR flash market include Winbond, Macronix, GigaDevice, Puya Semiconductor, ISSI, Microchip Technology, Renesas, Fudan Microelectronics, Zbit Semiconductor, and BoyaMicro.
Preview the report firsthand - request a free sample
Get SampleGet the brochure for pricing and purchase details.
Get PDF
