

- Market Size (2026)
- USD 920.6 Mn
- Forecast (2036)
- USD 1617.8 Mn
- CAGR (2026 to 2036)
- 5.8%
How big is the Server Console Switch Market in 2026?
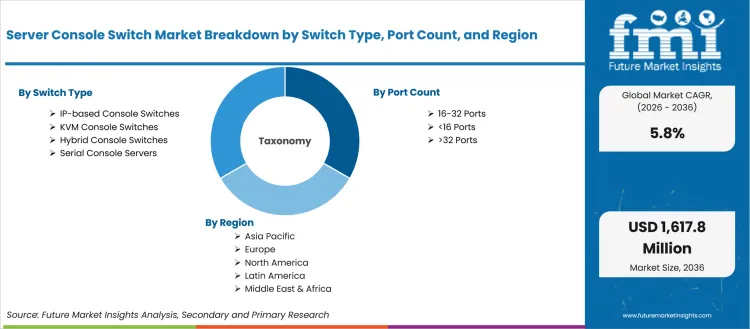
USD 920.6 million in 2026 and USD 1,617.8 million by 2036 at a 5.8% CAGR.
Dense server estates are making recovery access a board-level infrastructure issue for colocation operators and enterprise IT teams. The Server Console Switch Market gains support from the need to reach servers during failed updates and network faults without waiting for physical site access. The International Energy Agency reported in April 2025 that global data center electricity consumption could reach around 945 TWh by 2030. That scale matters for console switch suppliers due to denser facilities needing separate access paths that keep recovery work possible during service interruptions.
Regional adoption differs by facility density and infrastructure buildout. Established markets buy console switches for audit control and lifecycle replacement. High-growth markets buy them during new server room construction and telecom edge expansion. The product becomes more useful once server and switching equipment connects to cabling and power systems. Access policies then become part of the same recovery workflow. That connection helps buyers choose hardware by service risk and operator rights. The strategic issue is not port count alone but whether the access path remains usable during the failure that triggered the service call.
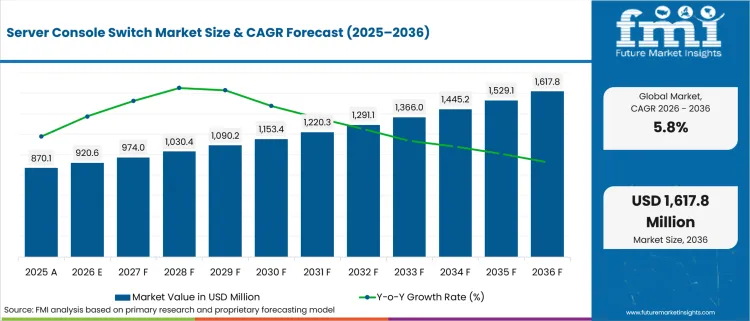
| Metric | Value |
|---|---|
| 2025 Market Size | USD 870.1 million |
| 2026 Market Size | USD 920.6 million |
| 2036 Market Size | USD 1,617.8 million |
| Forecast CAGR (2026-2036) | 5.8% |
| Switch Type Focus | IP-based Console Switches |
| IP-based Console Switches Share (2026) | 42.5% |
| Port Count Focus | 16-32 Ports |
| 16-32 Ports Share (2026) | 47.0% |
| Access Mode Focus | Remote IP Access |
| Remote IP Access Share (2026) | 61.0% |
| Fastest-growing Country | India |
| India CAGR by 2036 | 7.1% |
Summary of the Server Console Switch Market
| Market Signal | Commercial Impact |
|---|---|
| Demand and Growth Drivers | Demand for server console switches is increasing as enterprises strengthen out-of-band management, secure remote access, and infrastructure resilience across modern data center environments.
|
| Product and Segment View | IP-based console switches, 16-32 port configurations, and data center deployments lead their respective market segments as organizations prioritize scalable remote infrastructure management.
|
| Geography and Growth Outlook | Asia continues to expand data center infrastructure while the United States maintains steady replacement demand driven by hyperscale computing and enterprise modernization.
|
| Competitive Landscape | Competition increasingly centers on secure remote access, serial console capabilities, infrastructure integration, and enterprise channel support.
|
| Analyst Perspective | Server console switches are evolving into essential recovery infrastructure that enables secure remote administration and improves operational resilience across modern data centers.
- Sudip saha, Principal Consultant at Future Market Insights |
How is the server console switch market segmented?
The Server Console Switch industry is segmented by switch type, port count, end use, access mode, sales channel, and region.
The server console switch market is segmented by switch type, port count, end use, access mode, sales channel, and region. Switch type covers KVM Console Switches, Serial Console Servers, IP-based Console Switches, and Hybrid Console Switches. Port count includes <16 Ports, 16-32 Ports, and >32 Ports. End use spans Data Centers, Enterprise IT Rooms, Telecom Sites, and Industrial / Edge Sites. Access mode includes Local Console, Remote IP Access, and Cloud-managed Access. Sales channel covers Direct OEM, IT Distributors, and System Integrators. Regional coverage extends across North America, Latin America, Europe, East Asia, South Asia and Pacific, and the Middle East and Africa.
Why do IP-based Console Switches define the switch type category?
Remote operations teams need access that does not depend on the production network. The issue appears during firmware recovery, failed updates and boot-level troubleshooting. IP-based console switches meet that need by providing remote KVM and virtual media access. This explains why buyers compare video quality, authentication and service workflow before port price alone.
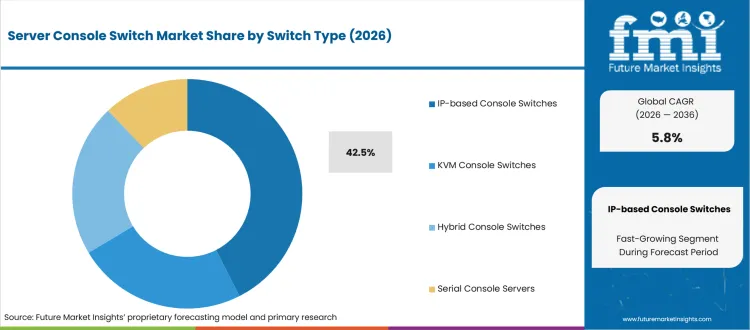
- In 2026, IP-based Console Switches are anticipated to hold 42.5% share driven by recovery needs for remote KVM and virtual media access. Raritan’s KVM-over-IP portfolio shows devices that support multiple port options from 8 to 64 servers and serial devices. This supports mixed rack estates.
- Operations teams using IP-based switching can inspect boot screens and mount recovery media before the operating system is available. This reduces emergency site visits and supports change windows across locked data halls. The buyer value is more visible in dense facilities that also evaluate data center liquid cooling investments.
What explains the 16-32 Ports position within port count?
Port count decisions start with cabinet design and service coverage. Buyers need enough ports to cover active servers and nearby network devices. They also need spare capacity that avoids an immediate second purchase. The 16-32 Ports range fits that middle ground and supports practical replacement planning across enterprise rooms and controlled lab clusters.
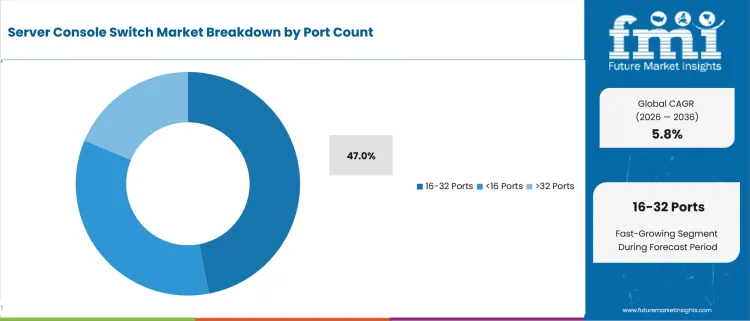
- The 16-32 Ports segment is set to represent 47.0% of port count demand in 2026, supported by cabinet-level server coverage and spare capacity needs. Buyers use this range to manage common rack densities without paying for high-port systems that remain partly unused. This keeps hardware spending aligned with service scope.
- IT teams gain operating value from a port range that matches how racks are accepted and serviced. A 16-32 port unit can cover a rack row or test cluster and keep cabling traceable. This reduces interface sprawl and gives technicians a simpler recovery path during maintenance windows.
Why do Data Centers remain central to end-use demand?
Data center operators treat access hardware inside uptime discipline. Shared facilities need controlled entry to servers and network devices during routine support and outage recovery. Console switches therefore support tenant service levels and internal change control. The end-use logic is clear in sites that combine dense racks and limited physical access.
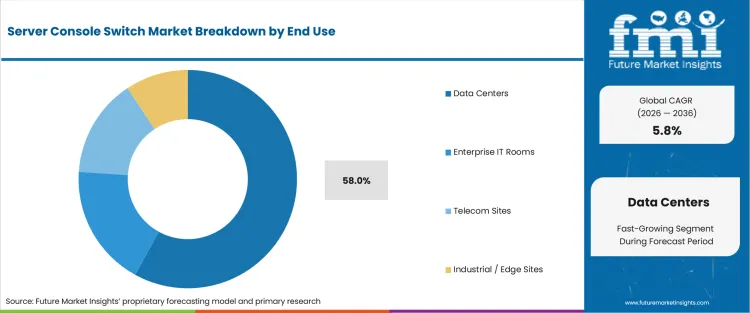
- Data Centers are projected to account for 58.0% in 2026, attributable to strict uptime expectations across colocation and hyperscale estates. IEA’s April 2025 report stated that data centers accounted for around 1.5% of global electricity consumption in 2024. Larger power footprints increase recovery-access discipline.
- Facility owners benefit from console switches that reduce blind troubleshooting during outages and planned maintenance. Operators can limit physical entry and still give authorized teams controlled device access. This matters in shared halls that require tenant separation and service evidence for renewal decisions.
How does Remote IP Access shape access-mode demand?
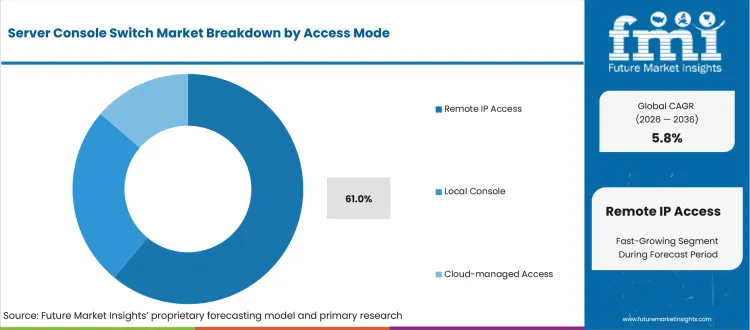
Distributed IT teams need a way to reach devices in locked rooms and distant sites. The access problem is less about keyboard sharing and more about recovery control. Remote IP Access addresses that problem by bringing console paths into network operations centers. Buyers then judge products on access separation, authentication and audit records.
- Remote IP Access is expected to account for 61.0% of access mode demand in 2026, owing to distributed operations teams that manage multiple sites. This mode gains relevance during recovery workflow expansion into branch rooms and telecom nodes. Lantronix LM4 positioning supports this out-of-band access logic.
- Security teams value remote access that is separated from everyday production traffic and documented for review. Administrators can reach locked facilities without dispatching engineers for every restart. This cuts field support effort and gives infrastructure leaders a clearer record of privileged maintenance actions.
How are IT Distributors positioned within the sales channel?
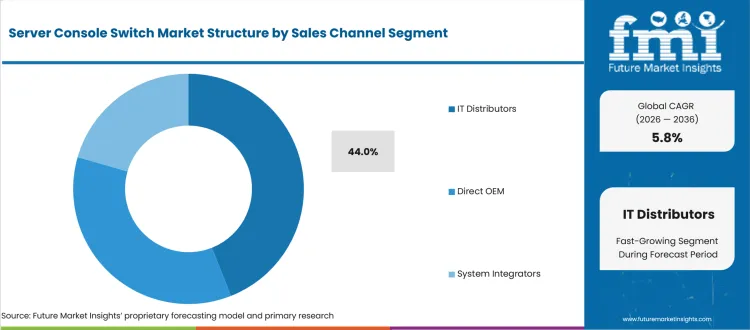
Channel selection is practical in this market due to accessories and service timing. Buyers often need rack drawers and interface modules in the same purchase cycle. Direct OEM access supports complex projects that require configuration oversight. IT distributors remain useful for mid-market buyers that need stocked hardware and fast fulfillment.
- IT Distributors are estimated to hold around 44.0% share in 2026, reinforced by buyer preference for stocked accessories and predictable delivery. Distribution matters due to the risk that missing server interface modules can delay rack acceptance and service team handover. This makes local channel availability a purchase factor.
- Procurement teams benefit from distributors that bundle switch hardware, cables and basic support under one ordering path. Vertiv’s 2025 Avocent AutoView firmware listings show continued maintenance around installed KVM estates. That evidence supports channel demand tied to service continuity and replacement planning.
What are the drivers, restraints, and opportunities in the server console switch market?
Near-term purchases are being shaped by the recovery-access requirement, secure-access constraint, and cloud-managed expansion route outlined below.
- Driver: Out-of-band recovery spending is driven by the need to reach servers during production network faults and firmware failures.
- Restraint: Smaller IT rooms delay refresh projects due to hardware price pressure and uncertainty around secure access separation.
- Opportunity: Cloud-managed access gains traction from distributed sites that need simpler fleet control and fewer emergency visits.
Data center buyers are moving recovery access into larger resilience programs driven by compute rooms that draw more power and carry denser workloads. IEA energy-supply analysis released in 2025 projected electricity generation for data centers to rise from 460 TWh in 2024 to more than 1,000 TWh in 2030. The implication for console switch suppliers is clear. More powered racks and more service-critical equipment raise the value of independent access paths that keep recovery work outside the production network.
Facility expansion can slow access-hardware replacement plans due to buyers waiting for rack layouts and power availability to be finalized. IEA reported in November 2025 that EU grid-connection waits for data centers can range from two to ten years. That delay does not remove console switch need. It pushes buying into phased refreshes and favors suppliers that can support smaller upgrades before full data hall commissioning. For small enterprises, that logic also makes bundled support and clear security documentation more important during procurement.
Distributed infrastructure creates a route for suppliers that can package console access with automation and central policy. Lantronix announced in February 2026 that its Cisco Live demos would cover reduced downtime and faster incident response. The company also highlighted centralized authentication across managed sites. This development matters for smaller sites and branch rooms. It shows how console suppliers can move beyond hardware ports into managed recovery steps that reduce field work and improve renewal opportunities. Startups can compete if they translate remote access into measurable incident handling and not only port density.
Which country CAGRs are profiled in the server console switch market?
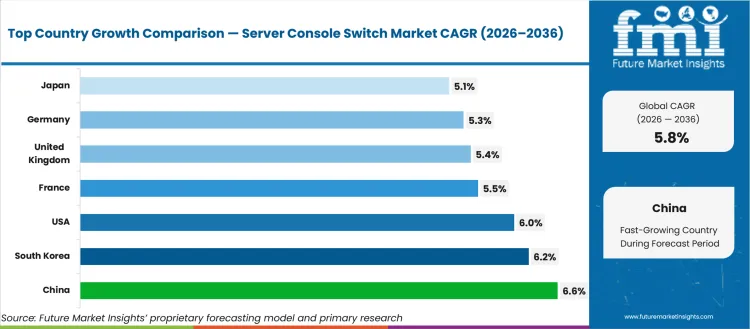
| Country | CAGR |
|---|---|
| United States | 6.0% |
| United Kingdom | 5.4% |
| Germany | 5.3% |
| France | 5.5% |
| Japan | 5.1% |
| China | 6.6% |
| South Korea | 6.2% |
| India | 7.1% |
How do country-level CAGRs compare in the server console switch market?
Country-level growth should be read by the operating role that console switches serve in each market. In established markets, the case is tied to uptime discipline and replacement cycles in enterprise server rooms. In higher-growth markets, the same hardware is closer to new data center capacity and AI compute procurement. This variation matters for purchasing decisions due to different buyer priorities. Some buyers prioritize certified separation and audit control. Others prioritize channel availability and fast rack acceptance during new facility buildout. The comparison therefore helps suppliers decide whether to lead with resilience credentials or distributor readiness.
- By 2036, the United States is projected to record 6.0% CAGR supported by hyperscale density and enterprise refresh cycles. IEA data showed that the United States accounted for about 45% of global data center electricity consumption in 2024. That share reflects a large installed base that needs continued console access and recovery tooling.
- The United Kingdom is expected to grow at 5.4% CAGR during the forecast period, reinforced by reliance on outsourced and shared digital infrastructure. The UK government reported in March 2026 that 28% of UK businesses rely on data center services. This reliance supports console switch demand tied to service continuity and supplier accountability.
- Over the assessment period, Germany is forecast to advance at 5.3% CAGR shaped by planned data center capacity and industrial edge needs. The German federal ministry reported in 2024 that data center capacity reached 2,730 MW. This creates steady rack access demand but keeps growth more measured than new-build markets.
- France is likely to expand at 5.5% CAGR by 2036, due to cloud budgets and sovereign infrastructure priorities. The USA International Trade Administration reported in September 2024 that 51% of French companies increased IT budgets in 2023. That budget environment supports console purchases tied to controlled access and service resilience.
- The server console switch sector in Japan is estimated to rise at 5.1% CAGR between 2026 and 2036, attributable to cautious cloud capacity support and reliability-focused procurement. METI approved subsidies of up to JPY 72.5 billion in April 2024 for projects improving AI computational resources. This supports rack access demand at controlled deployment pace.
- Demand outlook in China points to 6.6% CAGR by 2036, propelled by national computing hubs and domestic sourcing discipline. The State Council reported in August 2024 that data center racks in the project exceeded 1.95 million. That rack scale makes console access more relevant in national compute infrastructure and data center substation planning.
- South Korea is anticipated to post 6.2% CAGR over the assessment period, influenced by AI compute and semiconductor-linked infrastructure. MSIT stated in July 2025 that its GPU procurement project would secure 13,000 GPUs with partner companies. This supports server-room access planning for dense AI server chassis and test environments.
- India is expected to grow at 7.1% CAGR during the forecast period, led by colocation expansion and distributor-led purchasing. Press Information Bureau reported in March 2026 that 38,231 GPUs had been onboarded under the AI compute capacity framework. This supports console access demand across new halls and micro mobile data center projects.
Who are the notable companies in the server console switch market?
Vertiv, ATEN International, Legrand Raritan, Eaton Tripp Lite, Adder Technology, Lantronix, Black Box, Belkin, Schneider Electric, Dell Technologies, and ZPE Systems are the notable companies shaping this market.
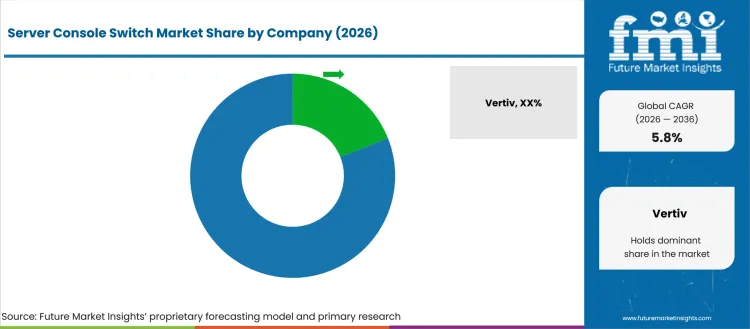
Supplier selection in server console switching is structured by the layer of the operating environment that buyers want to control. Vertiv, Legrand Raritan and Eaton Tripp Lite are suited to rack infrastructure and data center access projects. ATEN International, Adder Technology, Black Box and Belkin gain relevance in secure KVM and control-room workflows. Lantronix and ZPE Systems are more relevant for out-of-band serial access. Schneider Electric and Dell Technologies support buyers that want channel reach and broader infrastructure purchasing alignment.
- Rack infrastructure suppliers matter to buyers that need console switching to fit broader data center purchasing programs. Vertiv and Eaton Tripp Lite connect KVM switch, power and rack accessory decisions. This reduces supplier handoffs and gives server-room teams a clearer support route.
- ATEN International and Adder Technology focus on KVM-over-IP and control-room use cases. Operators choose these suppliers for multiview access and reliable switching during live monitoring. Product depth in video and user access supports service-sensitive environments that cannot rely on simple keyboard sharing.
- Out-of-band management buyers often compare Lantronix and ZPE Systems for serial console access and automated recovery. Their portfolios matter in distributed sites that need command-line reach during disruption. These accounts often prioritize resilience planning over simple hardware switching.
- Secure workstation and infrastructure-channel needs keep Belkin and Black Box visible. Schneider Electric and Dell Technologies add procurement support for broader data center accounts. This group serves buyers that combine access hardware, security review and broader data center service relationships.
Competitive Benchmarking: Server Console Switch Market
| Company | Remote Access Portfolio | Serial Console Depth | Secure KVM Fit | Channel / Service Reach |
|---|---|---|---|---|
| ATEN International | High | Medium | Strong | Global |
| Legrand Raritan | High | Strong | Medium | Global |
| Vertiv | High | Medium | Medium | Global |
| Eaton Tripp Lite | Medium | Medium | Medium | Global |
| Lantronix | Strong | High | Medium | Global |
| Adder Technology | High | Medium | Strong | Global |
| Black Box | Medium | Medium | Strong | Global |
| Belkin | Medium | Low | Strong | Global |
| Schneider Electric | Medium | Medium | Medium | Global |
| Dell Technologies | Medium | Medium | Medium | Global |
Source: Future Market Insights competitive analysis, 2026. Ratings reflect relative portfolio relevance, workflow or project fit, service capability, and geographic reach.
Key Developments in the Server Console Switch Market
- In February 2025, Lantronix debuted the LM4 out-of-band management platform at Cisco Live for distributed infrastructure teams. The product provides access and monitoring for network devices during outages. It supports market demand for smaller site recovery and gives buyers another path beyond large data center console projects.
- In August 2025, ATEN International launched the KE8980MR 4K Quad-Display KVM over IP Multi-View Receiver. The launch matters due to control-room demand for clearer multi-system viewing during live monitoring. It points to a shift toward richer operator workstations inside remote console workflows.
- In June 2025, Raritan announced the end-of-life path for Dominion SX II and directed buyers toward ZPE Systems Nodegrid Serial Consoles. This matters due to serial console buyer need for a verified migration route. It shows how supplier portfolio changes can influence replacement timing and account retention.
- In July 2025, Vertiv listed updated Avocent AutoView KVM firmware for the 2108 and 2216 switch line. This matters to installed-base buyers that need maintained access devices during longer infrastructure cycles. It supports refresh planning for server rooms that keep analog KVM estates in operation.
Key Players in the Server Console Switch Market
Rack and Data Center Access Suppliers
- Vertiv
- Legrand Raritan
- Eaton Tripp Lite
- Schneider Electric
- Dell Technologies
KVM and Control Room Specialists
- ATEN International
- Adder Technology
- Black Box
- Belkin
Out-of-Band and Serial Console Specialists
- Lantronix
- ZPE Systems
Server Console Switch Market - Report Scope
| Coverage field | Report scope |
|---|---|
| Market breakdown | Server Console Switch Market Breakdown By Switch Type, Port Count, End Use, Access Mode, Sales Channel, and Region |
| Market Definition | Hardware that enables local or remote console access to multiple servers and network devices from one controlled interface |
| Regions Covered | North America, Latin America, Europe, East Asia, South Asia and Pacific, Middle East and Africa |
| Countries Covered | United States, United Kingdom, Germany, France, Japan, China, South Korea, India and 30+ countries |
| Key Companies Profiled | Vertiv, ATEN International, Legrand Raritan, Eaton Tripp Lite, Adder Technology, Lantronix, Black Box, Belkin, Schneider Electric, Dell Technologies, ZPE Systems |
| Forecast Period | 2026 to 2036 |
| Approach | Hybrid bottom-up and top-down methodology using product portfolios, channel checks, rack density, access mode demand and country-level data center signals |
Server Console Switch Market - Research Methodology
| Method | Approach |
|---|---|
| Primary Research | FMI analysts reviewed inputs from data center operators, enterprise IT managers, telecom teams, systems integrators and rack hardware distributors. Interviews focused on recovery workflows, remote access control, interface module buying and replacement cycles across server rooms. |
| Desk Research | Desk research covered government data center policy sources, outage reports, supplier product documentation, standards guidance and official company updates. Product relevance was checked against KVM, serial console, remote access and out-of-band management use cases. |
| Market Sizing and Forecasting | The model combined shipment value, average selling price, port density, replacement cycles, channel margin and country-level data center activity. Forecast assumptions were adjusted for AI rack density, remote operations, uptime planning and secure access requirements. |
| Data Validation | Forecasts were checked against supplier portfolios, public infrastructure data, channel availability and country cloud capacity signals. Duplicate statistics were removed by assigning each public evidence point to one section before final wording. |
Server Console Switch Market by Segments
Server Console Switch Market segmented by Switch Type:
- KVM Console Switches
- Serial Console Servers
- IP-based Console Switches
- Hybrid Console Switches
Server Console Switch Market segmented by Port Count:
- <16 Ports
- 16-32 Ports
- >32 Ports
Server Console Switch Market segmented by End Use:
- Data Centers
- Enterprise IT Rooms
- Telecom Sites
- Industrial / Edge Sites
Server Console Switch Market segmented by Access Mode:
- Local Console
- Remote IP Access
- Cloud-managed Access
Server Console Switch Market segmented by Sales Channel:
- Direct OEM
- IT Distributors
- System Integrators
Server Console Switch Market by Region:
- North America
- United States
- Canada
- Mexico
- Latin America
- Brazil
- Chile
- Rest of Latin America
- Western Europe
- Germany
- United Kingdom
- Italy
- Spain
- France
- Nordics
- BENELUX
- Rest of Western Europe
- Eastern Europe
- Russia
- Poland
- Hungary
- Balkan and Baltic countries
- Rest of Eastern Europe
- East Asia
- China
- Japan
- South Korea
- South Asia and Pacific
- India
- ASEAN
- Australia and New Zealand
- Rest of South Asia and Pacific
- Middle East and Africa
- Kingdom of Saudi Arabia
- Other GCC Countries
- Turkiye
- South Africa
- Other African Union
- Rest of Middle East and Africa
Research Sources and Bibliography
- International Energy Agency. (2025, April). Energy demand from AI. International Energy Agency.
- Uptime Institute. (2025, May 6). Uptime announces annual outage analysis report 2025. Uptime Institute.
- Government of the United Kingdom. (2026, March 6). Data centres. GOV.UK.
- German Federal Ministry for Economic Affairs and Climate Action. (2024). Status and development of the German data centre landscape: Executive summary.
- USA International Trade Administration. (2024, September 20). France - Digital economy. USA Department of Commerce.
- Ministry of Economy, Trade and Industry. (2024, April 19). Approval of plans for ensuring a stable supply of cloud programs under the Economic Security Promotion Act.
- Ministry of Science and ICT. (2025, July). GPU Procurement Project selects participants.
- Press Information Bureau. (2026, March 13). Data centre capacity in the country has increased from about 375 MW in 2020 to around 1500 MW by 2025. Government of India.
- State Council of the People’s Republic of China. (2024, August 29). China invests over 6.1 billion USD in major computing hubs: official.
- Lantronix. (2025, February 4). Lantronix to debut new LM4 AI-Powered Out-of-Band Management platform at Cisco Live.
- ATEN International. (2025, August 7). ATEN debuts Quad-Display KVM over IP Multi-View Receiver.
- Belkin. (2025, March 27). Belkin NIAP PP4.0 Secure KVM and KM Administrator Guides.
- Vertiv. (2025, July). Avocent AutoView 2108/2216 Analog KVM Switches software downloads. Vertiv.
- International Energy Agency. (2025, April). Energy supply for AI. International Energy Agency.
- International Energy Agency. (2025, November 16). Overcoming energy constraints is key to delivering on Europe’s data centre goals. International Energy Agency.
- Lantronix. (2026, February 9). Lantronix tackles network downtime with automated out-of-band innovations at Cisco Live 2026 Amsterdam. Lantronix.
This bibliography is provided for reader reference and uses primary government, standards-body, official trade body, and company sources.
This Report Answers
- What is the expected global value of the Server Console Switch Market in 2026 and by 2036?
- What CAGR is forecast for the Server Console Switch Market during 2026 to 2036?
- Which switch type category is used to assess IP-based console switch demand in 2026?
- Why do data center operators buy console switches for recovery workflows?
- How does the 16-32 Ports segment support rack-level access planning?
- How do Remote IP Access and Cloud-managed Access change buyer evaluation criteria?
- Which countries are compared in the Server Console Switch Market forecast?
- Which companies compete across rack access, KVM and out-of-band management roles?
- What hardware capabilities are included within the Server Console Switch Market definition?
- How does FMI size and forecast server console switch demand across segments and countries?
Frequently Asked Questions
What is driving growth in the Server Console Switch Market?
Growth is driven by out-of-band recovery needs, denser server estates and secure remote access requirements.
Which companies compete in the Server Console Switch Market?
Vertiv, ATEN International, Legrand Raritan, Eaton Tripp Lite, Adder Technology, Lantronix, Black Box, Belkin, Schneider Electric, Dell Technologies and ZPE Systems compete in this market.
What should buyers evaluate before selecting suppliers?
Buyers should compare secure access design and serial console depth. Port options and interface availability should then be checked against site needs. Channel support and migration paths should also be reviewed before supplier selection.
How does FMI validate the Server Console Switch Market forecast?
FMI validates the forecast using supplier portfolios and channel evidence. Public data center indicators and duplicate-statistic checks help test the article sections.
Preview the report firsthand - request a free sample
Get SampleGet the brochure for pricing and purchase details.
Get PDFTable of Content
- Key Takeaways
- Market Size and CAGR
- Top Growth Driver
- Fastest Growing Segment
- Leading Region
- Key Companies
- Emerging Opportunities
- Executive Summary
- Global Market Outlook
- Demand-side Trends
- Supply-side Trends
- Technology Roadmap Analysis
- Analysis and Recommendations
- Analyst Perspective (What is happening? Why now? What should investors know?)
- Key Questions Answered
- How large is the market?
- What is the CAGR?
- What are key trends?
- Which region dominates?
- Who are the leaders?
- Market Overview
- Market Coverage / Taxonomy
- Market Definition / Scope / Limitations
- Research Methodology
- Chapter Orientation
- Analytical Lens and Working Hypotheses
- Market Structure, Signals, and Trend Drivers
- Benchmarking and Cross-market Comparability
- Market Sizing, Forecasting, and Opportunity Mapping
- Research Design and Evidence Framework
- Desk Research Programme (Secondary Evidence)
- Expert Input and Fieldwork (Primary Evidence)
- Tooling, Models, and Reference Databases
- Data Engineering and Model Build
- Quality Assurance and Audit Trail
- Market Background
- Market Dynamics (Drivers, Restraints, Opportunity, Trends)
- Scenario Forecast (Optimistic, Likely, Conservative)
- Impact Analysis
- AI Impact
- Sustainability Impact
- Regulatory Impact
- Technology Impact
- Consumer / Buyer Analysis
- Purchase Drivers
- Adoption Barriers
- Buyer Journey
- Opportunity Map Analysis
- Product Life Cycle Analysis
- Supply Chain Analysis
- Investment Feasibility Matrix
- Value Chain Analysis
- PESTLE and Porter's Analysis
- Regulatory Landscape
- Regional Parent Market Outlook
- Production and Consumption Statistics
- Import and Export Statistics
- Global Market Analysis and Forecast, 2021 to 2036
- Historical Market Size Value (USD Million) & Volume (Unit) Analysis, 2021 to 2025
- Current and Future Market Size Value (USD Million) & Volume (Unit) Projections, 2026 to 2036
- Y-o-Y Growth Trend Analysis
- Absolute $ Opportunity Analysis
- Global Market Pricing Analysis, 2021 to 2036
- Global Market Analysis and Forecast, By Switch Type, 2021 to 2036
- Introduction / Key Findings
- Historical Market Size Value (USD Million) & Volume (Unit) Analysis By Switch Type, 2021 to 2025
- Current and Future Market Size Value (USD Million) & Volume (Unit) Analysis and Forecast By Switch Type, 2026 to 2036
- IP-based Console Switches
- KVM Console Switches
- Hybrid Console Switches
- Serial Console Servers
- IP-based Console Switches
- Y-o-Y Growth Trend Analysis By Switch Type, 2021 to 2025
- Absolute $ Opportunity Analysis By Switch Type, 2026 to 2036
- Global Market Analysis and Forecast, By Port Count, 2021 to 2036
- Introduction / Key Findings
- Historical Market Size Value (USD Million) & Volume (Unit) Analysis By Port Count, 2021 to 2025
- Current and Future Market Size Value (USD Million) & Volume (Unit) Analysis and Forecast By Port Count, 2026 to 2036
- 16-32 Ports
- <16 Ports
- >32 Ports
- 16-32 Ports
- Y-o-Y Growth Trend Analysis By Port Count, 2021 to 2025
- Absolute $ Opportunity Analysis By Port Count, 2026 to 2036
- Global Market Analysis and Forecast, By End Use, 2021 to 2036
- Introduction / Key Findings
- Historical Market Size Value (USD Million) & Volume (Unit) Analysis By End Use, 2021 to 2025
- Current and Future Market Size Value (USD Million) & Volume (Unit) Analysis and Forecast By End Use, 2026 to 2036
- Data Centers
- Enterprise IT Rooms
- Telecom Sites
- Industrial / Edge Sites
- Data Centers
- Y-o-Y Growth Trend Analysis By End Use, 2021 to 2025
- Absolute $ Opportunity Analysis By End Use, 2026 to 2036
- Global Market Analysis and Forecast, By Access Mode, 2021 to 2036
- Introduction / Key Findings
- Historical Market Size Value (USD Million) & Volume (Unit) Analysis By Access Mode, 2021 to 2025
- Current and Future Market Size Value (USD Million) & Volume (Unit) Analysis and Forecast By Access Mode, 2026 to 2036
- Remote IP Access
- Local Console
- Cloud-managed Access
- Remote IP Access
- Y-o-Y Growth Trend Analysis By Access Mode, 2021 to 2025
- Absolute $ Opportunity Analysis By Access Mode, 2026 to 2036
- Global Market Analysis and Forecast, By Sales Channel, 2021 to 2036
- Introduction / Key Findings
- Historical Market Size Value (USD Million) & Volume (Unit) Analysis By Sales Channel, 2021 to 2025
- Current and Future Market Size Value (USD Million) & Volume (Unit) Analysis and Forecast By Sales Channel, 2026 to 2036
- IT Distributors
- Direct OEM
- System Integrators
- IT Distributors
- Y-o-Y Growth Trend Analysis By Sales Channel, 2021 to 2025
- Absolute $ Opportunity Analysis By Sales Channel, 2026 to 2036
- Global Market Analysis and Forecast, By Region, 2021 to 2036
- Introduction
- Historical Market Size Value (USD Million) & Volume (Unit) Analysis By Region, 2021 to 2025
- Current Market Size Value (USD Million) & Volume (Unit) Analysis and Forecast By Region, 2026 to 2036
- North America
- Latin America
- Western Europe
- Eastern Europe
- East Asia
- South Asia and Pacific
- Middle East & Africa
- Market Attractiveness Analysis By Region
- North America Market Analysis and Forecast, By Country, 2021 to 2036
- Historical Market Size Value (USD Million) & Volume (Unit) Trend Analysis By Market Taxonomy, 2021 to 2025
- Market Size Value (USD Million) & Volume (Unit) Forecast By Market Taxonomy, 2026 to 2036
- By Country
- USA
- Canada
- Mexico
- By Switch Type
- By Port Count
- By End Use
- By Access Mode
- By Sales Channel
- By Country
- Market Attractiveness Analysis
- By Country
- By Switch Type
- By Port Count
- By End Use
- By Access Mode
- By Sales Channel
- Key Takeaways
- Latin America Market Analysis and Forecast, By Country
- Historical Market Size Value (USD Million) & Volume (Unit) Trend Analysis By Market Taxonomy, 2021 to 2025
- Market Size Value (USD Million) & Volume (Unit) Forecast By Market Taxonomy, 2026 to 2036
- By Country
- Brazil
- Chile
- Rest of Latin America
- By Switch Type
- By Port Count
- By End Use
- By Access Mode
- By Sales Channel
- By Country
- Market Attractiveness Analysis
- By Country
- By Switch Type
- By Port Count
- By End Use
- By Access Mode
- By Sales Channel
- Key Takeaways
- Western Europe Market Analysis and Forecast, By Country
- Historical Market Size Value (USD Million) & Volume (Unit) Trend Analysis By Market Taxonomy, 2021 to 2025
- Market Size Value (USD Million) & Volume (Unit) Forecast By Market Taxonomy, 2026 to 2036
- By Country
- Germany
- UK
- Italy
- Spain
- France
- Nordic
- BENELUX
- Rest of Western Europe
- By Switch Type
- By Port Count
- By End Use
- By Access Mode
- By Sales Channel
- By Country
- Market Attractiveness Analysis
- By Country
- By Switch Type
- By Port Count
- By End Use
- By Access Mode
- By Sales Channel
- Key Takeaways
- Eastern Europe Market Analysis and Forecast, By Country
- Historical Market Size Value (USD Million) & Volume (Unit) Trend Analysis By Market Taxonomy, 2021 to 2025
- Market Size Value (USD Million) & Volume (Unit) Forecast By Market Taxonomy, 2026 to 2036
- By Country
- Russia
- Poland
- Hungary
- Balkan & Baltic
- Rest of Eastern Europe
- By Switch Type
- By Port Count
- By End Use
- By Access Mode
- By Sales Channel
- By Country
- Market Attractiveness Analysis
- By Country
- By Switch Type
- By Port Count
- By End Use
- By Access Mode
- By Sales Channel
- Key Takeaways
- East Asia Market Analysis and Forecast, By Country
- Historical Market Size Value (USD Million) & Volume (Unit) Trend Analysis By Market Taxonomy, 2021 to 2025
- Market Size Value (USD Million) & Volume (Unit) Forecast By Market Taxonomy, 2026 to 2036
- By Country
- China
- Japan
- South Korea
- By Switch Type
- By Port Count
- By End Use
- By Access Mode
- By Sales Channel
- By Country
- Market Attractiveness Analysis
- By Country
- By Switch Type
- By Port Count
- By End Use
- By Access Mode
- By Sales Channel
- Key Takeaways
- South Asia and Pacific Market Analysis and Forecast, By Country
- Historical Market Size Value (USD Million) & Volume (Unit) Trend Analysis By Market Taxonomy, 2021 to 2025
- Market Size Value (USD Million) & Volume (Unit) Forecast By Market Taxonomy, 2026 to 2036
- By Country
- India
- ASEAN
- Australia & New Zealand
- Rest of South Asia and Pacific
- By Switch Type
- By Port Count
- By End Use
- By Access Mode
- By Sales Channel
- By Country
- Market Attractiveness Analysis
- By Country
- By Switch Type
- By Port Count
- By End Use
- By Access Mode
- By Sales Channel
- Key Takeaways
- Middle East & Africa Market Analysis and Forecast, By Country
- Historical Market Size Value (USD Million) & Volume (Unit) Trend Analysis By Market Taxonomy, 2021 to 2025
- Market Size Value (USD Million) & Volume (Unit) Forecast By Market Taxonomy, 2026 to 2036
- By Country
- Kingdom of Saudi Arabia
- Other GCC Countries
- Türkiye
- South Africa
- Other African Union
- Rest of Middle East & Africa
- By Switch Type
- By Port Count
- By End Use
- By Access Mode
- By Sales Channel
- By Country
- Market Attractiveness Analysis
- By Country
- By Switch Type
- By Port Count
- By End Use
- By Access Mode
- By Sales Channel
- Key Takeaways
- Key Countries Market Analysis
- USA
- Pricing Analysis
- Market Share Analysis, 2025
- By Switch Type
- By Port Count
- By End Use
- By Access Mode
- By Sales Channel
- Canada
- Pricing Analysis
- Market Share Analysis, 2025
- By Switch Type
- By Port Count
- By End Use
- By Access Mode
- By Sales Channel
- Mexico
- Pricing Analysis
- Market Share Analysis, 2025
- By Switch Type
- By Port Count
- By End Use
- By Access Mode
- By Sales Channel
- Brazil
- Pricing Analysis
- Market Share Analysis, 2025
- By Switch Type
- By Port Count
- By End Use
- By Access Mode
- By Sales Channel
- Chile
- Pricing Analysis
- Market Share Analysis, 2025
- By Switch Type
- By Port Count
- By End Use
- By Access Mode
- By Sales Channel
- Germany
- Pricing Analysis
- Market Share Analysis, 2025
- By Switch Type
- By Port Count
- By End Use
- By Access Mode
- By Sales Channel
- UK
- Pricing Analysis
- Market Share Analysis, 2025
- By Switch Type
- By Port Count
- By End Use
- By Access Mode
- By Sales Channel
- Italy
- Pricing Analysis
- Market Share Analysis, 2025
- By Switch Type
- By Port Count
- By End Use
- By Access Mode
- By Sales Channel
- Spain
- Pricing Analysis
- Market Share Analysis, 2025
- By Switch Type
- By Port Count
- By End Use
- By Access Mode
- By Sales Channel
- France
- Pricing Analysis
- Market Share Analysis, 2025
- By Switch Type
- By Port Count
- By End Use
- By Access Mode
- By Sales Channel
- India
- Pricing Analysis
- Market Share Analysis, 2025
- By Switch Type
- By Port Count
- By End Use
- By Access Mode
- By Sales Channel
- ASEAN
- Pricing Analysis
- Market Share Analysis, 2025
- By Switch Type
- By Port Count
- By End Use
- By Access Mode
- By Sales Channel
- Australia & New Zealand
- Pricing Analysis
- Market Share Analysis, 2025
- By Switch Type
- By Port Count
- By End Use
- By Access Mode
- By Sales Channel
- China
- Pricing Analysis
- Market Share Analysis, 2025
- By Switch Type
- By Port Count
- By End Use
- By Access Mode
- By Sales Channel
- Japan
- Pricing Analysis
- Market Share Analysis, 2025
- By Switch Type
- By Port Count
- By End Use
- By Access Mode
- By Sales Channel
- South Korea
- Pricing Analysis
- Market Share Analysis, 2025
- By Switch Type
- By Port Count
- By End Use
- By Access Mode
- By Sales Channel
- Russia
- Pricing Analysis
- Market Share Analysis, 2025
- By Switch Type
- By Port Count
- By End Use
- By Access Mode
- By Sales Channel
- Poland
- Pricing Analysis
- Market Share Analysis, 2025
- By Switch Type
- By Port Count
- By End Use
- By Access Mode
- By Sales Channel
- Hungary
- Pricing Analysis
- Market Share Analysis, 2025
- By Switch Type
- By Port Count
- By End Use
- By Access Mode
- By Sales Channel
- Kingdom of Saudi Arabia
- Pricing Analysis
- Market Share Analysis, 2025
- By Switch Type
- By Port Count
- By End Use
- By Access Mode
- By Sales Channel
- Türkiye
- Pricing Analysis
- Market Share Analysis, 2025
- By Switch Type
- By Port Count
- By End Use
- By Access Mode
- By Sales Channel
- South Africa
- Pricing Analysis
- Market Share Analysis, 2025
- By Switch Type
- By Port Count
- By End Use
- By Access Mode
- By Sales Channel
- USA
- Market Structure Analysis
- Competition Dashboard
- Competition Benchmarking
- Market Share Analysis of Top Players
- By Regional
- By Switch Type
- By Port Count
- By End Use
- By Access Mode
- By Sales Channel
- Emerging Startups
- Innovation Benchmarking
- Competition Analysis
- Competition Deep Dive
- Vertiv
- Overview
- Product Portfolio
- Profitability by Market Segments (Product/Region/Sales Channel)
- Sales Footprint
- Strategy Overview
- Marketing Strategy
- Product Strategy
- Channel Strategy
- Legrand Raritan
- Eaton Tripp Lite
- Schneider Electric
- Dell Technologies
- ATEN International
- Vertiv
- Case Studies
- Success Stories
- Recent Developments
- Competition Deep Dive
- Assumptions & Acronyms Used


