

- Market Size (2026)
- USD 4.9 Mn
- Forecast (2036)
- USD 14.1 Mn
- CAGR (2026 to 2036)
- 11.2%
How big is the Server Direct Attach Cables Market in 2026?
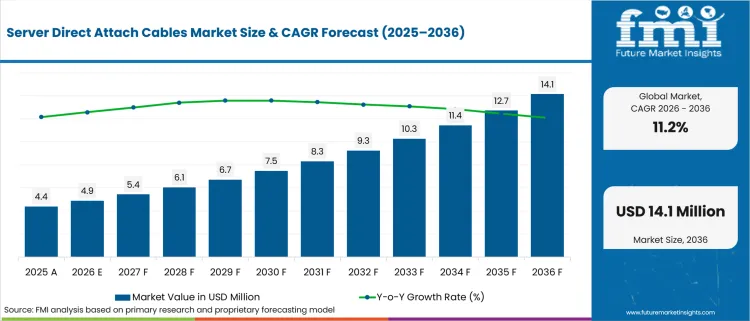
USD 4.9 million in 2026 and USD 14.1 million by 2036 at a 11.2% CAGR.
AI server racks are turning short copper links into a design decision for dense computing sites. Buyers building data center GPU clusters need predictable server-to-switch paths that control latency and heat inside each rack. The pressure is driven by bandwidth, power draw and service access near switch cages. The International Energy Agency reported in April 2025 that data centers used about 415 TWh of electricity in 2024. That scale makes short-reach copper more visible by showing how module power can add heat load in crowded server rows.
Hyperscale cloud operators and enterprise data centers form the main buyer base. Telecom edge builders and HPC teams add demand in sites that need compact links near servers. Adoption is influenced by qualification risk, cable reach and the cost gap between copper assemblies and optical modules. Server DACs create value by reducing powered components near switch cages and simplifying rack service work. Buyers also use validated assemblies to reduce commissioning risk in projects that require exact lengths, connector formats and approved vendor lists.
North American and Western European buyers usually follow strict OEM qualification routes before orders scale. East Asia and South Asia show quicker buildout patterns owing to AI compute clusters, local assembly depth and colocation capacity additions. The market becomes more valuable once it connects high-speed interconnects, switch validation and thermal planning inside one purchasing decision. That creates a strategic buyer point for the rest of the article. DAC approval is no longer a late accessory choice but part of rack reliability planning.
| Metric | Value |
|---|---|
| 2025 Market Size | USD 4.4 million |
| 2026 Market Size | USD 4.9 million |
| 2036 Market Size | USD 14.1 million |
| Forecast CAGR (2026-2036) | 11.2% |
| Cable Type Focus | Passive Copper DAC |
| Passive Copper DAC Share (2026) | 46.0% |
| Speed Focus | 100G |
| 100G Share (2026) | 36.5% |
| End-use Focus | Hyperscale Data Centers |
| Hyperscale Data Centers Share (2026) | 42.5% |
| Fastest-growing Country | United States |
| United States CAGR by 2036 | 12.7% |
Summary of the Server Direct Attach Cables Market
| Market Signal | Commercial Impact |
|---|---|
| Demand and Growth Drivers | Demand for server direct attach cables (DACs) is increasing as hyperscale and enterprise data centers prioritize low-power, high-speed interconnects for AI infrastructure and dense rack deployments.
|
| Product and Segment View | Passive copper DACs, 100G connectivity, and QSFP/QSFP-DD form factors continue to dominate market demand due to their balance of performance, compatibility, and energy efficiency.
|
| Geography and Growth Outlook | North America and Asia continue to drive server DAC adoption as AI infrastructure, hyperscale computing, and colocation investments accelerate worldwide.
|
| Competitive Landscape | Competition increasingly focuses on signal integrity, OEM qualification, connector innovation, and supply-chain responsiveness.
|
| Analyst Perspective | Server DACs are becoming a strategic infrastructure component as AI clusters and enterprise data centers place greater emphasis on reliable, energy-efficient short-reach connectivity.
- Sudip saha, Principal Consultant at Future Market Insights |
How is the server direct attach cables market segmented?
The Server Direct Attach Cables industry is segmented by cable type, speed, end use, connector type, sales channel, and region.
The server direct attach cables market is segmented by cable type, speed, end use, connector type, sales channel, and region. Cable type covers passive copper DAC, active copper DAC, breakout DAC and high-speed twinax assemblies. Speed includes 25G / 40G, 100G, 200G / 400G and 800G and above. End use covers hyperscale data centers, enterprise data centers, telecom / cloud edge and HPC / AI clusters. Connector type includes SFP / SFP+, QSFP / QSFP-DD, OSFP and other interfaces. Sales channel spans direct OEM, distributors and system integrators. Regional coverage extends across North America, Latin America, Europe, East Asia, South Asia and Pacific, and the Middle East and Africa.
Why does Passive Copper DAC matter within the cable type category?
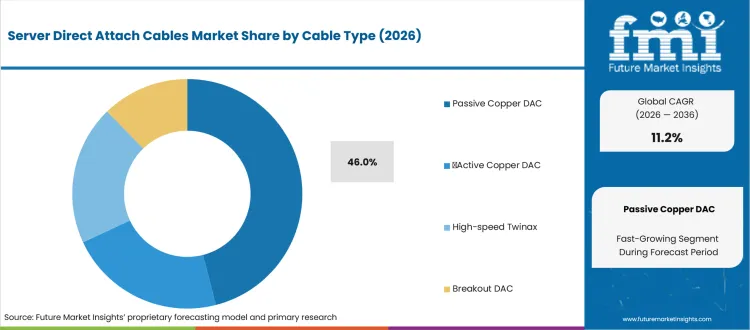
Short rack links are still evaluated first on heat, cost and service simplicity. Passive copper DAC gives rack teams a direct cable path that avoids powered electronics in very short server-to-switch connections. The segment remains relevant for builds that have limited reach, repeatable rack layout and simple field replacement needs during planned maintenance windows.
- In 2026, Passive Copper DAC is anticipated to hold 46.0% of cable type demand, supported by short intra-rack runs that need low module power and simple swap-out. Buyers keep passive copper in the first design review owing to fewer active components inside tight rack spaces.
- The operating value is rack control and not cable price alone. Passive assemblies reduce heat sources near switch cages and keep service work simple for technicians. The active optical cable context remains useful once reach or routing needs move beyond passive copper limits.
What keeps 100G relevant in the speed category?
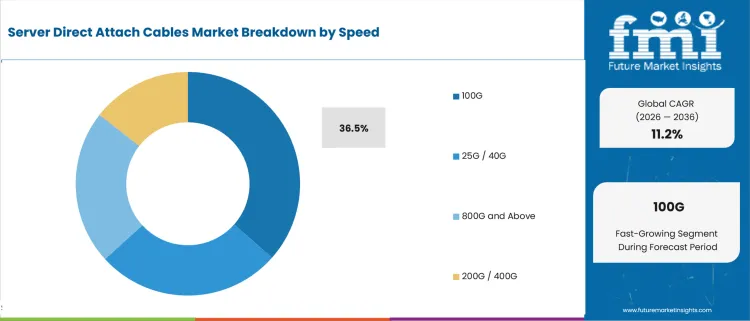
Enterprise refresh cycles rarely shift every rack to the newest speed at once. Many sites replace servers, storage and switches in waves to preserve uptime and keep approved parts manageable. That pattern gives 100G a continuing role during AI fabric movement toward 400G and 800G links in new clusters.
- 100G represents an estimated share of 36.5% in 2026, driven by staged enterprise refreshes that still depend on known switch ports. The share reflects installed-base continuity for buyers that need a lower-risk bridge before broader 400G or 800G fabric migration.
- The operating case for 100G is compatibility across existing racks. Buyers can replace servers and storage links without changing the full switching layer. This keeps demand active beside faster fabrics and lets suppliers serve enterprise refresh cycles alongside AI cluster projects.
How do Hyperscale Data Centers shape end-use demand?
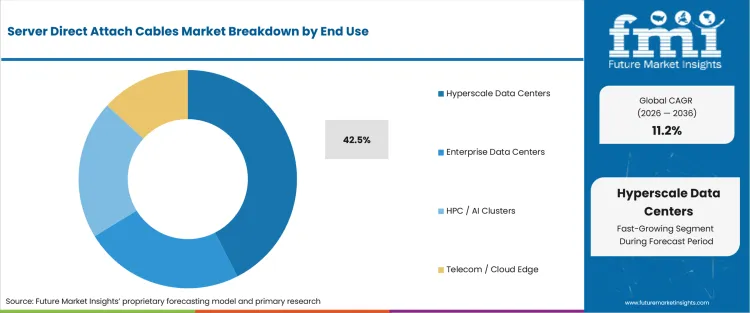
Hyperscale buyers evaluate DACs at rack design level and not as loose accessories. Their projects need exact cable lengths, repeatable link behavior and approved vendor documentation before a fabric build moves to installation. A supplier that passes one platform qualification can gain repeat orders across many rows or sites.
- Hyperscale Data Centers are projected to account for 42.5% share in 2026, owing to AI racks that need repeatable server-to-switch links. The data center accelerator context matters by showing how accelerator nodes multiply short cabling paths inside each rack.
- The strategic value is repeat volume after qualification. Hyperscale teams need exact lengths, stable performance and fast delivery across thousands of links. Suppliers that can support rack drawings and approved vendor documentation reduce installation risk before the data center build moves into operation.
Why is QSFP / QSFP-DD prominent in connector selection?
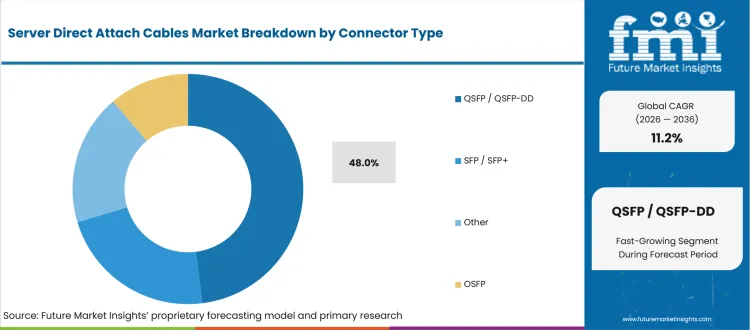
Connector choice affects switch density, airflow and the availability of approved cable options. QSFP and QSFP-DD remain useful by helping buyers bridge existing switch estates and higher-speed designs without fully changing the port family. That gives the connector category a practical role in phased bandwidth migration.
- QSFP / QSFP-DD is expected to hold 48.0% share in 2026, attributable to high-density switch ports and phased compatibility needs. Buyers select this connector family due to familiar upgrade routes and broad cable availability across 100G, 400G and 800G planning cycles.
- Connector value is tied to port planning and approved vendor lists. QSFP-DD helps teams bridge established 100G estates and higher-speed designs. The silicon photonics testing context matters by explaining why validation intensity rises once links move toward faster lanes and tighter signal margins.
How is Direct OEM positioned within the sales channel category?
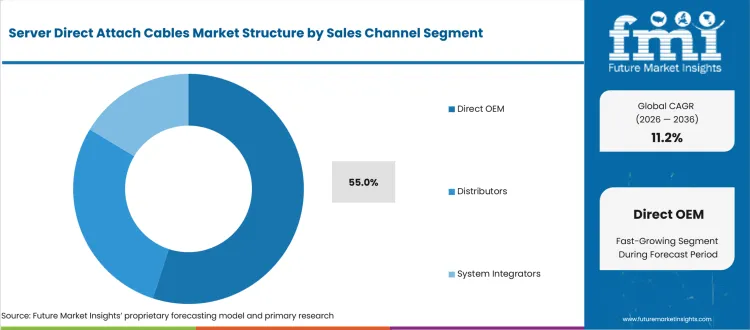
Direct OEM buying is tied to accountability after rack delivery. Server and switch customers need to know who owns cable coding and warranty responsibility. This route is especially relevant in AI builds in builds that can face link instability from unqualified cables.
- Direct OEM is projected to hold around 55.0% share in 2026, reinforced by buyer preference for cables shipped inside validated server and switch bundles. This route matters for customers that need one accountable path for firmware coding, cable qualification and replacement support.
- Channel value is clearer in AI rack projects that cannot tolerate uncertain link behavior after delivery. OEM bundles reduce handoff risk and simplify approved parts lists. This buying pattern also touches high-density data center SSD connectors by showing how dense hardware refreshes often move in coordinated rack programs.
What are the drivers, restraints, and opportunities in the server direct attach cables market?
Near-term purchases are being shaped by AI rack power pressure, routing constraints, and qualification-led channel access outlined below.
- Driver: Short-reach copper adoption is driven by AI rack power pressure and the need to reduce powered components near switch cages.
- Restraint: Dense cable routing is constrained by bend radius, airflow paths and service access around high-port-count switches.
- Opportunity: Qualification-led channel access gains traction from buyers that need approved cable kits before rack-level installation starts.
AI cluster buyers now treat short rack links as part of the power and uptime plan. Cisco announced Nexus HyperFabric in June 2024 using Cisco 6000 series switches for Ethernet fabric performance in AI clusters. That development shows why cabling decisions move earlier in the design cycle. DAC suppliers gain a clearer selling route if they can prove signal integrity, exact length support and connector fit before the rack is ordered. Buyers are approving a fabric component that affects link stability during commissioning.
Routing constraints turn into a supplier test once buyers need reach beyond passive copper limits. TE Connectivity OCP 2025 material showcased a 1.6T Active Copper Cable solution and active copper cables using redriver technology for longer reach. That evidence supports the shift from simple passive links toward engineered copper assemblies in dense AI racks. Suppliers that explain routing, thermal fit and supported form factors can convert a physical constraint into a higher-value qualification discussion. This matters to specialists that compete on cable engineering instead of switch platforms.
Qualification-led buying opens a route for active electrical cable specialists and channel partners. Credo introduced HiWire ZeroFlap active electrical cables in October 2024 and described links up to 7 m for AI backend networks. The figure matters for wider racks that need copper reach beyond passive assemblies before buyers shift to optics. Startups and specialists can use this opening by documenting tested reach, link stability and platform fit. The opportunity is not only a faster cable but a lower-risk path into approved AI rack designs.
Which country CAGRs are profiled in the server direct attach cables market?
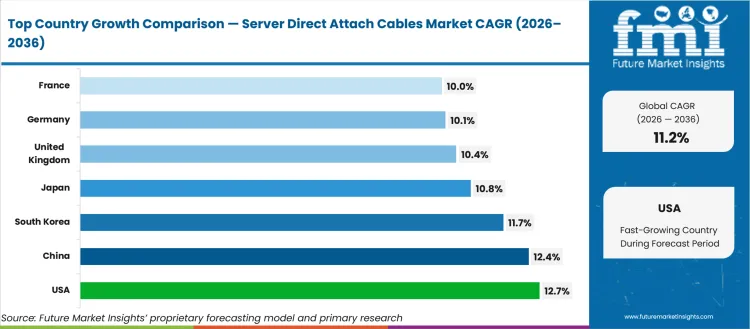
| Country | CAGR |
|---|---|
| United States | 12.7% |
| United Kingdom | 10.4% |
| Germany | 10.1% |
| France | 10.0% |
| Japan | 10.8% |
| China | 12.4% |
| South Korea | 11.7% |
| India | 12.1% |
How do country-level CAGRs compare in the server direct attach cables market?
Country CAGR profiles should be read by rack qualification pressure and the pace of data center buildout. In North America and Western Europe, purchases are tied to power availability, colocation renewal and approved vendor discipline. East Asia shows a different pattern owing to national computing programs and connector manufacturing depth. South Asia adds a capacity-led profile. New colocation sites there need validated short links from the first rack design stage. This variation matters for buyers and suppliers by tying DAC approval to rack density, power cost, platform timing and service access. Country selection should therefore reflect operating risk and sourcing depth.
- By 2036, the United States is projected to record 12.7% CAGR in server DAC demand, driven by hyperscale AI clusters and power-constrained campuses. The USA Department of Energy reported in December 2024 that data centers may consume 6.7% to 12.0% of national electricity by 2028. This makes lower-power short links more relevant than in markets that have smaller AI campus concentration.
- The United Kingdom is expected to grow at 10.4% CAGR during the forecast period, supported by London-area cloud demand and tighter planning scrutiny around electricity use. UK Parliament reported in May 2026 that data centers consume around 2.5% of the country’s electricity. This profile supports steady DAC refresh demand and limits sudden expansion compared against larger AI buildout markets.
- Over the assessment period, Germany is forecast to advance at 10.1% CAGR in this market, shaped by enterprise colocation and standards-sensitive buying behavior. The German federal economic ministry stated in December 2024 that data center capacity reached 2,730 MW. Germany differs from higher-CAGR markets by requiring efficiency proof before buyers widen approved cable lists.
- Through 2036, France is anticipated to post 10.0% CAGR in server DAC demand, reinforced by sovereign AI strategy and cloud infrastructure investment. The French presidency said in February 2025 that more than EUR 109 billion in AI infrastructure investments were announced during the Paris summit. France’s profile is policy-led and favors suppliers that document qualification for public and hyperscale builds.
- Japan is likely to expand at 10.8% CAGR by 2036, influenced by reliability-focused data center planning and energy security concerns. The International Energy Agency noted in April 2025 that Japan’s seventh Strategic Energy Plan targets a 73% greenhouse gas reduction by FY2040. This makes rack-level power and reliability evidence more important than lowest purchase price alone.
- China is estimated to rise at 12.4% CAGR between 2026 and 2036, led by national computing hubs and local connector manufacturing depth. China’s State Council reported in July 2024 that average data center PUE would be lowered below 1.5 by 2025. China differs from others by using local sourcing depth to increase price pressure for global cable vendors.
- Demand in South Korea is projected to grow at 11.7% CAGR by 2036, propelled by AI computing policy and semiconductor ecosystem support. The Ministry of Science and ICT said in 2024 that Korea aims to expand GPU capability to over two exaflops by 2030. This links DAC demand to national AI infrastructure and creates a compute-led growth path.
- India is expected to grow at 12.1% CAGR during the forecast period, attributable to colocation clusters in major metros and AI-ready server rooms. Invest India reported in May 2026 that installed data center capacity could rise from about 1.5 GW to nearly 5 GW by 2030. India differs by combining large builds and price-sensitive enterprise replacement demand.
Who are the notable companies in the server direct attach cables market?
Amphenol, Molex, TE Connectivity, Samtec, Cisco, Broadcom, NVIDIA, Credo Technology, Luxshare Precision and HFCL are the notable companies shaping this market.
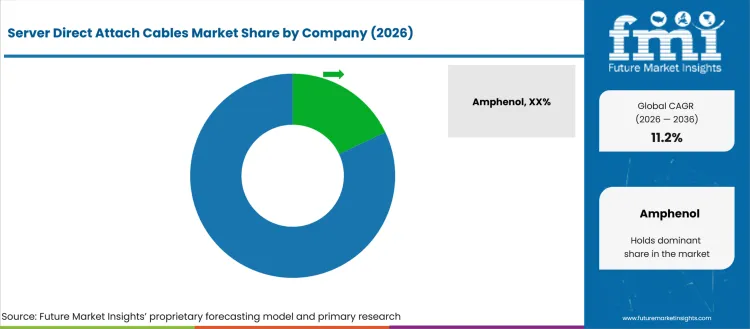
Supplier competition is structured around the layer where buyers want to control link risk. Amphenol, Molex, TE Connectivity and Samtec are better suited to buyers that need cable breadth and engineering support. Cisco, Broadcom and NVIDIA become important once approval is tied to switch silicon and AI server platforms. Credo Technology gains relevance if passive copper cannot meet reach needs. Luxshare Precision and HFCL matter if local supply and cost control influence procurement. The server and switching equipment context shows how platform vendors shape cable form factors before qualification starts.
- Cable assembly suppliers are relevant for buyers that need validated passive copper, active copper and twinax options. Amphenol and Molex compete on connector breadth. TE Connectivity and Samtec add engineering depth for short server links. Their role is tied to approved vendor lists and exact cable length support.
- Platform suppliers influence demand owing to switch and AI server designs that define approved cable formats. Cisco and Broadcom shape qualification expectations around faster Ethernet fabrics. NVIDIA affects the same process through AI platform choices. These companies matter even if they are not the final cable seller.
- Active electrical cable specialists gain preference in rack designs that exceed passive copper reach or signal limits. Credo Technology competes around retimed copper links for AI back-end networks. This role matters in wider racks and cooling designs that stretch passive cable limits.
- Regional and high-volume manufacturers support buyers that need local supply and price control. Luxshare Precision and HFCL serve procurement routes that combine assembly capacity and channel access. Their role becomes more relevant in country-level builds that need shorter supply chains and cost-sensitive replacement options.
Competitive Benchmarking: Server Direct Attach Cables Market
| Company | High-Speed DAC Portfolio | Platform Qualification Depth | AI Fabric Relevance | Service Reach |
|---|---|---|---|---|
| Amphenol | High | Strong | Strong | Global |
| Molex | High | Strong | Strong | Global |
| TE Connectivity | High | Strong | Medium | Global |
| Samtec | Medium | Strong | Strong | Global |
| Cisco | Medium | High | Strong | Global |
| Broadcom | Low | High | Strong | Global |
| NVIDIA | Low | High | Strong | Global |
| Credo Technology | Medium | High | High | Global |
| Luxshare Precision | High | Medium | Medium | Global |
| HFCL | Medium | Medium | Medium | Regional |
Source: Future Market Insights competitive analysis, 2026. Ratings reflect relative portfolio relevance, workflow or project fit, service capability, and geographic reach.
Key Developments in the Server Direct Attach Cables Market
- In February 2024, Samtec released rugged high-speed twinax cable solutions for PAM4 applications. The update matters for server DAC suppliers by showing how twinax design and termination quality affect next-speed validation work. The market implication is clearer demand for suppliers that can prove signal integrity before high-density racks move into approval.
- In June 2025, Broadcom shipped the Tomahawk 6 switch series delivering 102.4 Tbps of switching capacity in a single chip. The action matters for server DAC demand by raising the bandwidth context around Ethernet fabrics. Cable suppliers must align reach, form factor and signal testing with faster switching platforms.
- In March 2025, Amphenol Communications Solutions said it would showcase DAC and ACC options at OFC. The company included 800G OSFP and QSFP-DD cable formats in short lengths for high-speed interconnects. The development points to tighter rack sizing needs and the need for validated cable options near AI servers.
- In October 2025, NVIDIA said Spectrum-X Ethernet switches were being used to speed networks for Meta and Oracle. The development points to AI Ethernet fabric expansion that requires server DAC suppliers to align cable qualification with switch choices and GPU cluster architecture.
Key Players in the Server Direct Attach Cables Market
Cable Assembly and Connector Suppliers
- Amphenol
- Molex
- TE Connectivity
- Samtec
- Luxshare Precision
- HFCL
Platform and Silicon Influencers
- Cisco
- Broadcom
- NVIDIA
Active Electrical Cable Specialists
- Credo Technology
Server Direct Attach Cables Market - Report Scope
| Coverage field | Report scope |
|---|---|
| Market breakdown | Server Direct Attach Cables Market Breakdown By Cable Type, Speed, End Use, Connector Type, Sales Channel, and Region |
| Market Definition | Factory-terminated copper assemblies used to connect servers, switches, storage systems and accelerator nodes over short data center distances |
| Regions Covered | North America, Latin America, Europe, East Asia, South Asia and Pacific, Middle East and Africa |
| Countries Covered | United States, United Kingdom, Germany, France, Japan, China, South Korea, India and 30+ countries |
| Key Companies Profiled | Amphenol, Molex, TE Connectivity, Samtec, Cisco, Broadcom, NVIDIA, Credo Technology, Luxshare Precision, HFCL |
| Forecast Period | 2026 to 2036 |
| Approach | Hybrid bottom-up and demand-side methodology using cable volumes, speed migration, rack density, platform validation and country-level data center demand signals |
Server Direct Attach Cables Market - Research Methodology
| Method | Approach |
|---|---|
| Primary Research | FMI analysts reviewed inputs from data center network architects, server OEM teams, cable assembly suppliers, distributors and system integrators. Discussions focused on cable qualification, connector choice, rack airflow, approved vendor lists and support expectations. |
| Desk Research | Desk research covered Ethernet standards, government data center policy sources, official energy reports, company product information and public release updates. Product relevance was checked against passive DAC, active DAC, twinax, OSFP, QSFP-DD and server rack use. |
| Market Sizing and Forecasting | The model combined cable volumes, average selling prices, speed migration, rack density and country data center expansion signals. Segment shares were adjusted for hyperscale, enterprise, telecom edge and HPC adoption patterns across the forecast period. |
| Data Validation | Forecasts were checked against high-speed Ethernet standards, official data center energy indicators, company portfolios and buyer qualification routes. Duplicate external statistics were avoided by assigning each public figure to one article section before final writing. |
Server Direct Attach Cables Market by Segments
Server Direct Attach Cables Market segmented by Cable Type:
- Passive Copper DAC
- Active Copper DAC
- Breakout DAC
- High-speed Twinax
Server Direct Attach Cables Market segmented by Speed:
- 25G / 40G
- 100G
- 200G / 400G
- 800G and Above
Server Direct Attach Cables Market segmented by End Use:
- Hyperscale Data Centers
- Enterprise Data Centers
- Telecom / Cloud Edge
- HPC / AI Clusters
Server Direct Attach Cables Market segmented by Connector Type:
- SFP / SFP+
- QSFP / QSFP-DD
- OSFP
- Other
Server Direct Attach Cables Market segmented by Sales Channel:
- Direct OEM
- Distributors
- System Integrators
Server Direct Attach Cables Market by Region:
- North America
- United States
- Canada
- Europe
- Germany
- United Kingdom
- France
- Italy
- Spain
- Asia Pacific
- China
- Japan
- South Korea
- Taiwan
- Singapore
- Latin America
- Brazil
- Mexico
- Argentina
- Middle East & Africa
- GCC Countries
- South Africa
- Israel
Research Sources and Bibliography
- Institute of Electrical and Electronics Engineers. (2024, March 15). IEEE 802.3df-2024. IEEE Standards Association.
- International Energy Agency. (2025, April). Energy demand from AI. IEA.
- USA Department of Energy. (2024, December 20). DOE releases new report evaluating increase in electricity demand from data centers. USA Department of Energy.
- Lawrence Berkeley National Laboratory. (2025, January 15). Berkeley Lab report evaluates increase in electricity demand from data centers. Lawrence Berkeley National Laboratory.
- House of Commons Library. (2026, May 27). Data centres: planning policy, sustainability, and resilience. UK Parliament.
- Federal Ministry for Economic Affairs and Climate Action. (2024, December). Status and development of the German data centre landscape executive summary. BMWK.
- Presidency of the French Republic. (2025, February 11). Make France an AI powerhouse. Élysée.
- International Energy Agency. (2025, April 28). Seventh Strategic Energy Plan. IEA Policies.
- State Council of the People’s Republic of China. (2024, July 24). China sets green targets for data centers. The State Council.
- Ministry of Science and ICT. (2024, September). National AI Strategy Policy Directions. Government of the Republic of Korea.
- Invest India. (2026, May 14). India’s Data Centre Opportunity: Building Digital Infrastructure at Scale. Invest India.
- Samtec. (2024, February 28). High-Speed Twinax Cable Solutions To 224 and 112 Gbps PAM4. Samtec.
- Cisco. (2024, June 4). Cisco Reveals Nexus HyperFabric AI Clusters with NVIDIA. Cisco Newsroom.
- Credo Technology Group. (2024, October 10). Credo Introduces 800G HiWire Zeroflap AECs to Support AI Backend Networks. Credo.
- Amphenol Communications Solutions. (2025, March 28). Leading the Evolution of Optical Interconnect: Amphenol @ OFC 2025. Amphenol Communications Solutions.
- NVIDIA. (2025, October 13). NVIDIA Spectrum-X Ethernet Switches Speed Up Networks for Meta and Oracle. NVIDIA Investor Relations.
- Broadcom. (2025, June 3). Broadcom Ships Tomahawk 6: World’s First 102.4 Tbps Switch. Broadcom.
This bibliography is provided for reader reference and uses primary government, standards-body, official trade body, and company sources.
This Report Answers
- What is the expected global value of the Server Direct Attach Cables Market in 2026 and 2036?
- What CAGR is forecast for server direct attach cables during the 2026 to 2036 period?
- Which cable type and speed categories show notable demand in 2026?
- Why do hyperscale data centers and AI clusters buy validated DAC assemblies?
- How do OSFP and QSFP-DD connector choices affect server cable qualification?
- Which countries are compared in the server direct attach cables forecast?
- Which companies compete across DAC assemblies, switching platforms and active electrical cables?
- What products are included within the server direct attach cable market definition?
- How does FMI size and forecast server DAC demand across segments and countries?
- What supplier-selection factors should executives assess before approving DAC vendors?
Frequently Asked Questions
Why should executives track the Server Direct Attach Cables Market?
Executives should track this market because short reach copper links directly affect rack power efficiency link stability and downtime risk in AI dense data center deployments.
What business problem does the Server Direct Attach Cables Market address?
It provides low latency server to switch connectivity while reducing power draw and heat compared with optical modules inside dense racks.
What should procurement leaders evaluate before selecting suppliers?
Procurement leaders should evaluate signal integrity proof approved platform status connector compatibility exact length availability and replacement lead times.
What can limit return on investment for buyers?
Return on investment can be limited by poor cable qualification routing constraints and incompatibility with approved server or switch platforms.
How can suppliers build executive confidence?
Suppliers build confidence by delivering validated performance consistent manufacturing tight length tolerances and reliable OEM qualification support.
Preview the report firsthand - request a free sample
Get SampleGet the brochure for pricing and purchase details.
Get PDFTable of Content
- Key Takeaways
- Market Size and CAGR
- Top Growth Driver
- Fastest Growing Segment
- Leading Region
- Key Companies
- Emerging Opportunities
- Executive Summary
- Global Market Outlook
- Demand-side Trends
- Supply-side Trends
- Technology Roadmap Analysis
- Analysis and Recommendations
- Analyst Perspective (What is happening? Why now? What should investors know?)
- Key Questions Answered
- How large is the market?
- What is the CAGR?
- What are key trends?
- Which region dominates?
- Who are the leaders?
- Market Overview
- Market Coverage / Taxonomy
- Market Definition / Scope / Limitations
- Research Methodology
- Chapter Orientation
- Analytical Lens and Working Hypotheses
- Market Structure, Signals, and Trend Drivers
- Benchmarking and Cross-market Comparability
- Market Sizing, Forecasting, and Opportunity Mapping
- Research Design and Evidence Framework
- Desk Research Programme (Secondary Evidence)
- Expert Input and Fieldwork (Primary Evidence)
- Tooling, Models, and Reference Databases
- Data Engineering and Model Build
- Quality Assurance and Audit Trail
- Market Background
- Market Dynamics (Drivers, Restraints, Opportunity, Trends)
- Scenario Forecast (Optimistic, Likely, Conservative)
- Impact Analysis
- AI Impact
- Sustainability Impact
- Regulatory Impact
- Technology Impact
- Consumer / Buyer Analysis
- Purchase Drivers
- Adoption Barriers
- Buyer Journey
- Opportunity Map Analysis
- Product Life Cycle Analysis
- Supply Chain Analysis
- Investment Feasibility Matrix
- Value Chain Analysis
- PESTLE and Porter's Analysis
- Regulatory Landscape
- Regional Parent Market Outlook
- Production and Consumption Statistics
- Import and Export Statistics
- Global Market Analysis and Forecast, 2021 to 2036
- Historical Market Size Value (USD Million) & Volume (Unit) Analysis, 2021 to 2025
- Current and Future Market Size Value (USD Million) & Volume (Unit) Projections, 2026 to 2036
- Y-o-Y Growth Trend Analysis
- Absolute $ Opportunity Analysis
- Global Market Pricing Analysis, 2021 to 2036
- Global Market Analysis and Forecast, By Cable Type, 2021 to 2036
- Introduction / Key Findings
- Historical Market Size Value (USD Million) & Volume (Unit) Analysis By Cable Type, 2021 to 2025
- Current and Future Market Size Value (USD Million) & Volume (Unit) Analysis and Forecast By Cable Type, 2026 to 2036
- Passive Copper DAC
- Active Copper DAC
- High-speed Twinax
- Breakout DAC
- Passive Copper DAC
- Y-o-Y Growth Trend Analysis By Cable Type, 2021 to 2025
- Absolute $ Opportunity Analysis By Cable Type, 2026 to 2036
- Global Market Analysis and Forecast, By Speed, 2021 to 2036
- Introduction / Key Findings
- Historical Market Size Value (USD Million) & Volume (Unit) Analysis By Speed, 2021 to 2025
- Current and Future Market Size Value (USD Million) & Volume (Unit) Analysis and Forecast By Speed, 2026 to 2036
- 100G
- 25G / 40G
- 800G and Above
- 200G / 400G
- 100G
- Y-o-Y Growth Trend Analysis By Speed, 2021 to 2025
- Absolute $ Opportunity Analysis By Speed, 2026 to 2036
- Global Market Analysis and Forecast, By End Use, 2021 to 2036
- Introduction / Key Findings
- Historical Market Size Value (USD Million) & Volume (Unit) Analysis By End Use, 2021 to 2025
- Current and Future Market Size Value (USD Million) & Volume (Unit) Analysis and Forecast By End Use, 2026 to 2036
- Hyperscale Data Centers
- Enterprise Data Centers
- HPC / AI Clusters
- Telecom / Cloud Edge
- Hyperscale Data Centers
- Y-o-Y Growth Trend Analysis By End Use, 2021 to 2025
- Absolute $ Opportunity Analysis By End Use, 2026 to 2036
- Global Market Analysis and Forecast, By Connector Type, 2021 to 2036
- Introduction / Key Findings
- Historical Market Size Value (USD Million) & Volume (Unit) Analysis By Connector Type, 2021 to 2025
- Current and Future Market Size Value (USD Million) & Volume (Unit) Analysis and Forecast By Connector Type, 2026 to 2036
- QSFP / QSFP-DD
- SFP / SFP+
- Other
- OSFP
- QSFP / QSFP-DD
- Y-o-Y Growth Trend Analysis By Connector Type, 2021 to 2025
- Absolute $ Opportunity Analysis By Connector Type, 2026 to 2036
- Global Market Analysis and Forecast, By Sales Channel, 2021 to 2036
- Introduction / Key Findings
- Historical Market Size Value (USD Million) & Volume (Unit) Analysis By Sales Channel, 2021 to 2025
- Current and Future Market Size Value (USD Million) & Volume (Unit) Analysis and Forecast By Sales Channel, 2026 to 2036
- Direct OEM
- Distributors
- System Integrators
- Direct OEM
- Y-o-Y Growth Trend Analysis By Sales Channel, 2021 to 2025
- Absolute $ Opportunity Analysis By Sales Channel, 2026 to 2036
- Global Market Analysis and Forecast, By Region, 2021 to 2036
- Introduction
- Historical Market Size Value (USD Million) & Volume (Unit) Analysis By Region, 2021 to 2025
- Current Market Size Value (USD Million) & Volume (Unit) Analysis and Forecast By Region, 2026 to 2036
- North America
- Latin America
- Western Europe
- Eastern Europe
- East Asia
- South Asia and Pacific
- Middle East & Africa
- Market Attractiveness Analysis By Region
- North America Market Analysis and Forecast, By Country, 2021 to 2036
- Historical Market Size Value (USD Million) & Volume (Unit) Trend Analysis By Market Taxonomy, 2021 to 2025
- Market Size Value (USD Million) & Volume (Unit) Forecast By Market Taxonomy, 2026 to 2036
- By Country
- USA
- Canada
- Mexico
- By Cable Type
- By Speed
- By End Use
- By Connector Type
- By Sales Channel
- By Country
- Market Attractiveness Analysis
- By Country
- By Cable Type
- By Speed
- By End Use
- By Connector Type
- By Sales Channel
- Key Takeaways
- Latin America Market Analysis and Forecast, By Country
- Historical Market Size Value (USD Million) & Volume (Unit) Trend Analysis By Market Taxonomy, 2021 to 2025
- Market Size Value (USD Million) & Volume (Unit) Forecast By Market Taxonomy, 2026 to 2036
- By Country
- Brazil
- Chile
- Rest of Latin America
- By Cable Type
- By Speed
- By End Use
- By Connector Type
- By Sales Channel
- By Country
- Market Attractiveness Analysis
- By Country
- By Cable Type
- By Speed
- By End Use
- By Connector Type
- By Sales Channel
- Key Takeaways
- Western Europe Market Analysis and Forecast, By Country
- Historical Market Size Value (USD Million) & Volume (Unit) Trend Analysis By Market Taxonomy, 2021 to 2025
- Market Size Value (USD Million) & Volume (Unit) Forecast By Market Taxonomy, 2026 to 2036
- By Country
- Germany
- UK
- Italy
- Spain
- France
- Nordic
- BENELUX
- Rest of Western Europe
- By Cable Type
- By Speed
- By End Use
- By Connector Type
- By Sales Channel
- By Country
- Market Attractiveness Analysis
- By Country
- By Cable Type
- By Speed
- By End Use
- By Connector Type
- By Sales Channel
- Key Takeaways
- Eastern Europe Market Analysis and Forecast, By Country
- Historical Market Size Value (USD Million) & Volume (Unit) Trend Analysis By Market Taxonomy, 2021 to 2025
- Market Size Value (USD Million) & Volume (Unit) Forecast By Market Taxonomy, 2026 to 2036
- By Country
- Russia
- Poland
- Hungary
- Balkan & Baltic
- Rest of Eastern Europe
- By Cable Type
- By Speed
- By End Use
- By Connector Type
- By Sales Channel
- By Country
- Market Attractiveness Analysis
- By Country
- By Cable Type
- By Speed
- By End Use
- By Connector Type
- By Sales Channel
- Key Takeaways
- East Asia Market Analysis and Forecast, By Country
- Historical Market Size Value (USD Million) & Volume (Unit) Trend Analysis By Market Taxonomy, 2021 to 2025
- Market Size Value (USD Million) & Volume (Unit) Forecast By Market Taxonomy, 2026 to 2036
- By Country
- China
- Japan
- South Korea
- By Cable Type
- By Speed
- By End Use
- By Connector Type
- By Sales Channel
- By Country
- Market Attractiveness Analysis
- By Country
- By Cable Type
- By Speed
- By End Use
- By Connector Type
- By Sales Channel
- Key Takeaways
- South Asia and Pacific Market Analysis and Forecast, By Country
- Historical Market Size Value (USD Million) & Volume (Unit) Trend Analysis By Market Taxonomy, 2021 to 2025
- Market Size Value (USD Million) & Volume (Unit) Forecast By Market Taxonomy, 2026 to 2036
- By Country
- India
- ASEAN
- Australia & New Zealand
- Rest of South Asia and Pacific
- By Cable Type
- By Speed
- By End Use
- By Connector Type
- By Sales Channel
- By Country
- Market Attractiveness Analysis
- By Country
- By Cable Type
- By Speed
- By End Use
- By Connector Type
- By Sales Channel
- Key Takeaways
- Middle East & Africa Market Analysis and Forecast, By Country
- Historical Market Size Value (USD Million) & Volume (Unit) Trend Analysis By Market Taxonomy, 2021 to 2025
- Market Size Value (USD Million) & Volume (Unit) Forecast By Market Taxonomy, 2026 to 2036
- By Country
- Kingdom of Saudi Arabia
- Other GCC Countries
- Türkiye
- South Africa
- Other African Union
- Rest of Middle East & Africa
- By Cable Type
- By Speed
- By End Use
- By Connector Type
- By Sales Channel
- By Country
- Market Attractiveness Analysis
- By Country
- By Cable Type
- By Speed
- By End Use
- By Connector Type
- By Sales Channel
- Key Takeaways
- Key Countries Market Analysis
- USA
- Pricing Analysis
- Market Share Analysis, 2025
- By Cable Type
- By Speed
- By End Use
- By Connector Type
- By Sales Channel
- Canada
- Pricing Analysis
- Market Share Analysis, 2025
- By Cable Type
- By Speed
- By End Use
- By Connector Type
- By Sales Channel
- Mexico
- Pricing Analysis
- Market Share Analysis, 2025
- By Cable Type
- By Speed
- By End Use
- By Connector Type
- By Sales Channel
- Brazil
- Pricing Analysis
- Market Share Analysis, 2025
- By Cable Type
- By Speed
- By End Use
- By Connector Type
- By Sales Channel
- Chile
- Pricing Analysis
- Market Share Analysis, 2025
- By Cable Type
- By Speed
- By End Use
- By Connector Type
- By Sales Channel
- Germany
- Pricing Analysis
- Market Share Analysis, 2025
- By Cable Type
- By Speed
- By End Use
- By Connector Type
- By Sales Channel
- UK
- Pricing Analysis
- Market Share Analysis, 2025
- By Cable Type
- By Speed
- By End Use
- By Connector Type
- By Sales Channel
- Italy
- Pricing Analysis
- Market Share Analysis, 2025
- By Cable Type
- By Speed
- By End Use
- By Connector Type
- By Sales Channel
- Spain
- Pricing Analysis
- Market Share Analysis, 2025
- By Cable Type
- By Speed
- By End Use
- By Connector Type
- By Sales Channel
- France
- Pricing Analysis
- Market Share Analysis, 2025
- By Cable Type
- By Speed
- By End Use
- By Connector Type
- By Sales Channel
- India
- Pricing Analysis
- Market Share Analysis, 2025
- By Cable Type
- By Speed
- By End Use
- By Connector Type
- By Sales Channel
- ASEAN
- Pricing Analysis
- Market Share Analysis, 2025
- By Cable Type
- By Speed
- By End Use
- By Connector Type
- By Sales Channel
- Australia & New Zealand
- Pricing Analysis
- Market Share Analysis, 2025
- By Cable Type
- By Speed
- By End Use
- By Connector Type
- By Sales Channel
- China
- Pricing Analysis
- Market Share Analysis, 2025
- By Cable Type
- By Speed
- By End Use
- By Connector Type
- By Sales Channel
- Japan
- Pricing Analysis
- Market Share Analysis, 2025
- By Cable Type
- By Speed
- By End Use
- By Connector Type
- By Sales Channel
- South Korea
- Pricing Analysis
- Market Share Analysis, 2025
- By Cable Type
- By Speed
- By End Use
- By Connector Type
- By Sales Channel
- Russia
- Pricing Analysis
- Market Share Analysis, 2025
- By Cable Type
- By Speed
- By End Use
- By Connector Type
- By Sales Channel
- Poland
- Pricing Analysis
- Market Share Analysis, 2025
- By Cable Type
- By Speed
- By End Use
- By Connector Type
- By Sales Channel
- Hungary
- Pricing Analysis
- Market Share Analysis, 2025
- By Cable Type
- By Speed
- By End Use
- By Connector Type
- By Sales Channel
- Kingdom of Saudi Arabia
- Pricing Analysis
- Market Share Analysis, 2025
- By Cable Type
- By Speed
- By End Use
- By Connector Type
- By Sales Channel
- Türkiye
- Pricing Analysis
- Market Share Analysis, 2025
- By Cable Type
- By Speed
- By End Use
- By Connector Type
- By Sales Channel
- South Africa
- Pricing Analysis
- Market Share Analysis, 2025
- By Cable Type
- By Speed
- By End Use
- By Connector Type
- By Sales Channel
- USA
- Market Structure Analysis
- Competition Dashboard
- Competition Benchmarking
- Market Share Analysis of Top Players
- By Regional
- By Cable Type
- By Speed
- By End Use
- By Connector Type
- By Sales Channel
- Emerging Startups
- Innovation Benchmarking
- Competition Analysis
- Competition Deep Dive
- Amphenol
- Overview
- Product Portfolio
- Profitability by Market Segments (Product/Region/Sales Channel)
- Sales Footprint
- Strategy Overview
- Marketing Strategy
- Product Strategy
- Channel Strategy
- Molex
- TE Connectivity
- Samtec
- Luxshare Precision
- HFCL
- Amphenol
- Case Studies
- Success Stories
- Recent Developments
- Competition Deep Dive
- Assumptions & Acronyms Used


