The copper cabling systems market is estimated at USD 8,188.6 million in 2025 and is forecasted to reach USD 12,356.3 million by 2035, reflecting a steady CAGR of 4.2%. Over the forecast period, the market is expected to witness consistent growth driven by increasing demand across telecommunications, power distribution, and construction sectors. The total cumulative growth of USD 4,167.7 million over the decade is distributed unevenly across years, with early gains contributing smaller proportions while mid-to-late years reflect higher absolute increments. In 2026, the market grows to USD 8,532.6 million, accounting for approximately 8.6% of the total growth, while by 2029 it reaches USD 9,653.4 million, representing a cumulative contribution of around 30% of the total forecasted expansion.
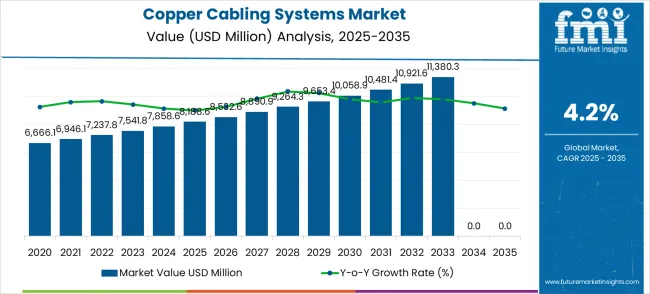
A closer look at year-on-year growth reveals that the incremental increases grow steadily, with the largest annual gains occurring in the latter half of the decade. For instance, the market adds USD 422.5 million between 2030 and 2031 and USD 498 million between 2034 and 2035, indicating a concentration of growth toward the latter years. This suggests that the market is likely to experience compound benefits from infrastructure expansion, technology upgrades, and increased capacity requirements in smart cities, renewable energy integration, and data centers.
| Metric | Value |
|---|---|
| Estimated Value in (2025E) | USD 8,188.6 million |
| Forecast Value in (2035F) | USD 12,356.3 million |
| Forecast CAGR (2025 to 2035) | 4.2% |
Segment-wise contribution to growth is also likely to vary, with telecommunications and power transmission segments showing larger shares. The rise of 5G networks, fiber optic hybrid cabling, and smart grid deployments will drive significant demand for advanced copper cabling solutions.
Telecommunications cabling will likely contribute heavily during the earlier years as network upgrades roll out, while industrial and construction cabling segments will see stronger growth toward the mid-to-late forecast period. This proportional shift explains why growth accelerates slightly in later years despite a steady CAGR, indicating segment diversification as a key driver of market expansion.
By 2035, the market’s growth share is distributed across a maturing portfolio of applications. The proportionate contribution of each year’s growth stabilizes between 8% and 12% of the total expansion, reflecting a balanced and sustainable trajectory. The later years, especially 2034–2035, show heightened contribution due to compounded demand from large-scale infrastructure and data center projects. Ratio and proportion analysis clearly illustrates a steady yet progressive growth pattern shaped by strategic sectoral shifts and steady demand for copper cabling infrastructure across industries.
Market expansion is being supported by the increasing demand for high-speed data transmission and the corresponding need for reliable network infrastructure solutions. Modern enterprises are increasingly focused on copper cabling systems that can support high bandwidth applications, ensure signal integrity, and provide cost-effective connectivity for local area networks. The proven reliability of copper cables in short-distance applications and their compatibility with existing network infrastructure makes them essential components of comprehensive networking solutions.
The growing focus on digital transformation and smart building technologies is driving demand for advanced copper cabling systems that address evolving connectivity requirements and performance standards. Enterprise preference for hybrid network architectures that combine copper and fiber solutions is creating opportunities for innovative cabling development. The rising influence of industry standards and network performance requirements is also contributing to increased adoption of certified copper cabling systems across different applications and installations.
The market is segmented by classification, application, and region. By classification, the market is divided into twisted pair, coaxial cable, and others. Based on application, the market is categorized into data center and enterprise network and building. Regionally, the market is divided into North America, Europe, East Asia, South Asia & Pacific, Latin America, and Middle East & Africa.
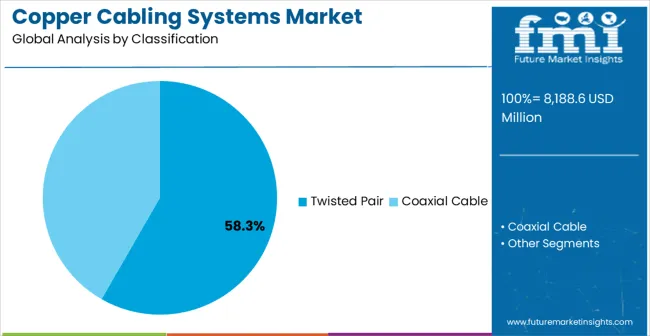
The twisted pair segment is projected to account for 58.3% of the copper cabling systems market in 2025, reaffirming its position as the category's dominant classification. Network infrastructure professionals increasingly recognize the superior performance characteristics of twisted pair cables for Ethernet applications, particularly their ability to reduce electromagnetic interference and provide consistent signal quality over extended distances. This cable type addresses both data transmission requirements and power delivery needs, providing comprehensive connectivity coverage.
This classification forms the foundation of most enterprise networking installations, as it represents the most widely adopted and standardized cabling approach in modern networks. Industry certifications and extensive compatibility testing continue to strengthen confidence in twisted pair formulations. With increasing recognition of the importance of structured cabling requiring standardized approaches, twisted pair cables align with both current installation practices and future network upgrade requirements. Their broad compatibility across multiple networking standards ensures sustained market dominance, making them the central growth driver of copper cabling system demand.
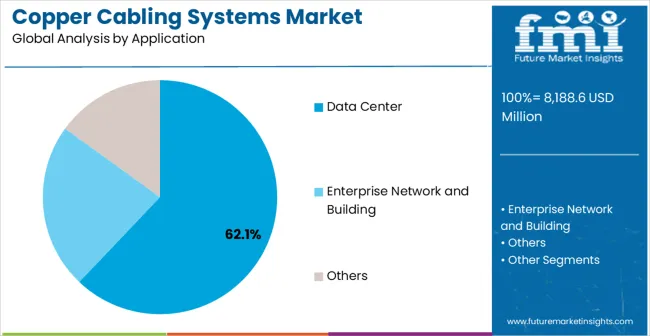
Data center applications are projected to represent 62.1% of copper cabling systems demand in 2025, underscoring their role as the primary application driving copper cabling adoption. Network infrastructure professionals recognize that data center environments require high-density, high-performance cabling solutions that copper systems can provide cost-effectively for server-to-switch connections and short-distance applications. Copper cabling systems offer optimal performance characteristics for top-of-rack switching and storage area network connectivity.
The segment is supported by the exponential growth of cloud computing requiring extensive data center infrastructure and the growing recognition that copper cabling provides superior price-performance ratios for specific applications. Additionally, data center operators are increasingly adopting hybrid architectures that leverage both copper and fiber solutions for optimal network performance. As data center designs continue to evolve toward higher density and improved energy efficiency, copper cabling systems will continue to play a crucial role in cost-effective connectivity strategies, reinforcing their essential position within the networking market.
The market is advancing steadily due to increasing demand for reliable network infrastructure and growing adoption of structured cabling solutions. The market faces challenges including competition from fiber optic solutions, bandwidth limitations for long-distance applications, and concerns about signal degradation. Innovation in cable design and network optimization technologies continue to influence product development and market expansion patterns.
The growing adoption of smart building technologies is enabling more sophisticated network infrastructure requirements and connectivity management. Smart building systems require comprehensive cabling infrastructure, including power over Ethernet capabilities and high-density connectivity solutions, that copper cabling systems can provide effectively. IoT device connectivity creates demand for flexible and scalable cabling architectures that can adapt to evolving technology requirements.
Modern network infrastructure companies are incorporating Power over Ethernet (PoE) technologies such as PoE+, PoE++, and emerging standards to enhance copper cabling system capabilities. These technologies improve installation efficiency, enable centralized power management, and provide better support for connected devices and systems. Advanced networking protocols also enable optimized performance monitoring and early identification of potential connectivity issues or performance degradation.
| Country | CAGR (2025-2035) |
|---|---|
| China | 5.7% |
| India | 5.3% |
| Germany | 4.8% |
| Brazil | 4.4% |
| USA | 4.0% |
| UK | 3.6% |
| Japan | 3.2% |
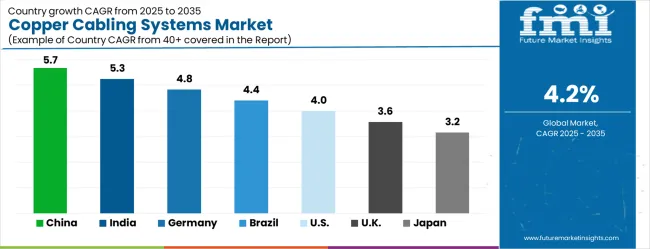
The market is experiencing varied growth globally, with China leading at a 5.7% CAGR through 2035, driven by expanding telecommunications infrastructure, increasing industrial digitalization, and growing investment in data center facilities. India follows at 5.3%, supported by digital transformation initiatives, increasing IT infrastructure development, and expanding enterprise networking requirements. Germany shows growth at 4.8%, focusing advanced manufacturing connectivity and Industry 4.0 implementation. Brazil records 4.4% growth, focusing on improved telecommunications infrastructure and enterprise network modernization. The USA shows 4.0% growth, representing a mature market with established networking standards and ongoing infrastructure upgrades.
The report covers an in-depth analysis of 40+ countries; top-performing countries are highlighted below.
China is projected to grow at a CAGR of 5.7% from 2025 to 2035, driven by rapid expansion in telecom infrastructure, data centers, and industrial automation. Copper cabling systems remain preferred for their reliability, high conductivity, and ease of installation. Domestic manufacturers are investing in high-performance cable solutions, automated manufacturing, and quality testing to meet growing demand. Growth is supported by government investment in smart city projects, 5G rollout, and industrial upgrades. Export demand for high-quality copper cabling from China is also increasing. Strategic partnerships between cabling producers and technology integrators are strengthening capability. Rising infrastructure projects and demand for stable communication networks ensure steady adoption of copper cabling solutions across China.
India is expected to grow at a CAGR of 5.3% between 2025 and 2035, supported by expansion in telecom networks, power distribution, and industrial infrastructure. Copper cabling systems are widely used for their durability, conductivity, and reliability. Local manufacturers are focusing on production efficiency, high-performance cable designs, and compliance with technical standards. Growth is fueled by rising government investment in rural broadband connectivity, smart grids, and industrial automation projects. Adoption in data centers and renewable energy transmission is also expanding. Partnerships between domestic cabling companies and international technology providers enhance product quality and competitiveness. Increased electrification and digital infrastructure rollout will continue to drive demand in India.
Germany is expected to grow at a CAGR of 4.8% during 2025–2035, driven by demand from industrial automation, renewable energy transmission, and telecom infrastructure. Copper cabling systems are preferred for their efficiency, reliability, and compliance with strict EU standards. German manufacturers are focusing on high-performance cables, automation in production, and material efficiency. Growth is supported by investment in smart factories, industrial upgrades, and green energy infrastructure. The automotive sector’s adoption of copper cabling for electric vehicle manufacturing is also significant. Research collaborations and adherence to high safety standards ensure steady adoption of advanced copper cabling systems. Germany’s export of high-quality cabling solutions strengthens its market position.
Brazil is projected to grow at a CAGR of 4.4% from 2025 to 2035, supported by demand from power distribution, telecom expansion, and industrial infrastructure projects. Copper cabling systems remain widely used due to durability, high conductivity, and adaptability to harsh environments. Local manufacturers focus on cost-efficient production and compliance with national technical standards. Growth is driven by rural electrification programs, expansion of renewable energy projects, and increased telecom network coverage. Export opportunities for copper cabling products also contribute to market expansion. Partnerships with global cable producers allow access to advanced materials and production methods, enhancing Brazil’s competitiveness in cabling systems manufacturing.
The United States is forecasted to grow at a CAGR of 4.0% during 2025–2035, driven by expansion in data centers, telecom infrastructure, and industrial automation. Copper cabling systems are preferred for their high conductivity, reliability, and ease of installation. Manufacturers focus on high-performance cable designs, compliance with industry standards, and energy-efficient production. Growth is supported by demand from cloud computing infrastructure, renewable energy transmission, and automotive manufacturing. Adoption in smart building projects and industrial upgrades is expanding. Collaborations with European and Asian cabling technology providers enhance product innovation. Rising demand for high-speed connectivity and resilient cabling infrastructure will continue to drive growth in the USA market.
The United Kingdom is expected to grow at a CAGR of 3.6% during 2025–2035, driven by demand in telecommunications, renewable energy, and industrial automation. Copper cabling systems are valued for reliability, performance, and durability in critical infrastructure projects. UK manufacturers focus on quality standards, high-performance cable designs, and cost optimization. Growth is supported by expansion in telecom networks, data centers, and power distribution systems. Smart city initiatives and renewable energy projects also encourage adoption. Strategic partnerships with global cabling producers provide access to cutting-edge technologies. Increasing export of specialized cabling products further strengthens the UK’s market presence.
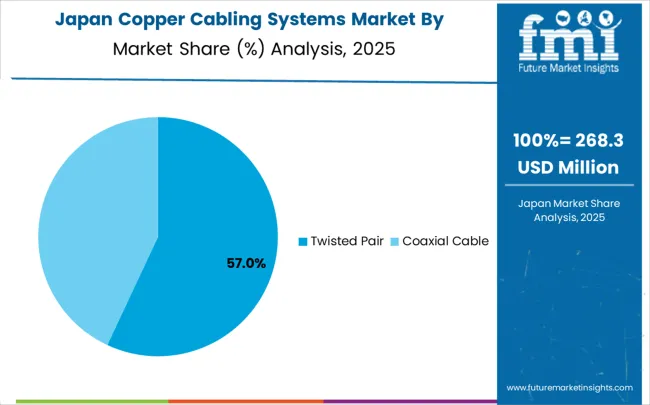
Japan is projected to grow at a CAGR of 3.2% from 2025 to 2035, driven by demand in telecommunications, industrial automation, and renewable energy. Copper cabling systems are preferred for their stability, reliability, and performance in harsh environments. Japanese manufacturers focus on high-purity copper, precision manufacturing, and efficient cabling solutions. Growth is supported by expanding telecom infrastructure, adoption of smart factory technologies, and renewable energy projects. Strong focus on quality, reliability, and safety ensures steady demand for copper cabling solutions. Export demand for specialized cabling products adds to market growth. Japan’s consistent investment in advanced infrastructure supports steady expansion of the copper cabling systems market.
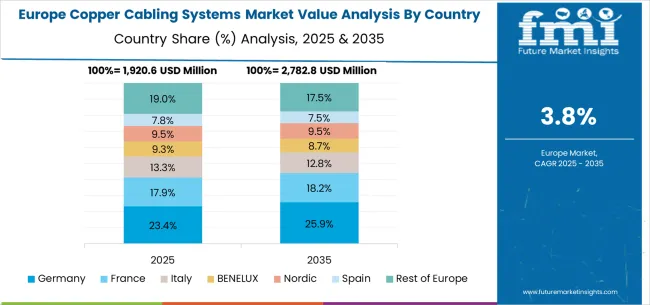
The copper cabling systems market in Europe is projected to expand steadily through 2035, supported by increasing adoption of structured cabling in enterprise environments, rising demand for reliable short-distance connectivity solutions, and ongoing innovation in network infrastructure technologies. Germany will continue to lead the regional market, accounting for 23.4% in 2025 and rising to 24.1% by 2035, supported by strong industrial networking requirements, advanced manufacturing infrastructure, and robust enterprise technology adoption. The United Kingdom follows with 18.2% in 2025, increasing to 18.7% by 2035, driven by comprehensive enterprise networking standards, digital transformation initiatives, and expanding data center infrastructure.
France holds 15.8% in 2025, edging up to 16.2% by 2035 as enterprise organizations expand structured cabling installations and demand grows for certified networking solutions. Italy contributes 12.3% in 2025, remaining broadly stable at 12.6% by 2035, supported by growing industrial automation programs and increasing enterprise networking adoption. Spain represents 9.1% in 2025, inching upward to 9.4% by 2035, underpinned by strengthening telecommunications infrastructure and enterprise digital transformation programs.
BENELUX markets together account for 8.7% in 2025, moving to 9.0% by 2035, supported by advanced networking requirements and enterprise technology innovation. The Nordic countries represent 6.8% in 2025, marginally increasing to 7.0% by 2035, with demand fueled by comprehensive digital infrastructure and early adoption of advanced networking technologies. The Rest of Western Europe moderates from 5.7% in 2025 to 3.0% by 2035, as larger core markets capture a greater share of infrastructure investment, enterprise networking projects, and copper cabling system adoption.
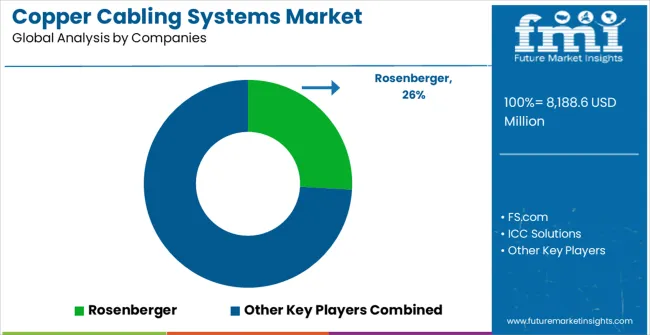
The market is characterized by competition among established networking infrastructure companies, specialized cabling manufacturers, and comprehensive connectivity solution providers. Companies are investing in product innovation, quality certification, strategic partnerships, and technical support services to deliver reliable, high-performance, and cost-effective copper cabling solutions. Product development, industry certification, and market access strategies are central to strengthening product portfolios and market presence.
Rosenberger leads the market with comprehensive copper cabling solutions focusing on high-quality connectivity and performance optimization. FS.com provides extensive networking product portfolios with focus on cost-effectiveness and technical support. ICC Solutions focuses on structured cabling systems and professional installation services for enterprise applications. Panduit delivers established networking infrastructure products with strong industry certifications and technical expertise.
Copperled Cabling operates with focus on specialized copper solutions and custom installation services for diverse networking requirements. AFL Global provides comprehensive networking infrastructure including copper and fiber solutions across multiple market segments. aicom, Connectix, and Molex deliver innovative connectivity solutions with focus on performance optimization and industry compliance. Connected Enterprise Solutions, CommScope, and Legrand provide comprehensive networking infrastructure portfolios including copper cabling systems, installation services, and technical support to enhance market accessibility and customer satisfaction.
| Items | Values |
|---|---|
| Quantitative Units (2025) | USD 8,188.6 million |
| Classification | Twisted Pair, Coaxial Cable, Others |
| Application | Data Center, Enterprise Network and Building |
| Regions Covered | North America, Europe, East Asia, South Asia & Pacific, Latin America, Middle East & Africa |
| Countries Covered | United States, Canada, United Kingdom, Germany, France, China, Japan, South Korea, India, Brazil, Australia and 40+ countries |
| Key Companies Profiled | Rosenberger, FS.com, ICC Solutions, Panduit, Copperled Cabling, AFL Global, aicom, Connectix, Molex, Connected Enterprise Solutions, CommScope, Legrand |
| Additional Attributes | Dollar sales by cable type and application, regional demand trends, competitive landscape, enterprise preferences for specific solutions, integration with network infrastructure, innovations in cable design, installation best practices, and performance optimization |
The global copper cabling systems market is estimated to be valued at USD 8,188.6 million in 2025.
The market size for the copper cabling systems market is projected to reach USD 12,356.3 million by 2035.
The copper cabling systems market is expected to grow at a 4.2% CAGR between 2025 and 2035.
The key product types in copper cabling systems market are twisted pair and coaxial cable.
In terms of application, data center segment to command 62.1% share in the copper cabling systems market in 2025.


Our Research Products

The "Full Research Suite" delivers actionable market intel, deep dives on markets or technologies, so clients act faster, cut risk, and unlock growth.

The Leaderboard benchmarks and ranks top vendors, classifying them as Established Leaders, Leading Challengers, or Disruptors & Challengers.

Locates where complements amplify value and substitutes erode it, forecasting net impact by horizon

We deliver granular, decision-grade intel: market sizing, 5-year forecasts, pricing, adoption, usage, revenue, and operational KPIs—plus competitor tracking, regulation, and value chains—across 60 countries broadly.

Spot the shifts before they hit your P&L. We track inflection points, adoption curves, pricing moves, and ecosystem plays to show where demand is heading, why it is changing, and what to do next across high-growth markets and disruptive tech

Real-time reads of user behavior. We track shifting priorities, perceptions of today’s and next-gen services, and provider experience, then pace how fast tech moves from trial to adoption, blending buyer, consumer, and channel inputs with social signals (#WhySwitch, #UX).

Partner with our analyst team to build a custom report designed around your business priorities. From analysing market trends to assessing competitors or crafting bespoke datasets, we tailor insights to your needs.
Supplier Intelligence
Discovery & Profiling
Capacity & Footprint
Performance & Risk
Compliance & Governance
Commercial Readiness
Who Supplies Whom
Scorecards & Shortlists
Playbooks & Docs
Category Intelligence
Definition & Scope
Demand & Use Cases
Cost Drivers
Market Structure
Supply Chain Map
Trade & Policy
Operating Norms
Deliverables
Buyer Intelligence
Account Basics
Spend & Scope
Procurement Model
Vendor Requirements
Terms & Policies
Entry Strategy
Pain Points & Triggers
Outputs
Pricing Analysis
Benchmarks
Trends
Should-Cost
Indexation
Landed Cost
Commercial Terms
Deliverables
Brand Analysis
Positioning & Value Prop
Share & Presence
Customer Evidence
Go-to-Market
Digital & Reputation
Compliance & Trust
KPIs & Gaps
Outputs
Full Research Suite comprises of:
Market outlook & trends analysis
Interviews & case studies
Strategic recommendations
Vendor profiles & capabilities analysis
5-year forecasts
8 regions and 60+ country-level data splits
Market segment data splits
12 months of continuous data updates
DELIVERED AS:
PDF EXCEL ONLINE
Copper(II) Carbonate Basic Market Size and Share Forecast Outlook 2025 to 2035
Copper Chrome Black Market Size and Share Forecast Outlook 2025 to 2035
Copper and Aluminum Terminal Blocks Market Size and Share Forecast Outlook 2025 to 2035
Copper Coated Film Market Size and Share Forecast Outlook 2025 to 2035
Copper Foil Rolling Mill Market Forecast and Outlook 2025 to 2035
Copper and Aluminum Welding Bar Market Size and Share Forecast Outlook 2025 to 2035
Copper Pipes and Tubes Market Size and Share Forecast Outlook 2025 to 2035
Copper Chromite Black Pigment Market Size and Share Forecast Outlook 2025 to 2035
Copper Bismuth Catalyst Market Size and Share Forecast Outlook 2025 to 2035
Copper and Brass Flat Products Market Size and Share Forecast Outlook 2025 to 2035
Copper Oxychloride Market Size and Share Forecast Outlook 2025 to 2035
Copper and Copper Alloy Scrap and Recycling Market Size and Share Forecast Outlook 2025 to 2035
Copper Fungicides Market Size and Share Forecast Outlook 2025 to 2035
Copper Tube Market Size and Share Forecast Outlook 2025 to 2035
Copper Foil Market Growth - Trends & Forecast 2025 to 2035
Copper Azoles Market
Beryllium Copper for Consumer Electronics Market Size and Share Forecast Outlook 2025 to 2035
Beryllium Copper for Telecommunication Market Size and Share Forecast Outlook 2025 to 2035
Beryllium Copper for Automobile Market Size and Share Forecast Outlook 2025 to 2035
Beryllium Copper Plate Market Size and Share Forecast Outlook 2025 to 2035

Thank you!
You will receive an email from our Business Development Manager. Please be sure to check your SPAM/JUNK folder too.
Chat With
MaRIA