
- Market Size (2026)
- USD 7.7 Bn
- Forecast (2036)
- USD 12.5 Bn
- CAGR (2026 to 2036)
- 5.0%
How Big Is the Silicon Metal Market in 2026?
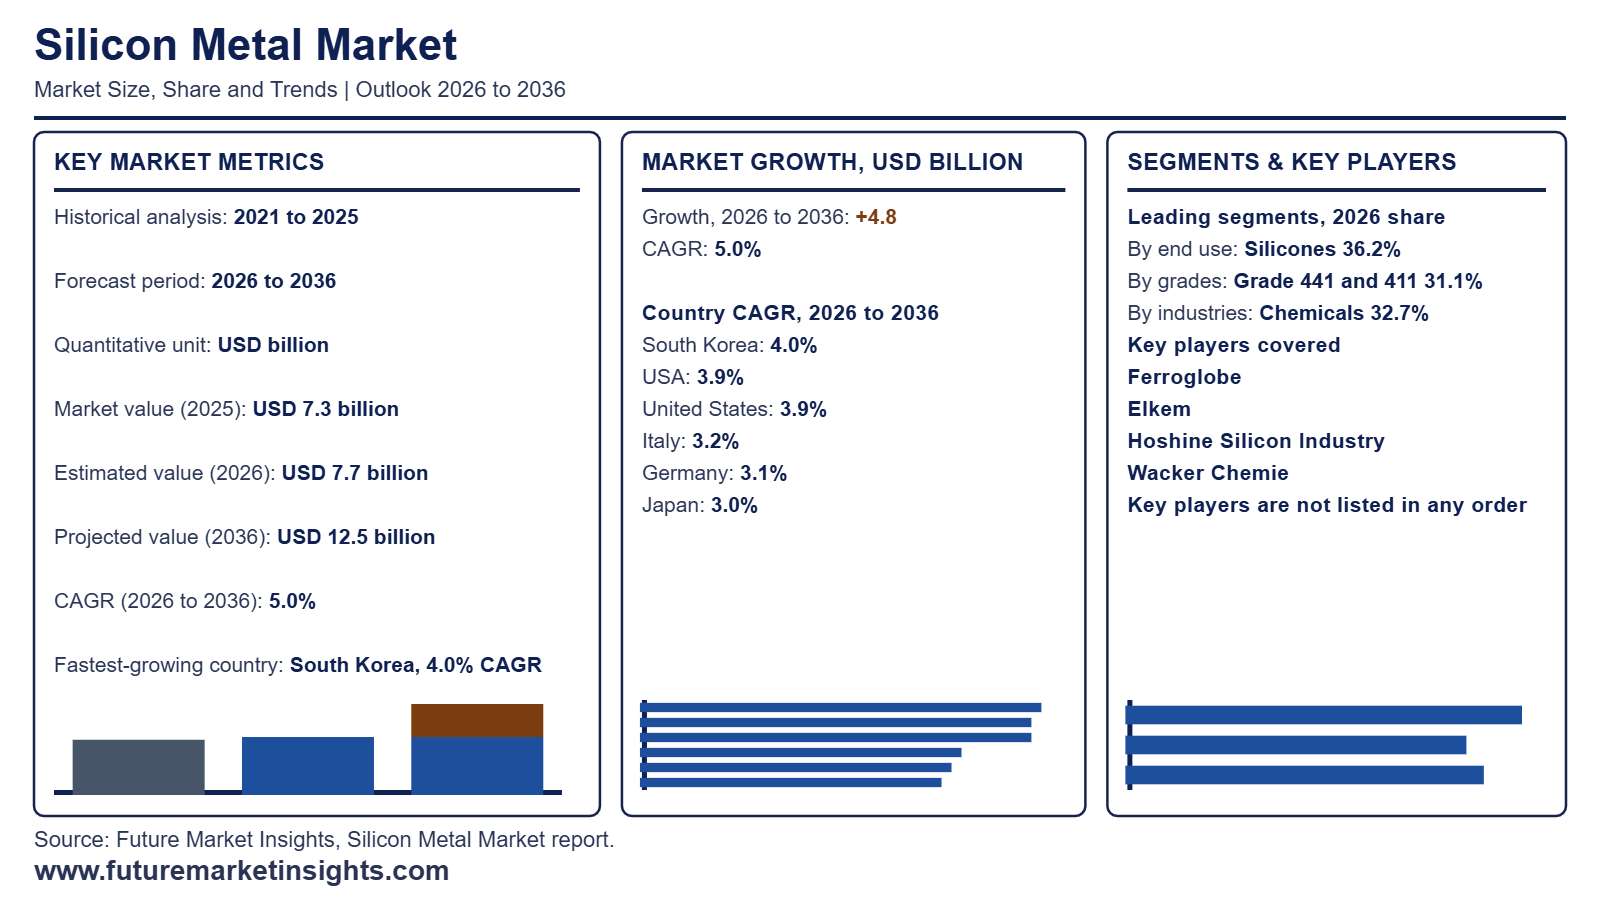
The global silicon metal market is valued at USD 7.7 billion in 2026, up from USD 7.3 billion in 2025, and is projected by Future Market Insights (FMI) to reach USD 12.5 billion by 2036, expanding at a 5.0% CAGR to generate USD 4.8 billion in incremental revenue over the forecast decade.
| Market Metric | Valuation / Share / Forecast Benchmark |
|---|---|
| 2025 Market Size (Historical) | USD 7.3 billion |
| 2026 Market Size (Estimated) | USD 7.7 billion |
| 2036 Market Size (Projected) | USD 12.5 billion |
| Compound Annual Growth Rate (2026 to 2036) | 5.0% CAGR |
| Incremental Dollar Opportunity (2026 to 2036) | USD 4.8 billion |
| Dominant End Use (2026 to 2036 Share) | Silicones (36.2% in 2026, easing to 35.1% by 2036) |
| Leading & Fastest-Growing Grades | Grade 441 and 411 (31.1% share in 2026; 4.6% CAGR) | Grade 3303 and 2202 (6.3% CAGR) |
| Leading & Fastest-Growing Industries | Chemicals (32.7% share in 2026; 4.7% CAGR) | Solar and Electronics (6.8% CAGR) |
| Largest Country Markets (2026 Global Share) | USA (12.0%), Germany (6.5%), Japan (5.8%) |
| Fastest-Growing Country Markets (2026 to 2036) | South Korea (4.0% CAGR), USA (3.9% CAGR), Italy (3.2% CAGR) |
| Leading Tier-1 Companies | Ferroglobe, Elkem, Hoshine Silicon Industry, Wacker Chemie |
Source: Future Market Insights analysis of the silicon metal market, 2026.
Executive Market Overview
Global demand for silicon metal rests on its role as a reactant, not a structural material: silicone makers feed it into chlorosilane chemistry, foundries make aluminum alloys with it, and polysilicon plants refine it for solar and semiconductor use, so buyers reorder against trace-element consistency and approved lots rather than spot discounts. Asia-Pacific leads because furnace capacity sits beside the conversion plants it supplies, while India and Southeast Asia are emerging as solar and silicone plants localize feedstock. The USA is the largest profiled country market at a 12.0% share, followed by Germany at 6.5% on chemical clusters, while South Korea grows fastest at a 4.0% CAGR on electronics demand.
Silicon metal is a power-intensive furnace product, so electricity and reductant costs set the margin floor, while anti-dumping reviews in importing markets can reroute supply and reset contract prices. Producers are responding by shifting tonnage into tighter-specification grades, signing multi-year agreements with silicone and polysilicon converters, and ring-fencing chemical-grade output from commodity alloy sales. FMI projects Polysilicon for Solar and Semiconductors at a 6.9% CAGR and Grade 3303 and 2202 at a 6.3% CAGR, against 5.0% for the market. Market sizing covers metallurgical and chemical grade silicon metal sold as lump, granules, powder, and fines and chips, while excluding ferrosilicon, silicon carbide, silica fume, and finished silicones and polysilicon.
Analyst Perspective
“I expect silicon metal revenue to be led by chemical and polysilicon grades, as silicones and solar buyers pay for purity. The main risk is power, as furnace output follows electricity cost and hydropower seasonality, so dry spells reprice supply quickly.”
- Nikhil Kaitwade, Principal Consultant, Future Market Insights.
Major Market Trends and Insights
- Solar and Electronics Outgrow Chemicals as Polysilicon Policy Reshapes Sourcing: Solar and electronics buyers pay for tighter impurity specifications and secure supply, while chemical buyers negotiate mainly on tonnage price. FMI projects solar and electronics at a 6.8% CAGR, ahead of chemicals at 4.7%, and grades 3303 and 2202 at 6.3% against 4.6% for grades 441 and 411. Silicones, the largest end use, ease from 36.2% in 2026 to 35.1% by 2036. EY (August 2026) reports that a Section 232 proclamation issued on August 6, 2026 sets a USD 21 per kilogram minimum import price on polysilicon from December 4, 2026, with U.S. output at under 2% of global production in 2024. That floor strengthens the case for domestic polysilicon capacity and, with it, for local silicon metal supply contracts.
- U.S. Trade Remedies Raise Import Costs for Silicon Metal Buyers: Duties on dumped and subsidized imports narrow the gap between foreign offers and domestic mill prices, pushing buyers toward domestic contracts and away from Angolan and Laotian supply. The U.S. Department of Commerce (February 2026) issued final affirmative determinations with antidumping margins of 68.45% for Angola and 94.44% for Laos, plus a countervailing duty rate of 69.10% for Laos. Final determinations for Australia and Norway were scheduled for June 25, 2026. For the USA, FMI projects a 12.0% global share in 2026 and a 3.9% CAGR, though silicone and aluminum alloy buyers absorb higher input costs. Domestic mills gain pricing room only if they hold volume against other import sources and soft downstream demand.
- Weak Realized Prices Squeeze Producer Margins Despite Volume Recovery: Smelters carry high fixed power and labor costs, so a tonnage rebound cannot offset falling prices once import availability caps what buyers will pay. Ferroglobe (August 2026) reported second quarter 2026 silicon metal shipments of 40,818 metric tons, up 33.7% from the first quarter, at an average selling price of USD 2,592 per metric ton, down 11.1% from a year earlier. Shipments still trailed the prior year by 8.5%. Revenue reached USD 105.8 million, yet adjusted EBITDA margin stayed at negative 2.5%. The company cited elevated market availability and cautious customer purchasing, particularly in Europe. FMI’s 5.0% CAGR to 2036 therefore turns into value growth only where suppliers secure price recovery, not volume alone.
What Are the Main Drivers, Restraints, and Opportunities?
Repeat metal purchases by silicone and polysilicon producers anchor volume, while power-intensive smelting, narrow impurity windows and new US duties on Australian and Norwegian metal limit how fast buyers can switch suppliers, which favors smelters that can document lower-carbon reductant sourcing.
Driver: Silicone and Polysilicon Producers Anchoring Repeat Metal Purchases
Silicone intermediates producers and polysilicon refiners buy metal against fixed recipes, so plant utilization, not spot sentiment, sets orders across silicones supply chains. IEA PVPS (April 2026) reports an estimated 698 GW of new PV systems installed worldwide in 2025. That is a downstream indicator, not a measure of silicon metal sales, because refiners buy only after allowing for recovery losses and inventory. Smelters that deliver compliant lots on schedule convert this activity into contracted volume. Suppliers with off-grade or late tonnes are left to the spot market, where margins are thinner.
Restraint: Power-Intensive Smelting, Impurity Windows and US Duty Barriers
Polysilicon refiners qualify few smelters because their impurity windows are narrow, so a trade barrier forces slow re-qualification of new origins, as seen across polysilicon buying. The OECD (February 2026) states that China accounts for 85% of the world’s silicon metal production. The US Department of Commerce (June 2026) set final rates on Australian metal at 6.16% antidumping and 32.57% countervailing, and on Norwegian metal at 2.47% and 17.27%. Orders followed after the US International Trade Commission’s affirmative determination on August 14, 2026. US buyers absorb the duty and the qualification delay.
Opportunity: Verified Biocarbon Sourcing for Lower-Carbon Silicon Metal
Buyers that scrutinize emissions pay for documented low-carbon reductant, which gives smelters with auditable wood charcoal and biocarbon supply a route onto approved supplier lists. Elkem (April 2026) was awarded NOK 87 million by Enova to develop industrial biocarbon, with an ambition to double its share by the end of 2030. Biocarbon is about 25% of carbon use at its Norwegian smelters today. The Australian Government (March 2025) backed Simcoa with AU$39.8 million to replace coal with charcoal, an expected 89% emissions cut. FMI projects polysilicon applications at a 6.8% CAGR and chemical-grade metal at 5.9% through 2036. Neither project proves a carbon advantage on every delivered tonne. Premiums depend on audited plant-level results and stable yields.
How Is the Silicon Metal Market Segmented?
The global silicon metal market is segmented by end use, grade, industry, form, and region, with all volumes standardized to metric tons of silicon metal.
| Segmentation Axis | Sub-Segments Covered | 2026 Leading Segment & Share | Main Growth Benchmark (2026 to 2036) |
|---|---|---|---|
| End Use | Silicones, Aluminum Alloys, Polysilicon for Solar and Semiconductors | Silicones (36.2% revenue share) | Silicones share eases to 35.1% by 2036; Polysilicon for Solar and Semiconductors leads growth at 6.9% CAGR |
| Grade | Grade 441 and 411, Grade 553, Grade 421 and 521, Grade 3303 and 2202 | Grade 441 and 411 (31.1% revenue share) | Grade 3303 and 2202 (6.3% CAGR) vs. Grade 441 and 411 (4.6% CAGR) |
| Industry | Chemicals, Solar and Electronics, Automotive and Transport, Construction | Chemicals (32.7% revenue share) | Solar and Electronics (6.8% CAGR) vs. Chemicals (4.7% CAGR) |
| Form | Lump, Granules, Powder, Fines and Chips | Lump (60.0% revenue share) | Powder leads growth at 6.1% CAGR |
| Region | Asia Pacific, North America, Europe, Latin America, Middle East & Africa | Asia Pacific (64.0% revenue share) | Asia Pacific share rises to 66.5% by 2036 at 5.4% CAGR |
Source: Future Market Insights analysis of the silicon metal market, 2026.
Why Does the Silicones Segment Lead by End Use?
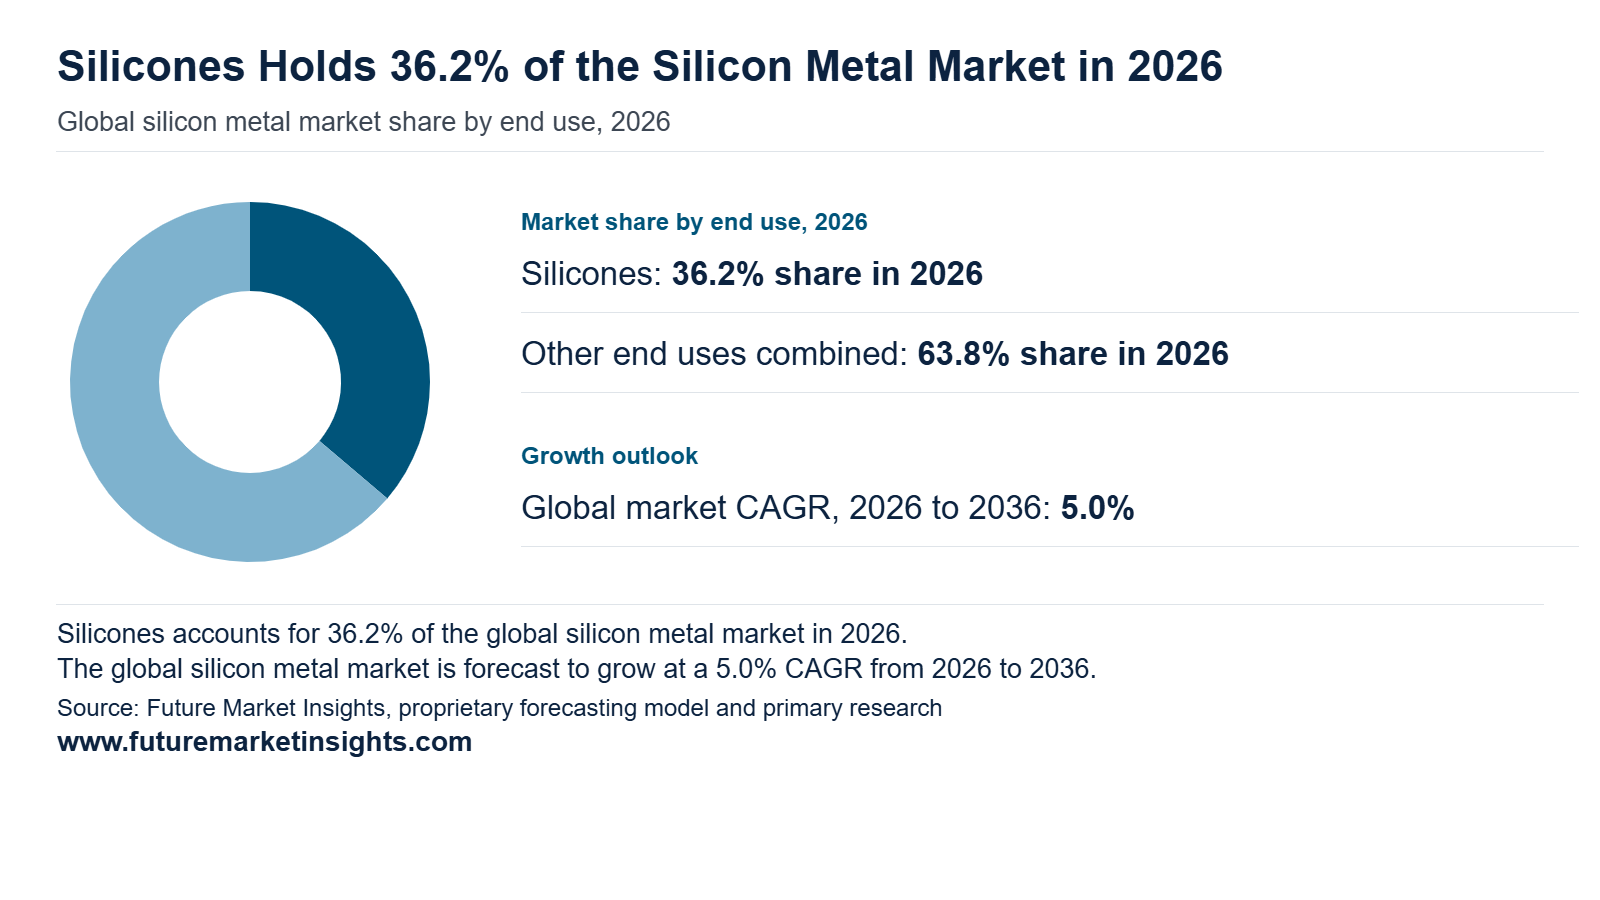
Silicones holds 36.2% of end-use revenue in 2026, easing to 35.1% by 2036 at a 4.7% CAGR. Chlorosilane producers take silicon metal as a reactant and buy on trace-element consistency, because off-specification lots cut yields in conversion plants. Intake is scheduled around operating rates, so approved lots and delivery reliability outrank spot discounts, and volumes follow the economics of silicone demand. Wacker Chemie (Annual Report 2025) lists silicon metal among its five main raw materials. Polysilicon for Solar and Semiconductors grows fastest at 6.9% CAGR, but needs a further purification step.
Why Does the Grade 441 and 411 Segment Lead by Grade?
The US International Trade Commission (December 2025) described four broad grades: semiconductor, chemical, and primary and secondary aluminum metallurgical, and named iron, aluminum and calcium as the small amounts of other elements present. Grade 441 and 411 accounts for 31.1% of grade revenue in 2026, easing to 29.9% by 2036 at a 4.6% CAGR, while Grade 3303 and 2202 grows fastest at 6.3% CAGR. Chemical processors write narrow iron, aluminum and calcium tolerances into purchase specifications, and an established designation shortens supplier screening and repeat inspection. Tighter grades cost more to qualify, so volume stays with the grade buyers already trust, while aluminum alloys recipes buy elsewhere in the range.
Why Does the Chemicals Segment Lead by Industry?
Chemicals represents 32.7% of industry revenue in 2026, easing to 31.8% by 2036 at a 4.7% CAGR, while Solar and Electronics grows fastest at 6.8% CAGR. Chemical plants buy silicon metal as a reactant, so screened batches must match feedstock recipes and arrive continuously, which makes origin consistency and contractual risk allocation central to procurement. Solar and electronics buyers add a purification step before polysilicon, a purchasing cycle separate from chemical demand. Elkem (April 2026) completed the sale of the majority of its Silicones division to Bluestar, splitting upstream silicon supply from downstream conversion.
Why Does the Lump Segment Lead by Form?
The Canada Border Services Agency (December 2024) stated that silicon metal is usually sold in lump form, with chemical-industry lump at 1 by 1 inch and smaller. Powder is the fastest-growing form at 6.1% CAGR. Lump holds 60.0% of form revenue in 2026, easing to 58.9% by 2036 at a 4.8% CAGR. Metal leaves the furnace molten, and casting, crushing and screening give a transportable product that large buyers melt or convert at their own sites, avoiding the handling controls that dust and surface area impose on finer forms. Smaller lump suits chemical conversion, including fumed silica producers.
Silicon Metal Market by Region and Country (2026 to 2036)
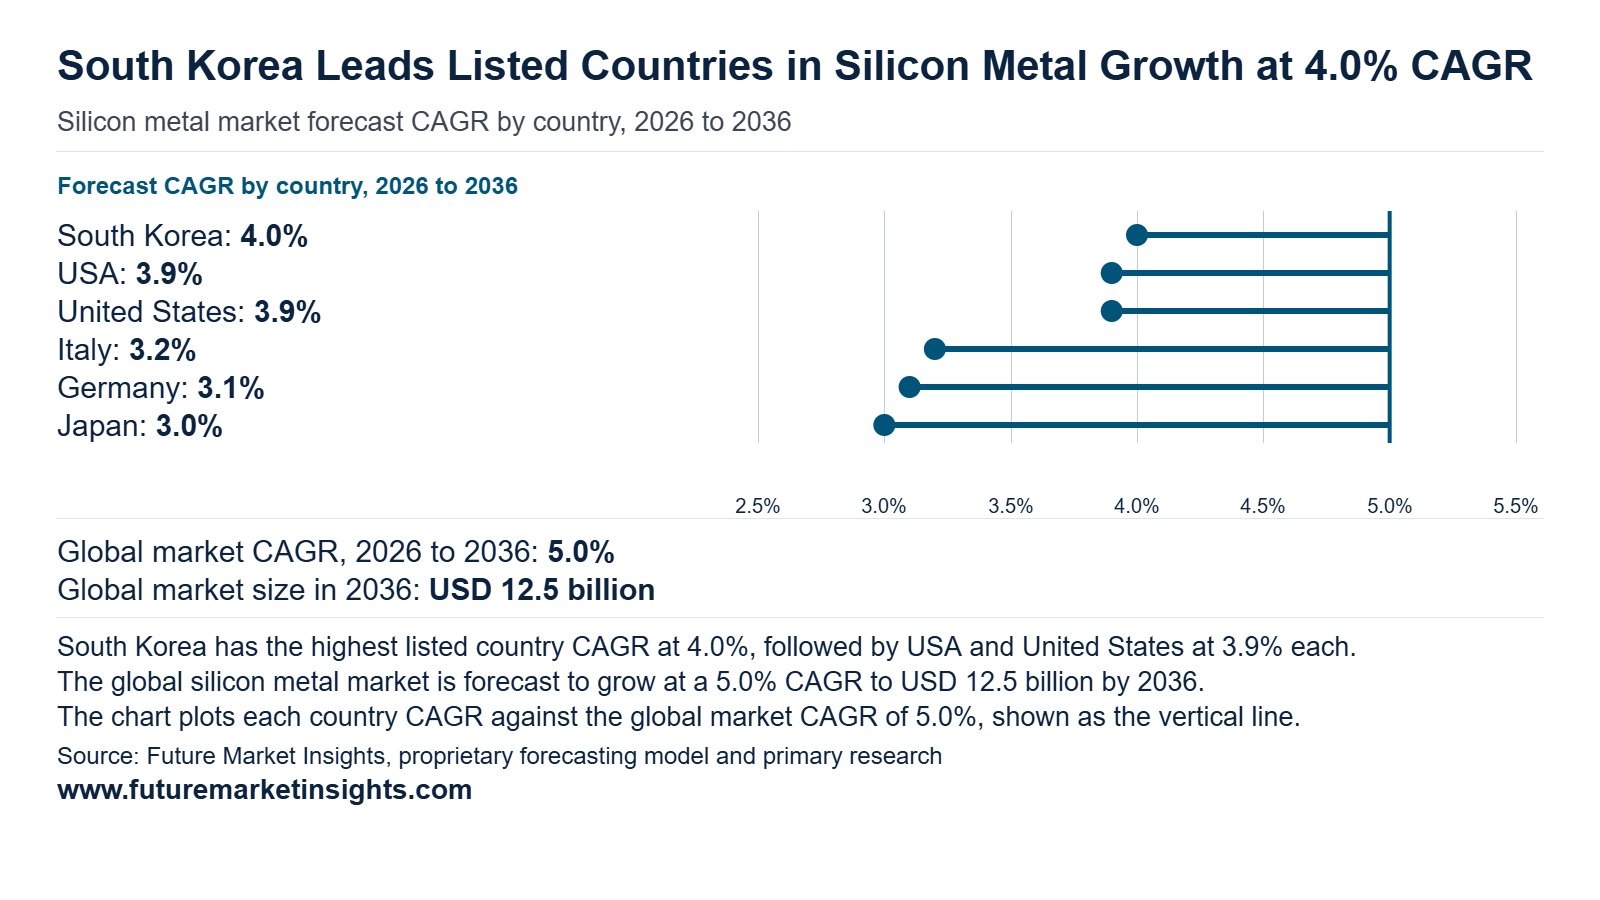
The five tracked countries hold 30.1% of global silicon metal revenue in 2026, so most demand sits outside the tracked set. That untracked share widens from 69.9% to 71.8% by 2036 as the tracked share slips to 28.2%. The United States remains the largest tracked market, easing from 12.0% to 11.7% while adding USD 559 million. Europe’s share falls from 9.3% to 8.4%. The Japan and South Korea cluster is the steadier gainer, rising from USD 880 million to USD 1,223 million, an addition of USD 343 million.
| Country | 2026 Revenue | 2036 Revenue | 10-Year Addition | 2026 to 2036 CAGR | Global Share (2026 → 2036) |
|---|---|---|---|---|---|
| South Korea | USD 300 million | USD 444 million | USD 144 million | 4.0% | 3.0% → 2.9% |
| United States | USD 1,200 million | USD 1,759 million | USD 559 million | 3.9% | 12.0% → 11.7% |
| Italy | USD 280 million | USD 384 million | USD 104 million | 3.2% | 2.8% → 2.5% |
| Germany | USD 650 million | USD 882 million | USD 232 million | 3.1% | 6.5% → 5.8% |
| Japan | USD 580 million | USD 779 million | USD 199 million | 3.0% | 5.8% → 5.2% |
Source: Future Market Insights analysis of the silicon metal market, 2026.
United States
The Commerce Department’s final determinations set antidumping margins of 2.47% for Elkem and 6.16% for Simcoa, with countervailing rates of 17.27% and 32.57% (International Trade Administration, June 2026). The orders apply from August 21, 2026 (Federal Register, August 2026), so importers now carry deposit costs. The United States grows from USD 1,200 million in 2026 to USD 1,759 million in 2036, a 3.9% CAGR and USD 559 million of addition. Its global share eases from 12.0% to 11.7%, and it stays the largest tracked market. Domestic producers have secured trade protection that tightens import supply for silicon metal buyers.
Germany
Germany rises from USD 650 million to USD 882 million, a 3.1% CAGR and USD 232 million of addition, a 1.36-fold expansion. Its share slips from 6.5% to 5.8%, since silicones consumption is mature and tied to industrial output. Silicon metal and methanol underpin more than 2,800 silicone products at WACKER, while the Silicones segment’s sales fell from €2.81 billion to €2.73 billion (WACKER Annual Report 2025). Integrated producers consume much of their own silicon metal, so merchant volumes follow silicones recovery rather than steel or aluminum cycles. That caps Germany’s growth near the group floor.
Japan
The United States applies a 25% Section 232 tariff on aluminum products, and Japan’s 2024 rolled product and foil exports to the US were ¥23.5 billion against imports of ¥27.9 billion (Japan Aluminium Association, March 2025). Lower export prospects for alloy users dampen silicon metal offtake. Buyers therefore favor contract continuity over volume expansion. Japan grows from USD 580 million to USD 779 million, a 3.0% CAGR, the lowest in the group, with USD 199 million of addition and a share decline from 5.8% to 5.2%. Aluminum alloying is a core outlet, and it faces tariff pressure abroad.
South Korea
China’s Ministry of Commerce ruled that anti-dumping duties on solar-grade polysilicon from the United States and Korea continue from January 14, 2026, at 4.4% for OCI and 9.5% for Hankook Silicon (Ministry of Commerce of China, January 2026). Moderate Korean rates preserve market access and sustain feedstock silicon demand. South Korea posts the fastest CAGR at 4.0%, rising from USD 300 million to USD 444 million, a 1.48-fold gain of USD 144 million. Its share edges from 3.0% to 2.9%. Polysilicon and silicones producers anchor demand, and trade remedies shape their export economics.
Italy
Italy grows from USD 280 million to USD 384 million, a 3.2% CAGR and USD 104 million of addition, a 1.37-fold increase. Its share narrows from 2.8% to 2.5%. Steel and chemicals drive consumption, and cost structure limits the pace. In 2024, 90% of Italian steel came from electric arc furnaces using ferrous scrap, and the association reports that Italy has the highest industrial energy costs in Europe (Federacciai, November 2025). Scrap-based steelmakers buy silicon in alloy form, so metal demand grows with output but margins stay thin. Suppliers win on price consistency, not volume.
Competitive Environment and Notable Companies
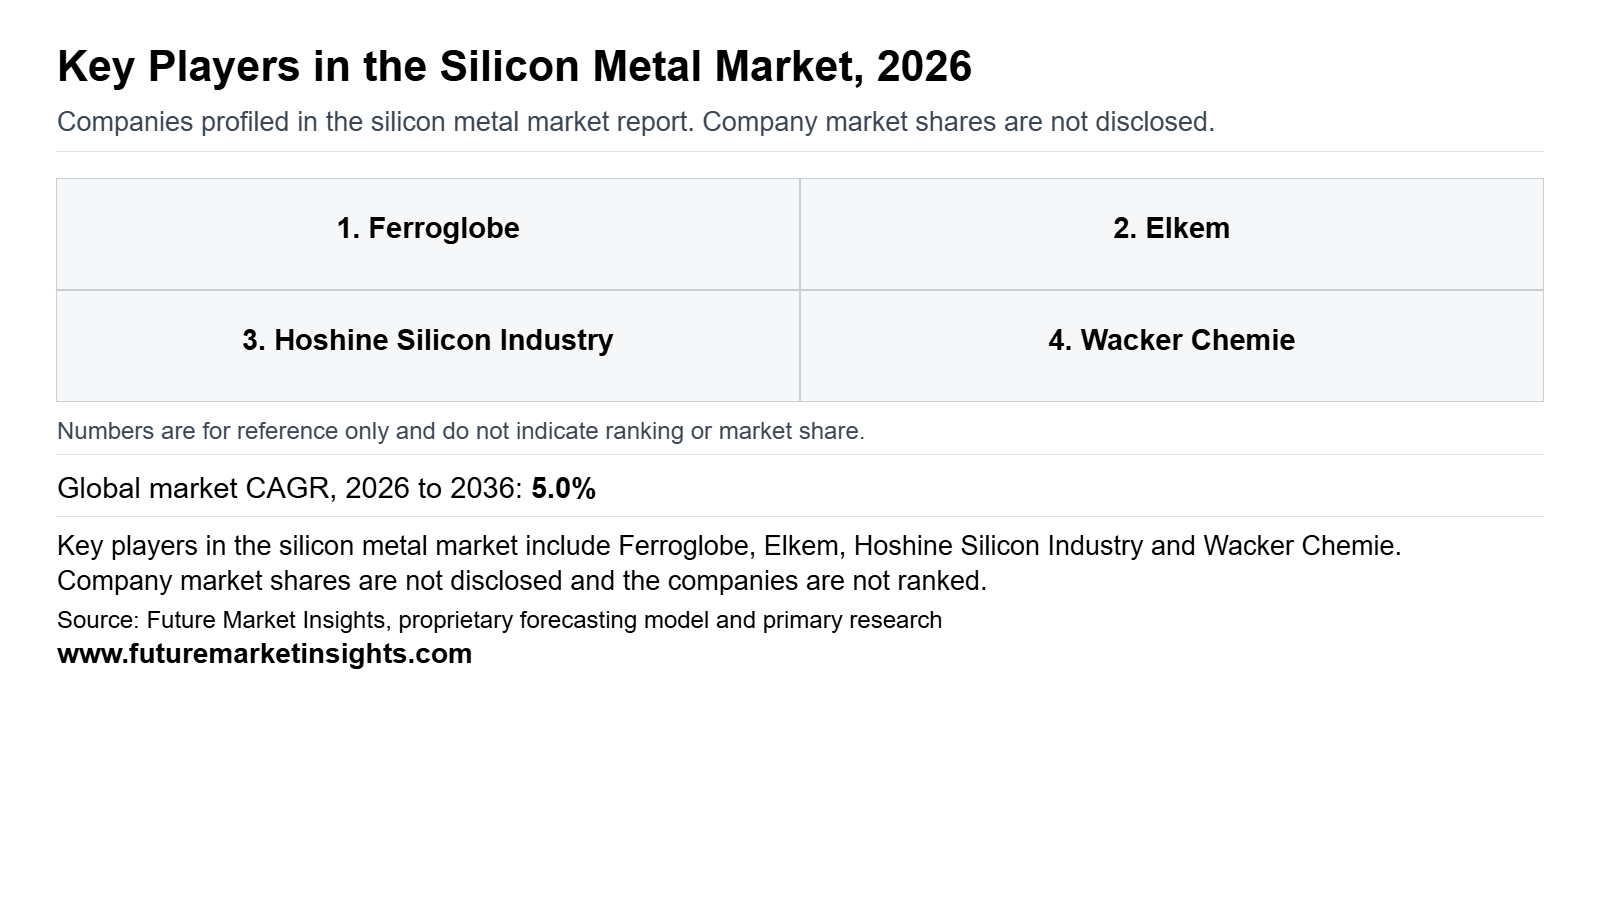
Notable companies operating in the global silicon metal market include Ferroglobe, Elkem, Hoshine Silicon Industry, Wacker Chemie, Rima Industrial, and Simcoa Operations. Competition separates merchant smelting from integrated silicon conversion. Merchant smelters (Ferroglobe, Elkem, Simcoa Operations) compete on grade supply and contract access across several regions. Integrated silicon-to-chemicals and high-purity chains (Hoshine Silicon Industry, Wacker Chemie) use metal as an input to higher-value products, while Rima Industrial pairs Brazilian metallurgy with charcoal and forestry. With US duties now covering Australian and Norwegian metal and the EU reviewing Chinese imports, trade-remedy exposure increasingly shapes who can serve which buyer.
How Are Companies Positioned in the Silicon Metal Market?
Positioning follows how much of the chain a company controls. Ferroglobe shipped 38,173 metric tons of silicon metal in the third quarter of 2026 at an average USD 2,669 per metric ton (Ferroglobe, November 2026). Elkem completed the sale of the majority of its Silicones division to Bluestar on April 30, 2026, redeeming 338,338,536 Bluestar shares (European Rubber Journal, May 2026), and now reports as Elkem Silicon, Foundry Alloys and Carbon (Elkem, July 2026). Hoshine Silicon Industry held 1.22 million metric tons of industrial silicon capacity at end-June 2026 (EnergyTrend, August 2026).
What Matters When a Buyer Selects a Silicon Metal Supplier?
Buyers weigh trade-remedy exposure alongside grade and price. US antidumping orders on silicon metal from Australia and Norway, applicable from August 21, 2026, set cash deposits of 6.16% for Simcoa Operations and 2.47% for Elkem (Federal Register, August 2026), with countervailing rates of 32.57% and 17.27% respectively (Federal Register, August 2026). Simcoa Operations told ABC News it would leave the US market on August 14, 2026 (ABC News, August 2026). Buyers sourcing for US delivery should verify origin and duty status per shipment before agreeing 2027 volumes.
Which Capabilities Distinguish Product Offers?
Offers differ on feedstock control and conversion depth. Hoshine Silicon Industry links industrial silicon to 1.73 million metric tons of organosilicon monomer capacity and 50,000 metric tons of polysilicon, and returned to a first-half 2026 profit of RMB 324 million on higher silicon utilization (EnergyTrend, August 2026). Wacker Chemie's Polysilicon sales rose 3% to EUR 226 million in the second quarter as semiconductor-grade volumes offset weaker solar-grade demand (Wacker Chemie, July 2026). Simcoa Operations is expanding charcoal output at Wellesley to displace coal, backed by an A$39.8 million grant (Australian Manufacturing, March 2025).
How Does Geographic Reach Affect Competition?
Reach is increasingly set by trade policy. The European Commission opened an interim anti-dumping review of Chinese silicon metal on September 1, 2026, with import registration ordered (Ferroglobe, November 2026). Ferroglobe plans to close five plants and raise utilization to about 80% (Ferroglobe, November 2026), concentrating output at its most competitive sites. Simcoa Operations says it will pursue customers in South-East Asia, India and Europe after leaving the US (ABC News, August 2026). Brazil-based Rima Industrial has no independently mapped export reach.
| Verified Company Evidence (2026) | Commercial Effect | Buyer Action |
|---|---|---|
| November 3, 2026: Ferroglobe reported silicon metal shipments of 38,173 metric tons, an average price of USD 2,669 per metric ton and adjusted EBITDA of USD (2.3) million, and announced plans to close five plants, target about 80% utilization and capture USD 85 million to 115 million of run-rate EBITDA benefit (Ferroglobe, November 2026). | Western merchant supply is being consolidated onto fewer sites while silicon metal itself remains loss-making, so supply footprints may shift. | Confirm which plant supplies contracted grades and add continuity clauses to 2027 agreements. |
| August 21, 2026: US antidumping orders on silicon metal from Australia and Norway took effect, with cash deposits of 6.16% (Simcoa Operations) and 2.47% (Elkem), alongside countervailing rates of 32.57% and 17.27% (Federal Register, August 2026). | Raises the landed cost of Australian and Norwegian metal in the US and pushed Simcoa Operations out of that market (ABC News, August 2026). | Re-qualify US supply by origin and request duty-inclusive quotations. |
| April 30, 2026: Elkem completed the sale of the majority of its Silicones division to Bluestar (European Rubber Journal, May 2026). | Narrows Elkem to its metals and materials business; the sale adds no silicon metal capacity. | Check which entity supplies and invoices any silicon sold into silicone chains after the divestment. |
Source: Verified corporate disclosures and Future Market Insights analysis, 2026.
| Company | Core Positioning | Verified Activity & Source Attribution |
|---|---|---|
| Ferroglobe | Merchant silicon metal and silicon-based alloys in Europe, North America and South Africa | Third-quarter 2026 silicon metal revenue of USD 101.9 million with a (2.2)% adjusted EBITDA margin; five-plant closure plan (Ferroglobe, November 2026). |
| Elkem | Merchant silicon producer, now Elkem Silicon, Foundry Alloys and Carbon | Third-quarter 2026 EBITDA of NOK 554 million (NOK 646 million a year earlier); silicon prices rose modestly in the quarter and continued rising in the fourth (Elkem, October 2026). |
| Hoshine Silicon Industry | Integrated industrial silicon, organosilicon and polysilicon in China | First-half 2026 revenue of RMB 10.160 billion, up 3.94%, with net profit of RMB 324 million (EnergyTrend, August 2026). |
| Wacker Chemie | Silicon metal as an input to chemical and polysilicon conversion | Third-quarter 2026 Polysilicon sales of EUR 225 million and EBITDA of EUR 44 million, including about EUR 35 million from a contract termination (chemXplore, October 2026) |
| Rima Industrial | Forestry-linked, charcoal-integrated metallurgy in Brazil | Positioning only: an IFC loan of up to USD 25 million for eucalyptus replanting and charcoal-suited clones, invested in June 2025 (IFC, June 2025). |
| Simcoa Operations | Australia's only silicon manufacturer | Exited the US market on August 14, 2026 after combined antidumping and countervailing duties of about 40% (ABC News, August 2026). |
Source: Verified corporate disclosures and Future Market Insights analysis, 2026.
Silicon Metal Market Report Scope and Research Methodology
FMI sizes the global silicon metal market from the revenue earned on metallurgical silicon metal sold into silicones, aluminum alloys, and polysilicon for solar and semiconductors, cross-checked against wider national ferroalloy and metallurgical silicon industry totals. Sales to the chemical, solar and electronics, automotive and transport, and construction industries anchor the model because they account for the majority of global revenue. Revenue is counted only for separately identifiable silicon metal value, with finished silicones, polysilicon, solar cells, wafers, semiconductors, and aluminum-alloy finished goods excluded so that downstream conversion value is not double counted. Primary interviews with smelters, distributors, end users, and procurement teams are combined with desk research on trade data, regulatory publications, standards, and company filings. Lump, granule, powder, and fines and chips sales are reconciled so that segment and national figures sum to the global market total in every year. Company disclosures are used strictly to verify product positioning, grades, and production footprints rather than to estimate proprietary company revenues.
| Coverage Field | Report Scope |
|---|---|
| Market definition | Revenue from sales of metallurgical silicon metal within the covered end-use, grade, industry, and form categories. |
| End uses | Silicones, aluminum alloys, and polysilicon for solar and semiconductors. |
| Grades | Grade 441 and 411, grade 553, grade 421 and 521, and grade 3303 and 2202. |
| Industries | Chemicals, solar and electronics, automotive and transport, and construction. |
| Forms | Lump, granules, powder, and fines and chips. |
| Exclusions | Finished silicones, polysilicon, solar cells, wafers, semiconductors, aluminum-alloy finished goods, other ferroalloys, substitute materials, and downstream processing and service revenue. |
| Quantitative units | USD billion for value. |
| Value basis | Revenue from sales of separately identifiable silicon metal to buyers in each country. |
| Regions covered | North America, Latin America, Western Europe, Eastern Europe, East Asia, South Asia and Pacific, and Middle East and Africa. |
| National coverage | USA, China, Japan, Germany, India, South Korea, and Italy. |
| Companies covered | Ferroglobe, Elkem, Hoshine Silicon Industry, Wacker Chemie, Rima Industrial, and Simcoa Operations. |
| Forecast period | 2026 to 2036. |
| Approach | Primary and secondary research with market triangulation, followed by data validation against independent indicators to avoid double counting. |
Source: Future Market Insights analysis of the silicon metal market, 2026.
Research Sources and Bibliography
- Australian Government, Net Zero Economy Authority (March 2025). Coal-free silicon production in Australia. https://www.nzea.gov.au/coal-free-silicon-production-australia
- Australian Manufacturing (March 2025). Australian silicon industry gets $39.8M boost for cleaner manufacturing. https://www.australianmanufacturing.com.au/australian-silicon-industry-gets-39-8m-boost-for-cleaner-manufacturing/
- Canada Border Services Agency (December 2024). Statement of reasons, expiry review determination: Silicon Metal (SM 2024 ER). https://www.cbsa-asfc.gc.ca/sima-lmsi/er-rre/sm2024/sm2024-de-eng.html
- chemXplore (October 2026). WACKER Q3: Sales up 9% and EBITDA nearly doubles to €217 million. https://chemxplore.com/news/wacker-q3-earnings-increase
- Elkem (April 2026). Elkem awarded NOK 87 million by Enova to enable scale-up of biocarbon in silicon production. https://live.euronext.com/en/products/equities/company-news/2026-04-28-elkem-awarded-nok-87-million-enova-enable-scale-biocarbon
- Elkem (July 2026). Second quarter 2026 - Driving cost improvements and deleveraging. https://www.inderes.se/en/releases/second-quarter-2026-driving-cost-improvements-and-deleveraging-1
- Elkem (October 2026). Third quarter 2026 - Robust financial performance amid challenging markets. https://www.inderes.dk/en/releases/third-quarter-2026-robust-financial-performance-amid-challenging-markets
- EnergyTrend (August 2026). Hoshine Silicon: H1 revenue exceeds RMB 10 billion, turning a profit. https://www.energytrend.com/print/52025
- European Rubber Journal (May 2026). Norwegian group becomes “pure play” metals producer as 338 million shares redeemed. https://www.european-rubber-journal.com/article/2099145/elkem-completes-silicones-sale-to-bluestar
- EY (August 2026). US Section 232 proclamation establishes minimum import prices and a 15% tariff on polysilicon and derivative products. https://taxnews.ey.com/news/2026-1695-us-section-232-proclamation-establishes-minimum-import-prices-and-a-15-percent-tariff-on-polysilicon-and-derivative-products
- Federal Register (August 2026). Silicon Metal from Australia and Norway: Antidumping Duty Orders (2026-17050). https://www.govinfo.gov/content/pkg/FR-2026-08-21/html/2026-17050.htm
- Federal Register (August 2026). Silicon Metal from Australia and Norway: Countervailing Duty Orders (2026-17049). https://www.govinfo.gov/content/pkg/FR-2026-08-21/html/2026-17049.htm
- Ferroglobe (August 2026). Ferroglobe Reports Second Quarter 2026 Financial Results. https://ferroglobe.gcs-web.com/node/13461
- Ferroglobe (November 2026). Ferroglobe reports third quarter 2026 financial results and announces actions to improve profitability. https://finviz.com/news/414947/ferroglobe-reports-third-quarter-2026-financial-results-and-announces-actions-to-improve-profitability
- IFC (June 2025). Rima Forestry, Project 50020. https://disclosures.ifc.org/project-detail/SII/50020/rima-forestry
- International Energy Agency Photovoltaic Power Systems Programme (April 2026). Snapshot of Global PV Markets 2026. https://iea-pvps.org/snapshot-reports/snapshot-2026/
- Organisation for Economic Co-operation and Development (February 2026). Due Diligence for Responsible Sand and Silicate Supply Chains. https://www.oecd.org/en/publications/due-diligence-for-responsible-sand-and-silicate-supply-chains_7be0093e-en.html
- US Department of Commerce, International Trade Administration (June 2026). Final Affirmative Determination in the Antidumping and Countervailing Duty Investigations of Silicon Metal from Australia and Norway. https://www.trade.gov/final-affirmative-determination-antidumping-and-countervailing-duty-investigations-silicon-metal
- US Department of Commerce, International Trade Administration (February 2026). Final Affirmative Determinations in the Antidumping and Countervailing Duty Investigations of Silicon Metal from Angola, the Lao People’s Democratic Republic and Thailand. https://www.trade.gov/final-affirmative-determinations-antidumping-and-countervailing-duty-investigations-silicon-metal
- US International Trade Commission (December 2025). Silicon Metal from Russia, Investigation No. 731-TA-991 (Fourth Review), USITC Publication 5965. https://www.usitc.gov/publications/701_731/pub5965.pdf
- Wacker Chemie (2025). Annual Report 2025: ESRS E5 Resource use and circular economy, Metrics. https://reports.wacker.com/2025/annual-report/management-report/sustainability-report/esrs-e5-resource-use-and-circular-economy/metrics.html
- Wacker Chemie (July 2026). WACKER raises full-year forecast after second quarter 2026. https://www.wacker.com/cms/en-au/press-and-media/press/press-releases/2026/press-releases-detail-2026-315650.html
Table of Content
- Key Takeaways
- Market Size and CAGR
- Top Growth Driver
- Fastest Growing Segment
- Leading Region
- Key Companies
- Emerging Opportunities
- Executive Summary
- Global Market Outlook
- Demand-side Trends
- Supply-side Trends
- Technology Roadmap Analysis
- Analysis and Recommendations
- Analyst Perspective (What is happening? Why now? What should investors know?)
- Key Questions Answered
- How large is the market?
- What is the CAGR?
- What are key trends?
- Which region dominates?
- Who are the leaders?
Read More...
- Market Overview
- Market Coverage / Taxonomy
- Market Definition / Scope / Limitations
- Research Methodology
- Chapter Orientation
- Analytical Lens and Working Hypotheses
- Market Structure, Signals, and Trend Drivers
- Benchmarking and Cross-market Comparability
- Market Sizing, Forecasting, and Opportunity Mapping
- Research Design and Evidence Framework
- Desk Research Programme (Secondary Evidence)
- Expert Input and Fieldwork (Primary Evidence)
- Tooling, Models, and Reference Databases
- Data Engineering and Model Build
- Quality Assurance and Audit Trail
- Market Background
- Market Dynamics (Drivers, Restraints, Opportunity, Trends)
- Scenario Forecast (Optimistic, Likely, Conservative)
- Impact Analysis
- AI Impact
- Sustainability Impact
- Regulatory Impact
- Technology Impact
- Consumer / Buyer Analysis
- Purchase Drivers
- Adoption Barriers
- Buyer Journey
- Opportunity Map Analysis
- Product Life Cycle Analysis
- Supply Chain Analysis
- Investment Feasibility Matrix
- Value Chain Analysis
- PESTLE and Porter's Analysis
- Regulatory Landscape
- Regional Parent Market Outlook
- Production and Consumption Statistics
- Import and Export Statistics
- Global Market Analysis and Forecast, 2021 to 2036
- Historical Market Size Value (USD Million) Analysis, 2021 to 2025
- Current and Future Market Size Value (USD Million) Projections, 2026 to 2036
- Y-o-Y Growth Trend Analysis
- Absolute $ Opportunity Analysis
- Global Market Pricing Analysis, 2021 to 2036
- Global Market Analysis and Forecast, By End Use, 2021 to 2036
- Introduction / Key Findings
- Historical Market Size Value (USD Million) Analysis By End Use, 2021 to 2025
- Current and Future Market Size Value (USD Million) Analysis and Forecast By End Use, 2026 to 2036
- Silicones
- Aluminium Alloys
- Polysilicon for Solar and Semiconductors
- Y-o-Y Growth Trend Analysis By End Use, 2021 to 2025
- Absolute $ Opportunity Analysis By End Use, 2026 to 2036
- Global Market Analysis and Forecast, By Grade, 2021 to 2036
- Introduction / Key Findings
- Historical Market Size Value (USD Million) Analysis By Grade, 2021 to 2025
- Current and Future Market Size Value (USD Million) Analysis and Forecast By Grade, 2026 to 2036
- Grade 441 and 411
- Grade 553
- Grade 421 and 521
- Grade 3303 and 2202
- Y-o-Y Growth Trend Analysis By Grade, 2021 to 2025
- Absolute $ Opportunity Analysis By Grade, 2026 to 2036
- Global Market Analysis and Forecast, By Industry, 2021 to 2036
- Introduction / Key Findings
- Historical Market Size Value (USD Million) Analysis By Industry, 2021 to 2025
- Current and Future Market Size Value (USD Million) Analysis and Forecast By Industry, 2026 to 2036
- Chemicals
- Solar and Electronics
- Automotive and Transport
- Construction
- Y-o-Y Growth Trend Analysis By Industry, 2021 to 2025
- Absolute $ Opportunity Analysis By Industry, 2026 to 2036
- Global Market Analysis and Forecast, By Form, 2021 to 2036
- Introduction / Key Findings
- Historical Market Size Value (USD Million) Analysis By Form, 2021 to 2025
- Current and Future Market Size Value (USD Million) Analysis and Forecast By Form, 2026 to 2036
- Lump
- Granules
- Powder
- Fines and Chips
- Y-o-Y Growth Trend Analysis By Form, 2021 to 2025
- Absolute $ Opportunity Analysis By Form, 2026 to 2036
- Global Market Analysis and Forecast, By Region, 2021 to 2036
- Introduction
- Historical Market Size Value (USD Million) Analysis By Region, 2021 to 2025
- Current Market Size Value (USD Million) Analysis and Forecast By Region, 2026 to 2036
- North America
- Latin America
- Western Europe
- Eastern Europe
- East Asia
- South Asia and Pacific
- Middle East and Africa
- Market Attractiveness Analysis By Region
- North America Market Analysis and Forecast, By Country, 2021 to 2036
- Historical Market Size Value (USD Million) Trend Analysis By Market Taxonomy, 2021 to 2025
- Market Size Value (USD Million) Forecast By Market Taxonomy, 2026 to 2036
- By Country
- United States
- Canada
- By End Use
- By Grade
- By Industry
- By Form
- By Country
- Market Attractiveness Analysis
- By Country
- By End Use
- By Grade
- By Industry
- By Form
- Key Takeaways
- Latin America Market Analysis and Forecast, By Country, 2021 to 2036
- Historical Market Size Value (USD Million) Trend Analysis By Market Taxonomy, 2021 to 2025
- Market Size Value (USD Million) Forecast By Market Taxonomy, 2026 to 2036
- By Country
- Brazil
- Mexico
- Argentina
- Chile
- By End Use
- By Grade
- By Industry
- By Form
- By Country
- Market Attractiveness Analysis
- By Country
- By End Use
- By Grade
- By Industry
- By Form
- Key Takeaways
- Western Europe Market Analysis and Forecast, By Country, 2021 to 2036
- Historical Market Size Value (USD Million) Trend Analysis By Market Taxonomy, 2021 to 2025
- Market Size Value (USD Million) Forecast By Market Taxonomy, 2026 to 2036
- By Country
- Germany
- France
- United Kingdom
- Italy
- Spain
- Benelux
- Nordics
- By End Use
- By Grade
- By Industry
- By Form
- By Country
- Market Attractiveness Analysis
- By Country
- By End Use
- By Grade
- By Industry
- By Form
- Key Takeaways
- Eastern Europe Market Analysis and Forecast, By Country, 2021 to 2036
- Historical Market Size Value (USD Million) Trend Analysis By Market Taxonomy, 2021 to 2025
- Market Size Value (USD Million) Forecast By Market Taxonomy, 2026 to 2036
- By Country
- Poland
- Czech Republic
- Romania
- Hungary
- By End Use
- By Grade
- By Industry
- By Form
- By Country
- Market Attractiveness Analysis
- By Country
- By End Use
- By Grade
- By Industry
- By Form
- Key Takeaways
- East Asia Market Analysis and Forecast, By Country, 2021 to 2036
- Historical Market Size Value (USD Million) Trend Analysis By Market Taxonomy, 2021 to 2025
- Market Size Value (USD Million) Forecast By Market Taxonomy, 2026 to 2036
- By Country
- China
- Japan
- South Korea
- By End Use
- By Grade
- By Industry
- By Form
- By Country
- Market Attractiveness Analysis
- By Country
- By End Use
- By Grade
- By Industry
- By Form
- Key Takeaways
- South Asia and Pacific Market Analysis and Forecast, By Country, 2021 to 2036
- Historical Market Size Value (USD Million) Trend Analysis By Market Taxonomy, 2021 to 2025
- Market Size Value (USD Million) Forecast By Market Taxonomy, 2026 to 2036
- By Country
- India
- ASEAN
- Australia and New Zealand
- By End Use
- By Grade
- By Industry
- By Form
- By Country
- Market Attractiveness Analysis
- By Country
- By End Use
- By Grade
- By Industry
- By Form
- Key Takeaways
- Middle East and Africa Market Analysis and Forecast, By Country, 2021 to 2036
- Historical Market Size Value (USD Million) Trend Analysis By Market Taxonomy, 2021 to 2025
- Market Size Value (USD Million) Forecast By Market Taxonomy, 2026 to 2036
- By Country
- GCC Countries
- South Africa
- Türkiye
- Israel
- By End Use
- By Grade
- By Industry
- By Form
- By Country
- Market Attractiveness Analysis
- By Country
- By End Use
- By Grade
- By Industry
- By Form
- Key Takeaways
- Key Countries Market Analysis
- United States
- Pricing Analysis
- Market Share Analysis, 2025
- By End Use
- By Grade
- By Industry
- By Form
- Canada
- Pricing Analysis
- Market Share Analysis, 2025
- By End Use
- By Grade
- By Industry
- By Form
- Brazil
- Pricing Analysis
- Market Share Analysis, 2025
- By End Use
- By Grade
- By Industry
- By Form
- Mexico
- Pricing Analysis
- Market Share Analysis, 2025
- By End Use
- By Grade
- By Industry
- By Form
- Argentina
- Pricing Analysis
- Market Share Analysis, 2025
- By End Use
- By Grade
- By Industry
- By Form
- Chile
- Pricing Analysis
- Market Share Analysis, 2025
- By End Use
- By Grade
- By Industry
- By Form
- Germany
- Pricing Analysis
- Market Share Analysis, 2025
- By End Use
- By Grade
- By Industry
- By Form
- France
- Pricing Analysis
- Market Share Analysis, 2025
- By End Use
- By Grade
- By Industry
- By Form
- United Kingdom
- Pricing Analysis
- Market Share Analysis, 2025
- By End Use
- By Grade
- By Industry
- By Form
- Italy
- Pricing Analysis
- Market Share Analysis, 2025
- By End Use
- By Grade
- By Industry
- By Form
- Spain
- Pricing Analysis
- Market Share Analysis, 2025
- By End Use
- By Grade
- By Industry
- By Form
- Benelux
- Pricing Analysis
- Market Share Analysis, 2025
- By End Use
- By Grade
- By Industry
- By Form
- Nordics
- Pricing Analysis
- Market Share Analysis, 2025
- By End Use
- By Grade
- By Industry
- By Form
- Poland
- Pricing Analysis
- Market Share Analysis, 2025
- By End Use
- By Grade
- By Industry
- By Form
- Czech Republic
- Pricing Analysis
- Market Share Analysis, 2025
- By End Use
- By Grade
- By Industry
- By Form
- Romania
- Pricing Analysis
- Market Share Analysis, 2025
- By End Use
- By Grade
- By Industry
- By Form
- Hungary
- Pricing Analysis
- Market Share Analysis, 2025
- By End Use
- By Grade
- By Industry
- By Form
- China
- Pricing Analysis
- Market Share Analysis, 2025
- By End Use
- By Grade
- By Industry
- By Form
- Japan
- Pricing Analysis
- Market Share Analysis, 2025
- By End Use
- By Grade
- By Industry
- By Form
- South Korea
- Pricing Analysis
- Market Share Analysis, 2025
- By End Use
- By Grade
- By Industry
- By Form
- India
- Pricing Analysis
- Market Share Analysis, 2025
- By End Use
- By Grade
- By Industry
- By Form
- ASEAN
- Pricing Analysis
- Market Share Analysis, 2025
- By End Use
- By Grade
- By Industry
- By Form
- Australia and New Zealand
- Pricing Analysis
- Market Share Analysis, 2025
- By End Use
- By Grade
- By Industry
- By Form
- GCC Countries
- Pricing Analysis
- Market Share Analysis, 2025
- By End Use
- By Grade
- By Industry
- By Form
- South Africa
- Pricing Analysis
- Market Share Analysis, 2025
- By End Use
- By Grade
- By Industry
- By Form
- Türkiye
- Pricing Analysis
- Market Share Analysis, 2025
- By End Use
- By Grade
- By Industry
- By Form
- Israel
- Pricing Analysis
- Market Share Analysis, 2025
- By End Use
- By Grade
- By Industry
- By Form
- United States
- Market Structure Analysis
- Competition Dashboard
- Competition Benchmarking
- Market Share Analysis of Top Players
- By Region
- By End Use
- By Grade
- By Industry
- By Form
- Emerging Startups
- Innovation Benchmarking
- Competition Analysis
- Competition Deep Dive
- Ferroglobe
- Overview
- Product Portfolio
- Profitability by Market Segments
- Sales Footprint
- Strategy Overview
- Marketing Strategy
- Product Strategy
- Channel Strategy
- Elkem
- Simcoa Operations
- Hoshine Silicon Industry
- Wacker Chemie
- Rima Industrial
- Ferroglobe
- Case Studies
- Success Stories
- Recent Developments
- Competition Deep Dive
- Assumptions & Acronyms Used
List of Tables
- Table 1: Global Market Value (USD Million) Forecast by Region, 2021 to 2036
- Table 2: Global Market Value (USD Million) Forecast by End Use, 2021 to 2036
- Table 3: Global Market Value (USD Million) Forecast by Grade, 2021 to 2036
- Table 4: Global Market Value (USD Million) Forecast by Industry, 2021 to 2036
- Table 5: Global Market Value (USD Million) Forecast by Form, 2021 to 2036
- Table 6: North America Market Value (USD Million) Forecast by Country, 2021 to 2036
- Table 7: North America Market Value (USD Million) Forecast by End Use, 2021 to 2036
- Table 8: North America Market Value (USD Million) Forecast by Grade, 2021 to 2036
- Table 9: North America Market Value (USD Million) Forecast by Industry, 2021 to 2036
- Table 10: North America Market Value (USD Million) Forecast by Form, 2021 to 2036
- Table 11: Latin America Market Value (USD Million) Forecast by Country, 2021 to 2036
- Table 12: Latin America Market Value (USD Million) Forecast by End Use, 2021 to 2036
- Table 13: Latin America Market Value (USD Million) Forecast by Grade, 2021 to 2036
- Table 14: Latin America Market Value (USD Million) Forecast by Industry, 2021 to 2036
- Table 15: Latin America Market Value (USD Million) Forecast by Form, 2021 to 2036
- Table 16: Western Europe Market Value (USD Million) Forecast by Country, 2021 to 2036
- Table 17: Western Europe Market Value (USD Million) Forecast by End Use, 2021 to 2036
- Table 18: Western Europe Market Value (USD Million) Forecast by Grade, 2021 to 2036
- Table 19: Western Europe Market Value (USD Million) Forecast by Industry, 2021 to 2036
- Table 20: Western Europe Market Value (USD Million) Forecast by Form, 2021 to 2036
- Table 21: Eastern Europe Market Value (USD Million) Forecast by Country, 2021 to 2036
- Table 22: Eastern Europe Market Value (USD Million) Forecast by End Use, 2021 to 2036
- Table 23: Eastern Europe Market Value (USD Million) Forecast by Grade, 2021 to 2036
- Table 24: Eastern Europe Market Value (USD Million) Forecast by Industry, 2021 to 2036
- Table 25: Eastern Europe Market Value (USD Million) Forecast by Form, 2021 to 2036
- Table 26: East Asia Market Value (USD Million) Forecast by Country, 2021 to 2036
- Table 27: East Asia Market Value (USD Million) Forecast by End Use, 2021 to 2036
- Table 28: East Asia Market Value (USD Million) Forecast by Grade, 2021 to 2036
- Table 29: East Asia Market Value (USD Million) Forecast by Industry, 2021 to 2036
- Table 30: East Asia Market Value (USD Million) Forecast by Form, 2021 to 2036
- Table 31: South Asia and Pacific Market Value (USD Million) Forecast by Country, 2021 to 2036
- Table 32: South Asia and Pacific Market Value (USD Million) Forecast by End Use, 2021 to 2036
- Table 33: South Asia and Pacific Market Value (USD Million) Forecast by Grade, 2021 to 2036
- Table 34: South Asia and Pacific Market Value (USD Million) Forecast by Industry, 2021 to 2036
- Table 35: South Asia and Pacific Market Value (USD Million) Forecast by Form, 2021 to 2036
- Table 36: Middle East and Africa Market Value (USD Million) Forecast by Country, 2021 to 2036
- Table 37: Middle East and Africa Market Value (USD Million) Forecast by End Use, 2021 to 2036
- Table 38: Middle East and Africa Market Value (USD Million) Forecast by Grade, 2021 to 2036
- Table 39: Middle East and Africa Market Value (USD Million) Forecast by Industry, 2021 to 2036
- Table 40: Middle East and Africa Market Value (USD Million) Forecast by Form, 2021 to 2036
List of Figures
- Figure 1: Global Market Pricing Analysis
- Figure 2: Global Market Value (USD Million) Forecast 2021-2036
- Figure 3: Global Market Value Share and BPS Analysis by End Use, 2026 and 2036
- Figure 4: Global Market Y-o-Y Growth Comparison by End Use, 2026-2036
- Figure 5: Global Market Attractiveness Analysis by End Use
- Figure 6: Global Market Value Share and BPS Analysis by Grade, 2026 and 2036
- Figure 7: Global Market Y-o-Y Growth Comparison by Grade, 2026-2036
- Figure 8: Global Market Attractiveness Analysis by Grade
- Figure 9: Global Market Value Share and BPS Analysis by Industry, 2026 and 2036
- Figure 10: Global Market Y-o-Y Growth Comparison by Industry, 2026-2036
- Figure 11: Global Market Attractiveness Analysis by Industry
- Figure 12: Global Market Value Share and BPS Analysis by Form, 2026 and 2036
- Figure 13: Global Market Y-o-Y Growth Comparison by Form, 2026-2036
- Figure 14: Global Market Attractiveness Analysis by Form
- Figure 15: Global Market Value (USD Million) Share and BPS Analysis by Region, 2026 and 2036
- Figure 16: Global Market Y-o-Y Growth Comparison by Region, 2026-2036
- Figure 17: Global Market Attractiveness Analysis by Region
- Figure 18: North America Market Incremental Dollar Opportunity, 2026-2036
- Figure 19: Latin America Market Incremental Dollar Opportunity, 2026-2036
- Figure 20: Western Europe Market Incremental Dollar Opportunity, 2026-2036
- Figure 21: Eastern Europe Market Incremental Dollar Opportunity, 2026-2036
- Figure 22: East Asia Market Incremental Dollar Opportunity, 2026-2036
- Figure 23: South Asia and Pacific Market Incremental Dollar Opportunity, 2026-2036
- Figure 24: Middle East and Africa Market Incremental Dollar Opportunity, 2026-2036
- Figure 25: North America Market Value Share and BPS Analysis by Country, 2026 and 2036
- Figure 26: North America Market Value Share and BPS Analysis by End Use, 2026 and 2036
- Figure 27: North America Market Y-o-Y Growth Comparison by End Use, 2026-2036
- Figure 28: North America Market Attractiveness Analysis by End Use
- Figure 29: North America Market Value Share and BPS Analysis by Grade, 2026 and 2036
- Figure 30: North America Market Y-o-Y Growth Comparison by Grade, 2026-2036
- Figure 31: North America Market Attractiveness Analysis by Grade
- Figure 32: North America Market Value Share and BPS Analysis by Industry, 2026 and 2036
- Figure 33: North America Market Y-o-Y Growth Comparison by Industry, 2026-2036
- Figure 34: North America Market Attractiveness Analysis by Industry
- Figure 35: North America Market Value Share and BPS Analysis by Form, 2026 and 2036
- Figure 36: North America Market Y-o-Y Growth Comparison by Form, 2026-2036
- Figure 37: North America Market Attractiveness Analysis by Form
- Figure 38: Latin America Market Value Share and BPS Analysis by Country, 2026 and 2036
- Figure 39: Latin America Market Value Share and BPS Analysis by End Use, 2026 and 2036
- Figure 40: Latin America Market Y-o-Y Growth Comparison by End Use, 2026-2036
- Figure 41: Latin America Market Attractiveness Analysis by End Use
- Figure 42: Latin America Market Value Share and BPS Analysis by Grade, 2026 and 2036
- Figure 43: Latin America Market Y-o-Y Growth Comparison by Grade, 2026-2036
- Figure 44: Latin America Market Attractiveness Analysis by Grade
- Figure 45: Latin America Market Value Share and BPS Analysis by Industry, 2026 and 2036
- Figure 46: Latin America Market Y-o-Y Growth Comparison by Industry, 2026-2036
- Figure 47: Latin America Market Attractiveness Analysis by Industry
- Figure 48: Latin America Market Value Share and BPS Analysis by Form, 2026 and 2036
- Figure 49: Latin America Market Y-o-Y Growth Comparison by Form, 2026-2036
- Figure 50: Latin America Market Attractiveness Analysis by Form
- Figure 51: Western Europe Market Value Share and BPS Analysis by Country, 2026 and 2036
- Figure 52: Western Europe Market Value Share and BPS Analysis by End Use, 2026 and 2036
- Figure 53: Western Europe Market Y-o-Y Growth Comparison by End Use, 2026-2036
- Figure 54: Western Europe Market Attractiveness Analysis by End Use
- Figure 55: Western Europe Market Value Share and BPS Analysis by Grade, 2026 and 2036
- Figure 56: Western Europe Market Y-o-Y Growth Comparison by Grade, 2026-2036
- Figure 57: Western Europe Market Attractiveness Analysis by Grade
- Figure 58: Western Europe Market Value Share and BPS Analysis by Industry, 2026 and 2036
- Figure 59: Western Europe Market Y-o-Y Growth Comparison by Industry, 2026-2036
- Figure 60: Western Europe Market Attractiveness Analysis by Industry
- Figure 61: Western Europe Market Value Share and BPS Analysis by Form, 2026 and 2036
- Figure 62: Western Europe Market Y-o-Y Growth Comparison by Form, 2026-2036
- Figure 63: Western Europe Market Attractiveness Analysis by Form
- Figure 64: Eastern Europe Market Value Share and BPS Analysis by Country, 2026 and 2036
- Figure 65: Eastern Europe Market Value Share and BPS Analysis by End Use, 2026 and 2036
- Figure 66: Eastern Europe Market Y-o-Y Growth Comparison by End Use, 2026-2036
- Figure 67: Eastern Europe Market Attractiveness Analysis by End Use
- Figure 68: Eastern Europe Market Value Share and BPS Analysis by Grade, 2026 and 2036
- Figure 69: Eastern Europe Market Y-o-Y Growth Comparison by Grade, 2026-2036
- Figure 70: Eastern Europe Market Attractiveness Analysis by Grade
- Figure 71: Eastern Europe Market Value Share and BPS Analysis by Industry, 2026 and 2036
- Figure 72: Eastern Europe Market Y-o-Y Growth Comparison by Industry, 2026-2036
- Figure 73: Eastern Europe Market Attractiveness Analysis by Industry
- Figure 74: Eastern Europe Market Value Share and BPS Analysis by Form, 2026 and 2036
- Figure 75: Eastern Europe Market Y-o-Y Growth Comparison by Form, 2026-2036
- Figure 76: Eastern Europe Market Attractiveness Analysis by Form
- Figure 77: East Asia Market Value Share and BPS Analysis by Country, 2026 and 2036
- Figure 78: East Asia Market Value Share and BPS Analysis by End Use, 2026 and 2036
- Figure 79: East Asia Market Y-o-Y Growth Comparison by End Use, 2026-2036
- Figure 80: East Asia Market Attractiveness Analysis by End Use
- Figure 81: East Asia Market Value Share and BPS Analysis by Grade, 2026 and 2036
- Figure 82: East Asia Market Y-o-Y Growth Comparison by Grade, 2026-2036
- Figure 83: East Asia Market Attractiveness Analysis by Grade
- Figure 84: East Asia Market Value Share and BPS Analysis by Industry, 2026 and 2036
- Figure 85: East Asia Market Y-o-Y Growth Comparison by Industry, 2026-2036
- Figure 86: East Asia Market Attractiveness Analysis by Industry
- Figure 87: East Asia Market Value Share and BPS Analysis by Form, 2026 and 2036
- Figure 88: East Asia Market Y-o-Y Growth Comparison by Form, 2026-2036
- Figure 89: East Asia Market Attractiveness Analysis by Form
- Figure 90: South Asia and Pacific Market Value Share and BPS Analysis by Country, 2026 and 2036
- Figure 91: South Asia and Pacific Market Value Share and BPS Analysis by End Use, 2026 and 2036
- Figure 92: South Asia and Pacific Market Y-o-Y Growth Comparison by End Use, 2026-2036
- Figure 93: South Asia and Pacific Market Attractiveness Analysis by End Use
- Figure 94: South Asia and Pacific Market Value Share and BPS Analysis by Grade, 2026 and 2036
- Figure 95: South Asia and Pacific Market Y-o-Y Growth Comparison by Grade, 2026-2036
- Figure 96: South Asia and Pacific Market Attractiveness Analysis by Grade
- Figure 97: South Asia and Pacific Market Value Share and BPS Analysis by Industry, 2026 and 2036
- Figure 98: South Asia and Pacific Market Y-o-Y Growth Comparison by Industry, 2026-2036
- Figure 99: South Asia and Pacific Market Attractiveness Analysis by Industry
- Figure 100: South Asia and Pacific Market Value Share and BPS Analysis by Form, 2026 and 2036
- Figure 101: South Asia and Pacific Market Y-o-Y Growth Comparison by Form, 2026-2036
- Figure 102: South Asia and Pacific Market Attractiveness Analysis by Form
- Figure 103: Middle East and Africa Market Value Share and BPS Analysis by Country, 2026 and 2036
- Figure 104: Middle East and Africa Market Value Share and BPS Analysis by End Use, 2026 and 2036
- Figure 105: Middle East and Africa Market Y-o-Y Growth Comparison by End Use, 2026-2036
- Figure 106: Middle East and Africa Market Attractiveness Analysis by End Use
- Figure 107: Middle East and Africa Market Value Share and BPS Analysis by Grade, 2026 and 2036
- Figure 108: Middle East and Africa Market Y-o-Y Growth Comparison by Grade, 2026-2036
- Figure 109: Middle East and Africa Market Attractiveness Analysis by Grade
- Figure 110: Middle East and Africa Market Value Share and BPS Analysis by Industry, 2026 and 2036
- Figure 111: Middle East and Africa Market Y-o-Y Growth Comparison by Industry, 2026-2036
- Figure 112: Middle East and Africa Market Attractiveness Analysis by Industry
- Figure 113: Middle East and Africa Market Value Share and BPS Analysis by Form, 2026 and 2036
- Figure 114: Middle East and Africa Market Y-o-Y Growth Comparison by Form, 2026-2036
- Figure 115: Middle East and Africa Market Attractiveness Analysis by Form
- Figure 116: Global Market - Tier Structure Analysis
- Figure 117: Global Market - Company Share Analysis
Frequently Asked Questions
How big is the Silicon Metal Market in 2026?
Future Market Insights estimates the global silicon metal market at USD 7.7 billion in 2026, projected to reach USD 12.5 billion by 2036.
How fast is the Silicon Metal Market expected to grow through 2036?
FMI projects a 5.0% CAGR from 2026 to 2036, taking the global market from USD 7.7 billion in 2026 to USD 12.5 billion by 2036.
Which end-use segment leads the Silicon Metal Market?
Silicones lead the end-use segment with a 36.2% share in 2026, supported by consistent demand from chemical conversion customers requiring specification-compliant silicon metal.
Which grade leads the Silicon Metal Market?
Grade 441 and 411 accounts for the largest grade share at 31.1% in 2026, as buyers prioritize impurity control and product qualification requirements.
Which countries are expected to grow fastest in the Silicon Metal Market?
South Korea is projected to grow at a 4.0% CAGR from 2026 to 2036, followed by the United States at 3.9% over the same period.
Which companies are profiled in the Silicon Metal Market?
The key companies profiled in the silicon metal market include Ferroglobe, Elkem, Hoshine Silicon Industry, Wacker Chemie, Rima Industrial, and Simcoa Operations. Their market positions differ across external metal sales, captive conversion, and control over reductant inputs.
Preview the report firsthand - request a free sample
Get SampleGet the brochure for pricing and purchase details.
Get PDF
