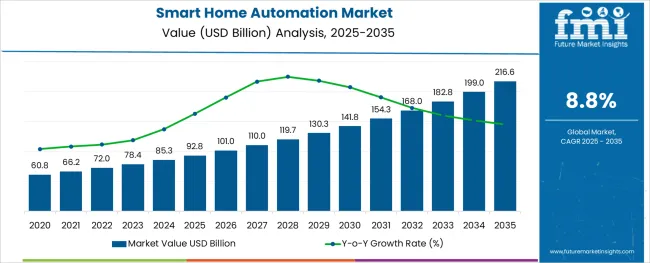
The Smart Home Automation Market is estimated to be valued at USD 92.8 billion in 2025 and is projected to reach USD 216.6 billion by 2035, registering a compound annual growth rate (CAGR) of 8.8% over the forecast period.

The stainless steel valve tag market is expanding steadily as industrial sectors prioritize asset management, safety compliance, and equipment traceability. Increasing investments in infrastructure and process automation have heightened demand for robust and clear identification solutions capable of withstanding harsh environments.
The shift toward digital transformation in industries such as oil and gas, manufacturing, and utilities is encouraging the adoption of advanced tagging systems that support maintenance and audit operations. Growing awareness around regulatory compliance for equipment labeling and enhanced safety protocols is also influencing market expansion.
The rise of e-commerce platforms has facilitated easier procurement of valve tags, increasing accessibility for small to medium enterprises and broadening geographic reach. Material innovations and customization options continue to enhance product longevity and visibility, creating opportunities for market penetration across diverse industrial applications.
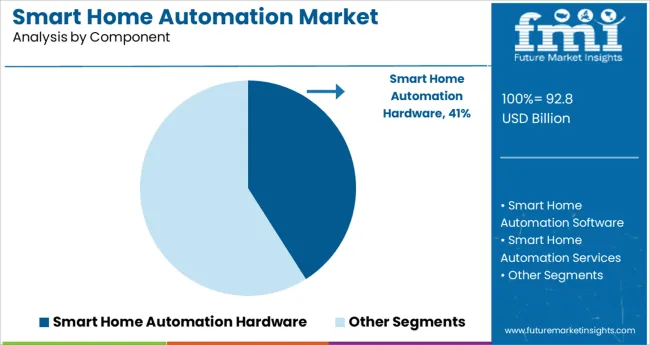
The market is segmented by Component, Technology Type, and Application Area and region. By Component, the market is divided into Smart Home Automation Hardware, Smart Home Automation Software, and Smart Home Automation Services. In terms of Technology Type, the market is classified into Wireless Smart Home Automation, Cellular Smart Home Automation, and Other Smart Home Automation Technologies. Based on Application Area, the market is segmented into Smart Home Automation for Security, Smart Home Automation for Lighting, Smart Home Automation for Entertainment, Smart Home Automation for HVAC & Energy Management, and Smart Home Automation for Smart Kitchens. Regionally, the market is classified into North America, Latin America, Western Europe, Eastern Europe, Balkan & Baltic Countries, Russia & Belarus, Central Asia, East Asia, South Asia & Pacific, and the Middle East & Africa.
The market is segmented by Component, Technology Type, and Application Area and region. By Component, the market is divided into Smart Home Automation Hardware, Smart Home Automation Software, and Smart Home Automation Services. In terms of Technology Type, the market is classified into Wireless Smart Home Automation, Cellular Smart Home Automation, and Other Smart Home Automation Technologies. Based on Application Area, the market is segmented into Smart Home Automation for Security, Smart Home Automation for Lighting, Smart Home Automation for Entertainment, Smart Home Automation for HVAC & Energy Management, and Smart Home Automation for Smart Kitchens. Regionally, the market is classified into North America, Latin America, Western Europe, Eastern Europe, Balkan & Baltic Countries, Russia & Belarus, Central Asia, East Asia, South Asia & Pacific, and the Middle East & Africa.

The less than 30 mm thickness segment is expected to hold 41.3% of the revenue share in 2025 within the thickness category. This segment’s leadership is supported by its suitability for a wide range of valve sizes and equipment types, providing sufficient durability while minimizing material costs.
The thinner tags offer flexibility in installation, especially in tight spaces and complex piping systems, making them preferable for industries where compactness is critical. Their compatibility with standard mounting hardware and ability to endure corrosion and wear have reinforced demand in sectors emphasizing both performance and cost efficiency.
This balance between robustness and adaptability has contributed to the segment’s dominant position.
Within the product type category, engraved valve tags are projected to command 57.8% of the market revenue share in 2025, marking them as the leading product form. The prominence of engraved tags is due to their superior legibility, permanence, and resistance to environmental degradation such as fading, scratching, and chemical exposure.
Engraving allows precise and customizable marking, meeting stringent industry standards for traceability and safety. The technique supports complex information including serial numbers, barcodes, and QR codes, enhancing integration with digital asset management systems.
Manufacturers’ emphasis on delivering long-lasting, tamper-proof tags that reduce maintenance costs has reinforced the adoption of engraved tags in heavy industries.
The online distribution channel is expected to generate 63.7% of market revenue in 2025, making it the most dominant sales route. The growth of e-commerce platforms has revolutionized procurement by offering convenience, broader product selections, and competitive pricing to end-users across industries.
Online channels enable buyers to access detailed product specifications, customization options, and customer reviews, simplifying purchase decisions. This has particularly benefited small and medium-sized enterprises lacking traditional supply chain networks.
Additionally, digital platforms have streamlined order fulfillment and reduced lead times, fostering faster adoption. Vendors are increasingly investing in online marketplaces and direct-to-customer websites to expand reach and improve customer engagement, reinforcing the online channel’s leadership in the stainless steel valve tag market.
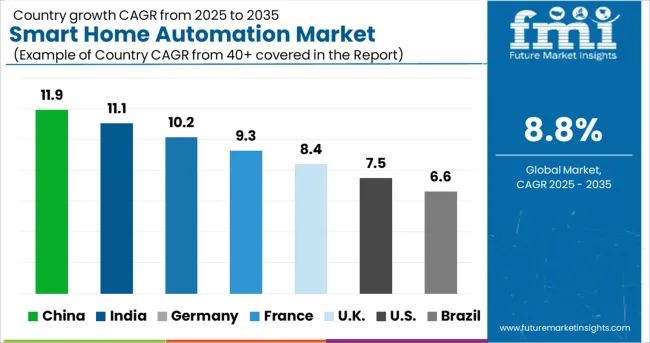
The United States is expected to emerge as the leading country during the predicted period. The country's preference for modern technologies such as artificial intelligence and the internet of things, along with increased disposable income, boosts demand for smart technologies. Many startups are sprouting in the region, adding to the market's growth. As a result, the market in North America is predicted to expand considerably throughout the forthcoming years.
The Asia Pacific is predicted to rise rapidly throughout the projection period due to increased expenditure on smart technologies. Owing to the dominance of important smart device makers, China is likely to monopolize the region's share. Due to increased demand for automated solutions, India is likely to grow at a high CAGR throughout the upcoming years.
The European market for smart home automation is predicted to be the second-largest. This can be attributable to rising disposable income and increased product availability at reasonable rates. The region has seen a considerable increase in the number of powerful market participants over the years. Various government regulations in European nations include the implementation of smart lodging technologies due to their sustainable environmental effects and power-efficient solutions.
Manufacturers are embarking on a high-bandwidth wireless protocol with extremely low power consumption and latency. This enables demanding applications such as wireless VR and IoT. These technologies are required for smart house operations. Furthermore, when combined with energy harvesting technologies used in smart homes, important participants in smart home automation prolong the battery life of gadgets and enable the battery-free functioning of wireless devices such as sensors.
With a wide range of address security solutions, leading firms provide continuous end-to-end protection to all appliances and other elements. It includes hazards like infiltration, theft, gas leaks, and fire warnings. Companies are also producing an AI-powered safety gadget that detects people without masks in neighboring buildings.
Smart homes confront new security risks as automation and communication technologies improve. Smart sensors and smart surveillance are used by various vendors to prevent theft. They are working on motion, touch, and fire sensors, as well as presence detectors. Due to the networked gadgets in smart homes, cybersecurity is an essential component of home automation. These technologies provide homeowners with peace of mind that their house is safe from outside and internet intruders.
Home automation technology, by providing features such as artificial lighting, temperature settings, and safety considerations, naturally makes your life simpler. With the new technology, entrepreneurs have introduced a touchscreen smart thermostat with a two-wire retrofit design that also delivers smart automation features such as ideal comfort, lighting effects, appropriateness, and energy savings.
Startups are developing a wireless, communicative door striking. It connects with other smart devices in the home environment by utilizing smart home connectivity technologies. It interfaces through Bluetooth Low Energy (BLE) and Z-Wave wireless technologies. The locks may be operated remotely using a smartphone app. This allows homeowners to provide access to others at certain periods and receive real-time notifications with a record of house access.
Growing Inclination of Consumers toward Smart Home Technology to Strengthen the Market
Smart technology is penetrating various industries and transforming the home automation system landscape. With the introduction of smart technology like self-diagnosing equipment, smart entertainment, modern self-health care, and smart kitchen, among others, automation is developing significantly.
Integration of modern technologies such as IoT, AI, and ML, the demand for smart devices is expected to rise in the coming time. According to a Voicbot.ai survey, in January 2024, about 87.7 million US consumers were using smart speakers. The significant figure of such consumers shows the growing inclination of consumers toward the adoption of smart home automation technology. Further, smart city projects are growing in number across the globe, surging the demand for home automation businesses.
With access to home accessories from remote locations, users can regulate their home appliances in their absence. They can also keep a watch on any activity taking place within the house through video surveillance systems. For instance, in February 2025, India-based home automation company, One Switch, announced the launch of franchising options for the expansion of their smart home automation services. The eco-friendly solutions such as automatic water sensors and motion sensors, offered by smart home companies like One Switch, have also helped in reducing electricity bills and enhancing the overall home environment. Attributed to such factors, the smart home automation market is expected to augment the smart home automation market size during the forecast period.
Expensive Products and Limited Knowledge Regarding the Technology to Hinder the Market Growth
Automation tools and equipment are expensive, thus, users with average or below average disposable income find it challenging to buy such modern services. Due to its high cost, there is polarization in the procurement of such advanced equipment. Thus, the cost barrier is anticipated to play a significant role in limiting the market growth during the forecast period. Further, various users are yet not well familiar with such technology which limits the adoption of smart home automation devices. Thus, the complicated technologies and applications are likely to inhibit the market growth in the assessment period.
However, increasing implementation of smart TV, light automation, face recognition doorbells, smart nurseries, and video monitoring, owing to a number of benefits offered by these is expected to act as a significant counter to the smart home automation market during the forecast period, and magnify the market size.
Increasing Innovative Property Security System to act as an opportunity for the Market
Players in the market are making a significant investment in developing innovative and advanced smart security systems to meet the growing security demands of the consumers, which is expected to act as a significant opportunity for the smart home automation market in the forthcoming period.
In August 2024, Hero Electronix launched a wide range of address security systems under Qubo Shield to offer continuous end-to-end security to all appliances and other aspects. It covers threats like theft, gas leak, fire alert, intrusion, and others. The company also launched AI-based safety equipment to detect persons without masks on the nearby premises.
The adoption of smart doorbells with video and audio, AI-based biometric, and face recognition capabilities is rising, which will provide high dividends to the market in the forecast period.
Smart Home Automation for Entertainment to experience significant Upsurge
Based on application, the market can be segmented into lighting, security, HVAC & energy management, entertainment, and smart kitchen. As per the analysis, the entertainment segment is anticipated to dominate the market during the forecast period. According to Future Market Insights, a CAGR worth 7.8% is anticipated for the segment. Growth can be attributed to the increasing efforts of manufacturers to offer connected home entertainment products through smart technologies such as smart speakers to augment the entertainment experience. Such innovations are likely to benefit the segment growth in the forecast period.
In May 2020, Samsung Electronics Co., Ltd. announced that all 2020 Samsung Smart TVs and select 2020 TV models would feature the recently launched Apple TV app and offer AirPlay 2 support in over 100 countries. This would allow its consumers to enjoy Apple TV channels and iTunes TV shows and movies on Samsung smart TVs. Such initiatives are expected to benefit the segmental growth during the forecast period.
Wireless Smart Home Automation to take the Cake
By technology, wireless smart home automation is expected to take centerstage, accumulating a revenue share worth 44% in 2025. As per FMI’s report, the segment is further poised to grow at a CAGR of 7.6% across the forecast period ranging from 2025 to 2035. Advancements in connectivity is attributed as the chief market growth accelerator.
Given that wireless technologies are far less invasive, their uptake across homes is rising rapidly. Furthermore, wireless automation is far more economical in terms of power consumption and cost. For instance, a basic smart home installation would typically cost between 2-6% of one’s property value, which is far lesser compared to a conventional wired home.

Growing Inclination toward Advanced Technologies to Boost the Smart Home Automation Market in North America
As per the analysis, North America is anticipated to dominate the global smart home automation market during the forecast period, registering a CAGR worth 8% from 2025 to 2035. Domination of the market can be attributed to the increasing inclination of the region towards the adoption of advanced technologies such as AI, IoT, and ML.
The increasing collaborations among players in the region are expected to benefit the regional market during the forecast period. For instance, in August 2024, ADT Inc. announced a long-term partnership with Google LLC to provide smart home security solutions across the United States. Further, Google has invested USD 450 Million in ADTC Inc., in order to increase the smart home security solutions. Thus, the market in North America is expected to grow significantly during the forecast period.
Increasing Disposable Income in Europe to Drive the Regional Market
As per the analysis, the market for smart home automation in Europe is expected to be the second-largest, expected to flourish at a 7.7% CAGR from 2025 to 2035. This can be attributed to the increasing disposable income and product availability at affordable prices.
Furthermore, renowned players of the region are increasing their product portfolios to meet the needs of consumers in various application areas within households, including water conservation, and security.
Germany is anticipated to be the fastest-growing country in the region. As per a survey conducted by a German industry group Bitkom, 41% of all Germans had at least one smart home device installed in 2024. Such factors are expected to benefit the regional market growth during the forecast period.
Presence of Developing Countries to Augment the Regional Market Size
According to the study, the Asia Pacific smart home automation market is expected to grow at a CAGR of 7.5% during the forecast period ranging from 2025 to 2035. This can be attributed to the presence of developing countries such as India and China.
China is expected to dominate the regional market due to the presence of established smart device manufacturers. And, India is likely to gain rapid CAGR during the assessment period owing to the rising demand for automated solutions.
Furthermore, globally established players in the region are collaborating with regional players, which will drive the market growth. For instance, in April 2024, Schneider Electric collaborated with India-based home renovator, Livespace. Thus, the market in APAC is expected to flourish significantly during the forecast period.
Given the ever-increasing scope of automation in homes, prominent service providers are seizing this opportunity to introduce highly advanced and seamless automation solutions, factoring in the cost associated with installing such systems. Furthermore, various start-ups offering smart home automation solutions have acquired importance in the past few years. Some notable start-ups in this space are as follows:
| Start-Up | Alarm.com |
|---|---|
| Origin | United States |
| Year of Establishment | 2000 |
| Start-Up | Netatmo |
|---|---|
| Origin | France |
| Year of Establishment | 2011 |
| Start-Up | Nest |
|---|---|
| Origin | United States |
| Year of Establishment | 2010 |
| Start-Up | Notion |
|---|---|
| Origin | United States |
| Year of Establishment | 2013 |
| Start-Up | Ajax Systems |
|---|---|
| Origin | United States |
| Year of Establishment | 2011 |
| Start-Up | iDevices |
|---|---|
| Origin | United States |
| Year of Establishment | 2010 |
| Start-Up | Caavo |
|---|---|
| Origin | United States |
| Year of Establishment | 2020 |
| Start-Up | Unified Remote |
|---|---|
| Origin | Sweden |
| Year of Establishment | 2010 |
| Start-Up | Bond Home |
|---|---|
| Origin | United States |
| Year of Establishment | 2020 |
| Start-Up | Xped |
|---|---|
| Origin | Australia |
| Year of Establishment | 2006 |
In August 2024, Alarm.com introduced Ambient Insights for alarm response, a solution which recognizes activity around a property and delivers contextual information to monitoring stations in the event of an alarm. The stations can use this real-time data to prioritize alarms and dispatch police, fire or emergency medical services to properties faster. The platforms further allows for a wider range of emergencies and reduces dispatches for false alarms

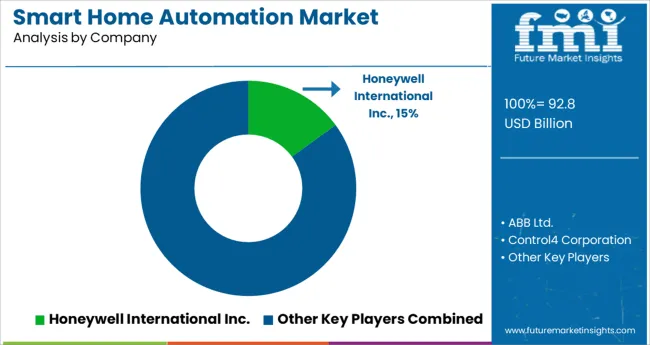
Key players in the global smart home automation market include Control4 Corporation (USA), BB Ltd. (Switzerland), Crestron Electronics, Inc. (USA), Ingersoll-Rand plc (Ireland), Honeywell International Inc. (USA), Johnson Controls (USA), Leviton Manufacturing Company, Inc. (USA), Legrand SA (France), Lutron Electronics Co., Inc. (USA), Schneider Electric (France), and Siemens AG (Germany).
Recent Developments in the Industry include
| Report Attributes | Details |
|---|---|
| Growth Rate | CAGR of 8.84% from 2025 to 2035 |
| Market Value in 2025 | USD 92.8 billion |
| Market Value in 2035 | USD 216.6 billion |
| Base Year for Estimation | 2024 |
| Historical Data | 2020 to 2024 |
| Forecast Period | 2025 to 2035 |
| Quantitative Units | billion for Value |
| Report Coverage | Revenue Forecast, Volume Forecast, Company Ranking, Competitive Landscape, Growth Factors, Trends and Pricing Analysis |
| Segments Covered | Component, Technology, Application, Region |
| Regions Covered | North America; Europe; Asia Pacific; Latin America; Middle East & Africa |
| Key Countries Profiled | USA, Canada, Mexico, Brazil, Germany, France, Italy, UK, China, Japan, South Korea, India, Malaysia, Singapore, Australia, New Zealand, GCC, South Africa, Israel |
| Key Companies Profiled | ABB Ltd.; Control4 Corporation; Crestron Electronics Inc.; Honeywell International Inc.; Ingersoll Rand Plc.; Johnson Controls; Legrand SA; Leviton Manufacturing Company Inc.; Lutron Electronics Co. Ltd.; Schneider Electric; Siemens AG |
| Report Customization & Pricing | Available upon Request |
The global smart home automation market is estimated to be valued at USD 92.8 billion in 2025.
It is projected to reach USD 216.6 billion by 2035.
The market is expected to grow at a 8.8% CAGR between 2025 and 2035.
The key product types are smart home automation hardware, smart home automation software and smart home automation services.
wireless smart home automation segment is expected to dominate with a 68.0% industry share in 2025.


Our Research Products

The "Full Research Suite" delivers actionable market intel, deep dives on markets or technologies, so clients act faster, cut risk, and unlock growth.

The Leaderboard benchmarks and ranks top vendors, classifying them as Established Leaders, Leading Challengers, or Disruptors & Challengers.

Locates where complements amplify value and substitutes erode it, forecasting net impact by horizon

We deliver granular, decision-grade intel: market sizing, 5-year forecasts, pricing, adoption, usage, revenue, and operational KPIs—plus competitor tracking, regulation, and value chains—across 60 countries broadly.

Spot the shifts before they hit your P&L. We track inflection points, adoption curves, pricing moves, and ecosystem plays to show where demand is heading, why it is changing, and what to do next across high-growth markets and disruptive tech

Real-time reads of user behavior. We track shifting priorities, perceptions of today’s and next-gen services, and provider experience, then pace how fast tech moves from trial to adoption, blending buyer, consumer, and channel inputs with social signals (#WhySwitch, #UX).

Partner with our analyst team to build a custom report designed around your business priorities. From analysing market trends to assessing competitors or crafting bespoke datasets, we tailor insights to your needs.
Supplier Intelligence
Discovery & Profiling
Capacity & Footprint
Performance & Risk
Compliance & Governance
Commercial Readiness
Who Supplies Whom
Scorecards & Shortlists
Playbooks & Docs
Category Intelligence
Definition & Scope
Demand & Use Cases
Cost Drivers
Market Structure
Supply Chain Map
Trade & Policy
Operating Norms
Deliverables
Buyer Intelligence
Account Basics
Spend & Scope
Procurement Model
Vendor Requirements
Terms & Policies
Entry Strategy
Pain Points & Triggers
Outputs
Pricing Analysis
Benchmarks
Trends
Should-Cost
Indexation
Landed Cost
Commercial Terms
Deliverables
Brand Analysis
Positioning & Value Prop
Share & Presence
Customer Evidence
Go-to-Market
Digital & Reputation
Compliance & Trust
KPIs & Gaps
Outputs
Full Research Suite comprises of:
Market outlook & trends analysis
Interviews & case studies
Strategic recommendations
Vendor profiles & capabilities analysis
5-year forecasts
8 regions and 60+ country-level data splits
Market segment data splits
12 months of continuous data updates
DELIVERED AS:
PDF EXCEL ONLINE
Smart Home Automation Technology Market Size and Share Forecast Outlook 2025 to 2035
Smart Home Automation in India – IoT & AI-Driven Growth
Home Automation Sensors Market Size and Share Forecast Outlook 2025 to 2035
Home Automation Market Analysis by Product, Application, Networking Technology, and Region Through 2035
Smart Home Wireless Smoke Detector Market Size and Share Forecast Outlook 2025 to 2035
Smart Home Devices Market Size and Share Forecast Outlook 2025 to 2035
Smart Home Gym Equipment Market Size and Share Forecast Outlook 2025 to 2035
Smart Home Service Market Size and Share Forecast Outlook 2025 to 2035
Smart Home Security Camera Market Analysis - Size, Share, and Forecast 2025 to 2035
Smart Home Market Size and Share Forecast Outlook 2025 to 2035
Smart Home-Based Beverage Machine Market Size and Share Forecast Outlook 2025 to 2035
Smart Home Payments Market Size and Share Forecast Outlook 2025 to 2035
Smart Home Solutions Market Size and Share Forecast Outlook 2025 to 2035
Smart Home Appliances Market Growth – Trends & Forecast 2025 to 2035
Smart Home Water Sensors & Controllers Market Trends & Forecast 2025 to 2035
Smart Home Platforms Market Growth – Trends & Forecast through 2034
Smart Home Hub Market
Smart Grid Home Area Network (HAN) Market Size and Share Forecast Outlook 2025 to 2035
Smart Elevator Automation System Market Growth - Trends & Forecast 2024 to 2034
Korea Smart Home Security Camera Market Size and Share Forecast Outlook 2025 to 2035

Thank you!
You will receive an email from our Business Development Manager. Please be sure to check your SPAM/JUNK folder too.
Chat With
MaRIA