Reports

- Global Locations -

Headquarters

Future Market Insights, Inc.

Christiana Corporate, 200
Continental Drive, Suite 401,
Newark, Delaware - 19713,
United States

T: +1-845-579-5705

Americas

Future Market Insights, Inc.

616 Corporate Way, Suite 2-9018,
Valley Cottage, NY 10989, United States

T: +1-347-918-3531

MEA

Future Market Insights

1602-6 Jumeirah Bay X2 Tower, Plot No: JLT-PH2-X2A,
Jumeirah Lakes Towers, Dubai,
United Arab Emirates

Europe

Future Market Insights

3rd Floor, 207 Regent Street,
W1B 3HH London
United Kingdom

T: + 44 (0) 20 8123 9659
D: +44 (0) 20 3287 4268

Asia Pacific

Future Market Insights

IndiaLand Global Tech Park, Unit UG-1, Behind Grand HighStreet, Phase 1, Hinjawadi, MH, Pune – 411057, India

Security Operation Centre as a Service Market Outlook from (2024 to 2034)

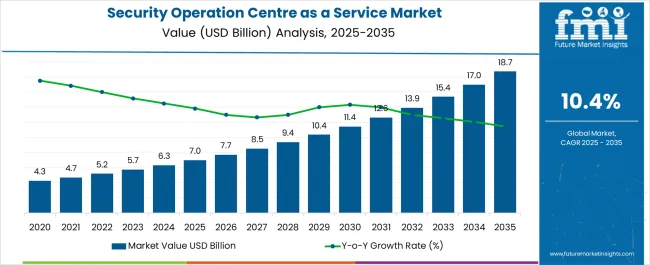
The security operation centre as a service market size was valued at US$ 6.3 billion in 2023. By 2024, it is likely to reach a valuation of US$ 7 billion. During the forecast period ranging from 2024 to 2034, the global market for security operation centre as a service is expected to register a 10.90% CAGR. A market size US$ 19.7 billion is anticipated for the market in 2034.

Key Industry Trends and Highlights

  • Collaboration and Partnerships- Within the security operation centre as a service market, notable collaborations and partnerships emerged, reflecting a trend toward industry collaboration to create more complete and comprehensive cybersecurity solutions. These partnerships attempt to meet the expanding difficulties posed by cyber-attacks by combining experience, technology, and resources.
  • Technological Integration- Significant technological advances were made in the market, with a particular emphasis on incorporating advanced technologies like machine learning (ML), artificial intelligence (AI), and automation into security operations centre as a service offerings, thereby improving threat detection along with response capabilities.
Attributes Details
Estimated Market Value in 2023 US$ 6.3 billion
Expected Market Value in 2024 US$ 7 billion
Expected Market Value in 2034 US$ 19.7 billion
Value based CAGR from 2024 to 2034 10.90%

Don't pay for what you don't need

Customize your report by selecting specific countries or regions and save 30%!

2019 to 2023 Historical Analysis vs. 2024 to 2034 Industry Forecast Projections

Report Attributes Details
Market value in 2019 US$ 4.5 billion
Market value in 2023 US$ 6.3 billion
CAGR from 2019 to 2023 9%

During the historical period, the global security operation centre as a service market rose at a 9% CAGR. The increasing frequency and complexity of cyberattacks throughout the world were key drivers, leading firms to invest in advanced security solutions.

The growing awareness of the significance of proactive cybersecurity measures, along with an increasing focus on regulatory compliance, aided in the market's rise. The complexity of IT infrastructures, as well as a growing awareness of the advantages of outsourcing cybersecurity operations, fueled this market during the historical period.

Key Drivers of the Global Security Operation Centre as a Service Market

  • The continual rise in both the severity and frequency of cyberattacks throughout the world is a major driver of the security operation centre as a service market. Organizations are looking for advanced outsourced safety measures to identify, respond to, and mitigate changing cyber hazards.
  • Stringent data protection and privacy requirements increase demand for security operation centre as a service. Compliance with these standards is prioritized by businesses across industries, and security operation centre as a service providers provide specialized knowledge to assist enterprises in adhering to complex and developing compliance requirements.
Sudip Saha
Sudip Saha

Principal Consultant

Talk to Analyst

Find your sweet spots for generating winning opportunities in this market.

Challenges in the Global Security Operation Centre as a Service Market

  • The lack of experienced cybersecurity professionals is a serious concern in the global security operation centre as a service market. The need for specialized knowledge in threat analysis, detection, and incident response frequently exceeds the available talent pool, impeding the efficient running of a security operation centre as a service.
  • Integrating a security operation centre as a service into existing organizational structures might be difficult. As enterprises attempt to embrace security operation centre as a service without affecting existing operations or compromising efficiency, ensuring compatibility with varied systems, applications, and infrastructure creates a problem.

Comparative View of Adjacent Industries

The table below has compared two other industries, namely the biometric as a service market and business process as a service (BPaaS) market below. This shows how the security operation centre as a service market will perform in contrast to these two industries.

Security Operation Centre as a Service Market:

CAGR from 2024 to 2034 10.90%
Market Value in 2024 US$ 7 billion
Key Trends
  • Incorporating artificial intelligence (AI) and machines learning (ML) is a key trend within security operation centre as a service.
Key Opportunities
  • The increasing frequency and sophistication of cyberattacks on a global level are driving the use of security operation centre as a service.

Biometrics-as-a-Service Market:

CAGR from 2022 to 2032 22.4%
Key Trends
  • The industrial demand for quick and secure registration is driving the significant expansion of the biometric as a service market.
Key Opportunities
  • Employee identification may be accomplished at the workplace using this method, which is likely to increase demand for biometric as a service.

Business Process as a Service (BPaaS) Market:

CAGR from 2023 to 2033 11.2%
Key Trends The increasing popularity of technologies such as cloud computing, social media platforms, corporate analytics, and process automation software is fueling market expansion.
Key Opportunities By reorganizing the system background and offering a technical environment on a single, centralized platform, BPaaS solutions help to save costs and increase operational efficiency.

Get the data you need at a Fraction of the cost

Personalize your report by choosing insights you need
and save 40%!

Country wise Insights

The five countries most predicted to grow significantly throughout the forecast period are listed in the table below. Australia and Germany are expected to have the greatest progress among these countries.

Key Statistics

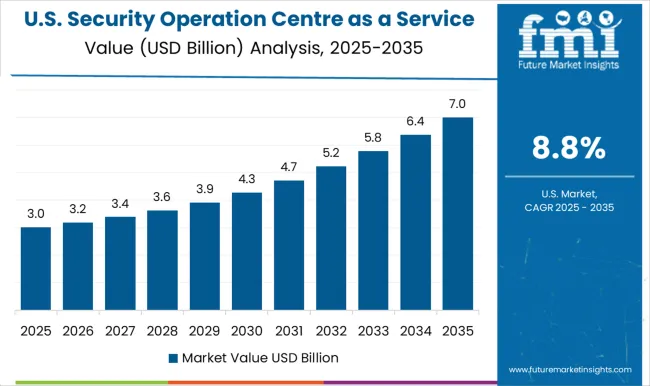
  • The United States market for security operation centre as a service is likely to garner an 8.80% CAGR during the forecast period.
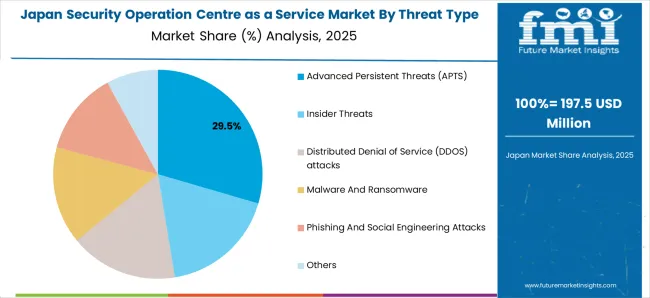
  • The security operation centre as a service market in Japan is poised to expand at a 10.40% CAGR from 2024 to 2034.
  • The Germany market for security operation centre as a service is poised to develop at a 12.20% CAGR during the forecast period.
  • The China market for security operation centre as a service is likely to expand at an 11.50% CAGR from 2024 to 2034.
  • The Australia security operation centre as a service market is poised to expand at a 14.50% CAGR during the forecast period.

Forecast CAGRs from 2024 to 2034

Country CAGR from 2024 to 2034
The United States 8.80%
Japan 10.40%
Germany 12.20%
China 11.50%
Australia 14.50 %

Cybersecurity Threats to Enhance Demand in the United States

With a growth in sophisticated cyber assaults on companies and regulatory bodies, the United States confronts a growing complicated cyber threat setting. The necessity for strong cybersecurity measures is pushing the use of a security operation centre as a service, which provides sophisticated threat detection, real time monitoring, and quick incident response to efficiently reduce risks.

The United States has severe data protection and privacy legislation, such as GDPR and CCPA that require businesses to employ comprehensive security measures. Security operation centre as a service providers frequently specialize in assisting organizations in complying with these laws, making it an appealing alternative for enterprises seeking to assure compliance while benefiting from skilled cybersecurity services.
Cross Industry Adoption to Boost Demand in Japan

Security operation centre as a service are becoming more popular in Japan, which is expanding outside conventional industries. This widespread popularity demonstrates that security operation centre as a service are recognized as a versatile and successful solution for satisfying the varying cybersecurity demands of enterprises operating in many fields.

The technologically driven landscape promotes a desire for new cybersecurity solutions. In Japan, security operation centre as a service use modern technologies such as machine learning and artificial intelligence for threat analysis, resulting in technologically sophisticated protection against cyberattacks. The incorporation of these innovative methods improves the overall efficacy of security operation centre as a service, making it an enticing alternative for enterprises looking for revolutionary cybersecurity solutions.

Immense Demand from the Industrial Sector in Germany to Boost Demand

The deployment of a security operation centre as a service in Germany is distinguished by an intense focus on industrial security. Security operation centre as a service caters to the specific cybersecurity concerns encountered by German industry, giving customized options to protect key infrastructure and intellectual property.

Proactive monitoring is prioritized by German organizations in order to discover possible concerns before they worsen. Security operation centre as a service provides continuous monitoring and early threat detection by employing modern technologies. This proactive strategy is consistent with the regional emphasis on predictive techniques for ensuring operational continuity and mitigating risks.

The National Cybersecurity Initiative in China to accelerate Demand

The emphasis of the Chinese government on strengthening national cybersecurity is driving the development of security operation centre as a service in China. Security operation centre as a service complements the overall cybersecurity measures in China.

It does this by providing sophisticated detection and response to threats capabilities to safeguard key infrastructure and sensitive data against both internal and external attacks. As companies cope with growing cyber risks, China's fast digital transformation has raised demand for security operation centre as a service.

It is a scalable and adaptable cybersecurity solution that helps Chinese organizations secure their digital assets in the face of a changing technological landscape.

Geopolitical Position of Australia in APAC to Boost the Deployment

The deployment of the security operation centre as a service is driven by the geopolitical position of Australia in the Asia Pacific region. Security operation centre as a service enables a solid defense for safeguarding important national assets and sensitive information.

It also harmonizes with the regional strategic goals in sustaining regional stability as well as cybersecurity leadership. The adoption of security operation centre as a service is influenced by the regional dynamic regulatory environment, which is characterized by strong data protection rules. Organizations want security operation centre as a service to help them manage and comply with changing compliance standards.

Category wise Insights

On the basis of industry, the market has been segmented into BFSI, healthcare, IT and telecommunications, retail and consumer goods, media and entertainment, transportation and logistics, government, manufacturing, others. A significant market share is likely to be generated by the BFSI segment in 2024.

Based on enterprise size, the market has been divided into large enterprises and small and medium sized enterprises. In 2024, the large enterprise segment is forecast to acquire the majority of market share by size.

Category Market share in 2024
BFSI 25%
Large Enterprise 62%

BFSI to Generate High Demand for Security Operation Centre as a Service

The BFSI segment by industry type is expected to acquire a market share of 25% in 2024. The BFSI industry has a greater need for security operation centre as a service due to its increased vulnerability to cyberattacks.

Since the BFSI sector handles large volumes of sensitive data, it is an appealing target for hackers. Security operation centre as a service takes a proactive and specialized approach to cybersecurity, including incident response, real time threat monitoring, and compliance management. The changing threat landscape, evolving regulatory requirements, and the need for constant vigilance make security operation centre as a service essential for BFSI, guaranteeing robust cyber risk protection while allowing companies to focus on core financial tasks without risking data integrity or customer trust.

Retail and E commerce Sector to Bolster the Demand for Security Operation Centre as a Service

In 2024, the large enterprise segment is likely to acquire a 62% global market share by enterprise size. Large enterprises manage massive volumes of sensitive data that are vulnerable to sophisticated cyber assaults. A security operation centre as a service delivers round the clock monitoring, leveraging innovative technology to detect and respond to security issues quickly, lowering the risk of data breaches.

The provision of a security operation centre as a service avoids the need for large upfront expenditures in infrastructure and labor. Large organizations can subscribe to a security operation centre as a service, adjusting the service to their changing needs. This scalable and cost effective solution enables enterprises to strengthen their cybersecurity posture without incurring the expense of operating an in house security operations center.
Competitive Landscape

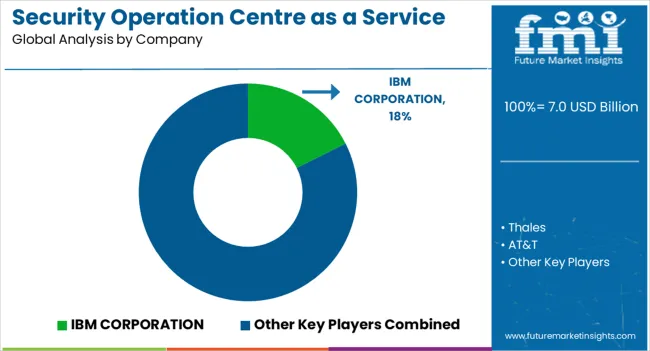
Companies in the global Security Operation Centre as a Service market are employing enhanced threat detection along with response capabilities to provide clients with comprehensive cybersecurity solutions. These companies improve threat detection and mitigation by using modern technologies such as machine learning, AI driven analytics, and automation.

The global market is also supported by strategic collaborations, constant innovation, as well as scalability in service delivery. Proactive threat intelligence, regulatory compliance experience, and custom solutions further entice clients, promoting revenue growth and profitability in the dynamic cybersecurity services landscape.

Some of the prominent developments by the key companies in this domain are

Company Key Developments
Thales
  • In 2023, Thales announced the completion of its acquisition of Imperva.
  • Thales will help enterprises identify and safeguard critical data anywhere, control access, and secure all channels to it with the integration of Imperva beginning in January.
  • The second largest operating nation of the company is presently North America.
  • Imperva is the eighth purchase of the company in the digital security space in the previous nine years, and the Group's second largest acquisition behind Gemalto.
AT&T
  • AT&T announced ambitions to lead the commercial scale implementation of open radio access networks (Open RAN) in the United States.
  • This industry leading step, made in conjunction with Ericsson, will advance the efforts of the telecoms sector and help to develop a stronger community of network infrastructure providers as well as suppliers.
  • Over the course of the 5 year contract with Ericsson, AT&T might spend up to US$ 14 billion.

Report Scope

Attribute Details
Projected market value in 2024 US$ 7 billion
Projected market value in 2034 US$ 19.7 billion
Forecast CAGR from 2024 to 2034 10.90%
Forecast period 2024 to 2034
Historical period 2019 to 2023
Market analysis Value in US$ billion
Key regions covered
  • North America
  • Latin America
  • Western Europe
  • Eastern Europe
  • South Asia and Pacific
  • East Asia
  • The Middle East and Africa
Key countries profiled
  • The United States
  • Canada
  • Brazil
  • Mexico
  • Germany
  • The United Kingdom
  • France
  • Spain
  • Italy
  • Russia
  • Poland
  • Czech Republic
  • Romania
  • India
  • Bangladesh
  • Australia
  • New Zealand
  • China
  • Japan
  • South Korea
  • GCC countries
  • South Africa
  • Israel
Key market segments
  • Threat Type
  • Service Type
  • Offering
  • Application
  • Enterprise Size
  • Application
  • Industry
  • Region
Key companies profiled
  • Thales
  • AT&T
  • IBM CORPORATION
  • Check Point Software Technologies
  • Atos SE
  • Arctic Wolf Networks
  • CloudFlare Inc.
  • Verizon
  • Fortinet Inc.
  • NTT

Segmentation Analysis of the security operation centre as a service Market

By Threat Type:

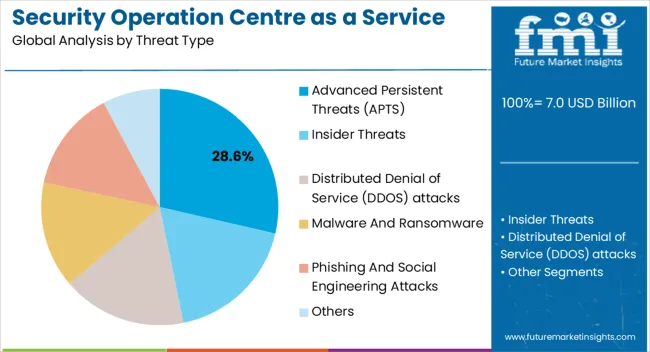
  • Advanced Persistent Threats (APTS)
  • Insider threats
  • Distributed Denial of Service (DDOS) attacks
  • Malware and ransomware
  • Phishing and social engineering attacks
  • Others

By Service Type:

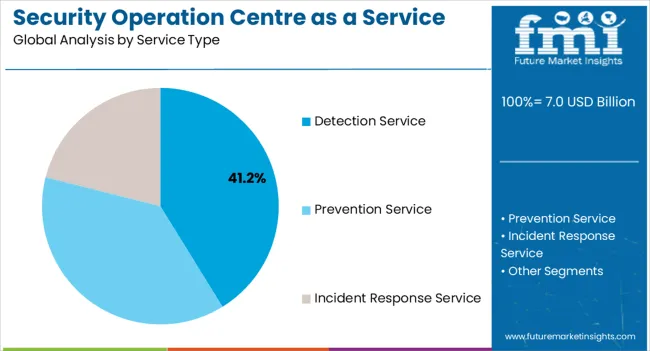
  • Prevention service
  • Detection service
  • Incident response service

By Offering:

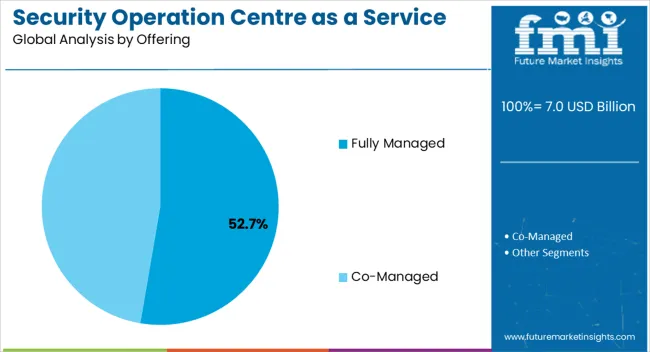
  • Fully managed
  • Co-managed

By Application:

  • Network security
  • Cloud Security
  • Endpoint Security
  • Application Security
  • Others

By Enterprise Size:

  • Large Enterprises
  • SMEs

By Industry:

  • BFSI
  • Healthcare
  • IT and Telecommunications
  • Retail and Consumer Goods
  • Media and Entertainment
  • Transportation and Logistics
  • Government
  • Manufacturing
  • Others

By Region:

  • North America
  • Latin America
  • Western Europe
  • Eastern Europe
  • South Asia and Pacific
  • East Asia
  • The Middle East and Africa

Frequently Asked Questions

What is the expected market value of the security operation centre as a service market outlook in 2024?

The global security operation centre as a service market is expected to reach US$ 7 billion by 2024.

What is the anticipated CAGR for the security operation centre as a service market through 2034?

The global security operation centre as a service market is set to expand at a CAGR of 10.90% by 2034.

What is the anticipated market value of the global security operation centre as a service market in 2034?

The global security operation centre as a service market is forecast to reach US$ 19.7 billion by 2034.

Which industry type is likely to dominate the security operation centre as a service market?

The BFSI segment is projected to gain a 25% share in 2024.

Which is the leading enterprise size in the security operation centre as a service market?

The large enterprise segment is likely to acquire a 62% share in 2024.

Table of Content

1. Executive Summary

    1.1. Global Market Outlook

    1.2. Demand-side Trends

    1.3. Supply-side Trends

    1.4. Technology Roadmap Analysis

    1.5. Analysis and Recommendations

2. Market Overview

    2.1. Market Coverage / Taxonomy

    2.2. Market Definition / Scope / Limitations

3. Market Background

    3.1. Market Dynamics

        3.1.1. Drivers

        3.1.2. Restraints

        3.1.3. Opportunity

        3.1.4. Trends

    3.2. Scenario Forecast

        3.2.1. Demand in Optimistic Scenario

        3.2.2. Demand in Likely Scenario

        3.2.3. Demand in Conservative Scenario

    3.3. Opportunity Map Analysis

    3.4. Investment Feasibility Matrix

    3.5. PESTLE and Porter’s Analysis

    3.6. Regulatory Landscape

        3.6.1. By Key Regions

        3.6.2. By Key Countries

    3.7. Regional Parent Market Outlook

4. Global Market Analysis 2019 to 2023 and Forecast, 2024 to 2034

    4.1. Historical Market Size Value (US$ Million) Analysis, 2019 to 2023

    4.2. Current and Future Market Size Value (US$ Million) Projections, 2024 to 2034

        4.2.1. Y-o-Y Growth Trend Analysis

        4.2.2. Absolute $ Opportunity Analysis

5. Global Market Analysis 2019 to 2023 and Forecast 2024 to 2034, By Threat Type

    5.1. Introduction / Key Findings

    5.2. Historical Market Size Value (US$ Million) Analysis By Threat Type, 2019 to 2023

    5.3. Current and Future Market Size Value (US$ Million) Analysis and Forecast By Threat Type, 2024 to 2034

        5.3.1. Advanced Persistent Threats

        5.3.2. Insider Threats

        5.3.3. Distributed Denial of Service (DDOS) Attacks

        5.3.4. Malware & Ransomware

        5.3.5. Phishing & Social Engineering Attacks

        5.3.6. Others

    5.4. Y-o-Y Growth Trend Analysis By Threat Type, 2019 to 2023

    5.5. Absolute $ Opportunity Analysis By Threat Type, 2024 to 2034

6. Global Market Analysis 2019 to 2023 and Forecast 2024 to 2034, By Service Type

    6.1. Introduction / Key Findings

    6.2. Historical Market Size Value (US$ Million) Analysis By Service Type, 2019 to 2023

    6.3. Current and Future Market Size Value (US$ Million) Analysis and Forecast By Service Type, 2024 to 2034

        6.3.1. Prevention Service

        6.3.2. Detection Service

        6.3.3. Incident Response Service

    6.4. Y-o-Y Growth Trend Analysis By Service Type, 2019 to 2023

    6.5. Absolute $ Opportunity Analysis By Service Type, 2024 to 2034

7. Global Market Analysis 2019 to 2023 and Forecast 2024 to 2034, By Offering

    7.1. Introduction / Key Findings

    7.2. Historical Market Size Value (US$ Million) Analysis By Offering, 2019 to 2023

    7.3. Current and Future Market Size Value (US$ Million) Analysis and Forecast By Offering, 2024 to 2034

        7.3.1. Fully Managed

        7.3.2. Co-Managed

    7.4. Y-o-Y Growth Trend Analysis By Offering, 2019 to 2023

    7.5. Absolute $ Opportunity Analysis By Offering, 2024 to 2034

8. Global Market Analysis 2019 to 2023 and Forecast 2024 to 2034, By Application

    8.1. Introduction / Key Findings

    8.2. Historical Market Size Value (US$ Million) Analysis By Application, 2019 to 2023

    8.3. Current and Future Market Size Value (US$ Million) Analysis and Forecast By Application, 2024 to 2034

        8.3.1. Network Security

        8.3.2. Cloud Security

        8.3.3. Endpoint Security

        8.3.4. Application Security

        8.3.5. Others

    8.4. Y-o-Y Growth Trend Analysis By Application, 2019 to 2023

    8.5. Absolute $ Opportunity Analysis By Application, 2024 to 2034

9. Global Market Analysis 2019 to 2023 and Forecast 2024 to 2034, By Enterprise Size

    9.1. Introduction / Key Findings

    9.2. Historical Market Size Value (US$ Million) Analysis By Enterprise Size, 2019 to 2023

    9.3. Current and Future Market Size Value (US$ Million) Analysis and Forecast By Enterprise Size, 2024 to 2034

        9.3.1. Large Enterprises

        9.3.2. SMEs

    9.4. Y-o-Y Growth Trend Analysis By Enterprise Size, 2019 to 2023

    9.5. Absolute $ Opportunity Analysis By Enterprise Size, 2024 to 2034

10. Global Market Analysis 2019 to 2023 and Forecast 2024 to 2034, By Industry

    10.1. Introduction / Key Findings

    10.2. Historical Market Size Value (US$ Million) Analysis By Industry, 2019 to 2023

    10.3. Current and Future Market Size Value (US$ Million) Analysis and Forecast By Industry, 2024 to 2034

        10.3.1. BFSI

        10.3.2. Healthcare

        10.3.3. IT & Telecommunications

        10.3.4. Retail & Consumer Goods

        10.3.5. Media & Entertainment

        10.3.6. Transportation and Logistics

        10.3.7. Government

        10.3.8. Manufacturing

        10.3.9. Others

    10.4. Y-o-Y Growth Trend Analysis By Industry, 2019 to 2023

    10.5. Absolute $ Opportunity Analysis By Industry, 2024 to 2034

11. Global Market Analysis 2019 to 2023 and Forecast 2024 to 2034, By Region

    11.1. Introduction

    11.2. Historical Market Size Value (US$ Million) Analysis By Region, 2019 to 2023

    11.3. Current Market Size Value (US$ Million) Analysis and Forecast By Region, 2024 to 2034

        11.3.1. North America

        11.3.2. Latin America

        11.3.3. Western Europe

        11.3.4. Eastern Europe

        11.3.5. South Asia and Pacific

        11.3.6. East Asia

        11.3.7. Middle East and Africa

    11.4. Market Attractiveness Analysis By Region

12. North America Market Analysis 2019 to 2023 and Forecast 2024 to 2034, By Country

    12.1. Historical Market Size Value (US$ Million) Trend Analysis By Market Taxonomy, 2019 to 2023

    12.2. Market Size Value (US$ Million) Forecast By Market Taxonomy, 2024 to 2034

        12.2.1. By Country

            12.2.1.1. USA

            12.2.1.2. Canada

        12.2.2. By Threat Type

        12.2.3. By Service Type

        12.2.4. By Offering

        12.2.5. By Application

        12.2.6. By Enterprise Size

        12.2.7. By Industry

    12.3. Market Attractiveness Analysis

        12.3.1. By Country

        12.3.2. By Threat Type

        12.3.3. By Service Type

        12.3.4. By Offering

        12.3.5. By Application

        12.3.6. By Enterprise Size

        12.3.7. By Industry

    12.4. Key Takeaways

13. Latin America Market Analysis 2019 to 2023 and Forecast 2024 to 2034, By Country

    13.1. Historical Market Size Value (US$ Million) Trend Analysis By Market Taxonomy, 2019 to 2023

    13.2. Market Size Value (US$ Million) Forecast By Market Taxonomy, 2024 to 2034

        13.2.1. By Country

            13.2.1.1. Brazil

            13.2.1.2. Mexico

            13.2.1.3. Rest of Latin America

        13.2.2. By Threat Type

        13.2.3. By Service Type

        13.2.4. By Offering

        13.2.5. By Application

        13.2.6. By Enterprise Size

        13.2.7. By Industry

    13.3. Market Attractiveness Analysis

        13.3.1. By Country

        13.3.2. By Threat Type

        13.3.3. By Service Type

        13.3.4. By Offering

        13.3.5. By Application

        13.3.6. By Enterprise Size

        13.3.7. By Industry

    13.4. Key Takeaways

14. Western Europe Market Analysis 2019 to 2023 and Forecast 2024 to 2034, By Country

    14.1. Historical Market Size Value (US$ Million) Trend Analysis By Market Taxonomy, 2019 to 2023

    14.2. Market Size Value (US$ Million) Forecast By Market Taxonomy, 2024 to 2034

        14.2.1. By Country

            14.2.1.1. Germany

            14.2.1.2. UK

            14.2.1.3. France

            14.2.1.4. Spain

            14.2.1.5. Italy

            14.2.1.6. Rest of Western Europe

        14.2.2. By Threat Type

        14.2.3. By Service Type

        14.2.4. By Offering

        14.2.5. By Application

        14.2.6. By Enterprise Size

        14.2.7. By Industry

    14.3. Market Attractiveness Analysis

        14.3.1. By Country

        14.3.2. By Threat Type

        14.3.3. By Service Type

        14.3.4. By Offering

        14.3.5. By Application

        14.3.6. By Enterprise Size

        14.3.7. By Industry

    14.4. Key Takeaways

15. Eastern Europe Market Analysis 2019 to 2023 and Forecast 2024 to 2034, By Country

    15.1. Historical Market Size Value (US$ Million) Trend Analysis By Market Taxonomy, 2019 to 2023

    15.2. Market Size Value (US$ Million) Forecast By Market Taxonomy, 2024 to 2034

        15.2.1. By Country

            15.2.1.1. Poland

            15.2.1.2. Russia

            15.2.1.3. Czech Republic

            15.2.1.4. Romania

            15.2.1.5. Rest of Eastern Europe

        15.2.2. By Threat Type

        15.2.3. By Service Type

        15.2.4. By Offering

        15.2.5. By Application

        15.2.6. By Enterprise Size

        15.2.7. By Industry

    15.3. Market Attractiveness Analysis

        15.3.1. By Country

        15.3.2. By Threat Type

        15.3.3. By Service Type

        15.3.4. By Offering

        15.3.5. By Application

        15.3.6. By Enterprise Size

        15.3.7. By Industry

    15.4. Key Takeaways

16. South Asia and Pacific Market Analysis 2019 to 2023 and Forecast 2024 to 2034, By Country

    16.1. Historical Market Size Value (US$ Million) Trend Analysis By Market Taxonomy, 2019 to 2023

    16.2. Market Size Value (US$ Million) Forecast By Market Taxonomy, 2024 to 2034

        16.2.1. By Country

            16.2.1.1. India

            16.2.1.2. Bangladesh

            16.2.1.3. Australia

            16.2.1.4. New Zealand

            16.2.1.5. Rest of South Asia and Pacific

        16.2.2. By Threat Type

        16.2.3. By Service Type

        16.2.4. By Offering

        16.2.5. By Application

        16.2.6. By Enterprise Size

        16.2.7. By Industry

    16.3. Market Attractiveness Analysis

        16.3.1. By Country

        16.3.2. By Threat Type

        16.3.3. By Service Type

        16.3.4. By Offering

        16.3.5. By Application

        16.3.6. By Enterprise Size

        16.3.7. By Industry

    16.4. Key Takeaways

17. East Asia Market Analysis 2019 to 2023 and Forecast 2024 to 2034, By Country

    17.1. Historical Market Size Value (US$ Million) Trend Analysis By Market Taxonomy, 2019 to 2023

    17.2. Market Size Value (US$ Million) Forecast By Market Taxonomy, 2024 to 2034

        17.2.1. By Country

            17.2.1.1. China

            17.2.1.2. Japan

            17.2.1.3. South Korea

        17.2.2. By Threat Type

        17.2.3. By Service Type

        17.2.4. By Offering

        17.2.5. By Application

        17.2.6. By Enterprise Size

        17.2.7. By Industry

    17.3. Market Attractiveness Analysis

        17.3.1. By Country

        17.3.2. By Threat Type

        17.3.3. By Service Type

        17.3.4. By Offering

        17.3.5. By Application

        17.3.6. By Enterprise Size

        17.3.7. By Industry

    17.4. Key Takeaways

18. Middle East and Africa Market Analysis 2019 to 2023 and Forecast 2024 to 2034, By Country

    18.1. Historical Market Size Value (US$ Million) Trend Analysis By Market Taxonomy, 2019 to 2023

    18.2. Market Size Value (US$ Million) Forecast By Market Taxonomy, 2024 to 2034

        18.2.1. By Country

            18.2.1.1. GCC Countries

            18.2.1.2. South Africa

            18.2.1.3. Israel

            18.2.1.4. Rest of MEA

        18.2.2. By Threat Type

        18.2.3. By Service Type

        18.2.4. By Offering

        18.2.5. By Application

        18.2.6. By Enterprise Size

        18.2.7. By Industry

    18.3. Market Attractiveness Analysis

        18.3.1. By Country

        18.3.2. By Threat Type

        18.3.3. By Service Type

        18.3.4. By Offering

        18.3.5. By Application

        18.3.6. By Enterprise Size

        18.3.7. By Industry

    18.4. Key Takeaways

19. Key Countries Market Analysis

    19.1. USA

        19.1.1. Pricing Analysis

        19.1.2. Market Share Analysis, 2023

            19.1.2.1. By Threat Type

            19.1.2.2. By Service Type

            19.1.2.3. By Offering

            19.1.2.4. By Application

            19.1.2.5. By Enterprise Size

            19.1.2.6. By Industry

    19.2. Canada

        19.2.1. Pricing Analysis

        19.2.2. Market Share Analysis, 2023

            19.2.2.1. By Threat Type

            19.2.2.2. By Service Type

            19.2.2.3. By Offering

            19.2.2.4. By Application

            19.2.2.5. By Enterprise Size

            19.2.2.6. By Industry

    19.3. Brazil

        19.3.1. Pricing Analysis

        19.3.2. Market Share Analysis, 2023

            19.3.2.1. By Threat Type

            19.3.2.2. By Service Type

            19.3.2.3. By Offering

            19.3.2.4. By Application

            19.3.2.5. By Enterprise Size

            19.3.2.6. By Industry

    19.4. Mexico

        19.4.1. Pricing Analysis

        19.4.2. Market Share Analysis, 2023

            19.4.2.1. By Threat Type

            19.4.2.2. By Service Type

            19.4.2.3. By Offering

            19.4.2.4. By Application

            19.4.2.5. By Enterprise Size

            19.4.2.6. By Industry

    19.5. Germany

        19.5.1. Pricing Analysis

        19.5.2. Market Share Analysis, 2023

            19.5.2.1. By Threat Type

            19.5.2.2. By Service Type

            19.5.2.3. By Offering

            19.5.2.4. By Application

            19.5.2.5. By Enterprise Size

            19.5.2.6. By Industry

    19.6. UK

        19.6.1. Pricing Analysis

        19.6.2. Market Share Analysis, 2023

            19.6.2.1. By Threat Type

            19.6.2.2. By Service Type

            19.6.2.3. By Offering

            19.6.2.4. By Application

            19.6.2.5. By Enterprise Size

            19.6.2.6. By Industry

    19.7. France

        19.7.1. Pricing Analysis

        19.7.2. Market Share Analysis, 2023

            19.7.2.1. By Threat Type

            19.7.2.2. By Service Type

            19.7.2.3. By Offering

            19.7.2.4. By Application

            19.7.2.5. By Enterprise Size

            19.7.2.6. By Industry

    19.8. Spain

        19.8.1. Pricing Analysis

        19.8.2. Market Share Analysis, 2023

            19.8.2.1. By Threat Type

            19.8.2.2. By Service Type

            19.8.2.3. By Offering

            19.8.2.4. By Application

            19.8.2.5. By Enterprise Size

            19.8.2.6. By Industry

    19.9. Italy

        19.9.1. Pricing Analysis

        19.9.2. Market Share Analysis, 2023

            19.9.2.1. By Threat Type

            19.9.2.2. By Service Type

            19.9.2.3. By Offering

            19.9.2.4. By Application

            19.9.2.5. By Enterprise Size

            19.9.2.6. By Industry

    19.10. Poland

        19.10.1. Pricing Analysis

        19.10.2. Market Share Analysis, 2023

            19.10.2.1. By Threat Type

            19.10.2.2. By Service Type

            19.10.2.3. By Offering

            19.10.2.4. By Application

            19.10.2.5. By Enterprise Size

            19.10.2.6. By Industry

    19.11. Russia

        19.11.1. Pricing Analysis

        19.11.2. Market Share Analysis, 2023

            19.11.2.1. By Threat Type

            19.11.2.2. By Service Type

            19.11.2.3. By Offering

            19.11.2.4. By Application

            19.11.2.5. By Enterprise Size

            19.11.2.6. By Industry

    19.12. Czech Republic

        19.12.1. Pricing Analysis

        19.12.2. Market Share Analysis, 2023

            19.12.2.1. By Threat Type

            19.12.2.2. By Service Type

            19.12.2.3. By Offering

            19.12.2.4. By Application

            19.12.2.5. By Enterprise Size

            19.12.2.6. By Industry

    19.13. Romania

        19.13.1. Pricing Analysis

        19.13.2. Market Share Analysis, 2023

            19.13.2.1. By Threat Type

            19.13.2.2. By Service Type

            19.13.2.3. By Offering

            19.13.2.4. By Application

            19.13.2.5. By Enterprise Size

            19.13.2.6. By Industry

    19.14. India

        19.14.1. Pricing Analysis

        19.14.2. Market Share Analysis, 2023

            19.14.2.1. By Threat Type

            19.14.2.2. By Service Type

            19.14.2.3. By Offering

            19.14.2.4. By Application

            19.14.2.5. By Enterprise Size

            19.14.2.6. By Industry

    19.15. Bangladesh

        19.15.1. Pricing Analysis

        19.15.2. Market Share Analysis, 2023

            19.15.2.1. By Threat Type

            19.15.2.2. By Service Type

            19.15.2.3. By Offering

            19.15.2.4. By Application

            19.15.2.5. By Enterprise Size

            19.15.2.6. By Industry

    19.16. Australia

        19.16.1. Pricing Analysis

        19.16.2. Market Share Analysis, 2023

            19.16.2.1. By Threat Type

            19.16.2.2. By Service Type

            19.16.2.3. By Offering

            19.16.2.4. By Application

            19.16.2.5. By Enterprise Size

            19.16.2.6. By Industry

    19.17. New Zealand

        19.17.1. Pricing Analysis

        19.17.2. Market Share Analysis, 2023

            19.17.2.1. By Threat Type

            19.17.2.2. By Service Type

            19.17.2.3. By Offering

            19.17.2.4. By Application

            19.17.2.5. By Enterprise Size

            19.17.2.6. By Industry

    19.18. China

        19.18.1. Pricing Analysis

        19.18.2. Market Share Analysis, 2023

            19.18.2.1. By Threat Type

            19.18.2.2. By Service Type

            19.18.2.3. By Offering

            19.18.2.4. By Application

            19.18.2.5. By Enterprise Size

            19.18.2.6. By Industry

    19.19. Japan

        19.19.1. Pricing Analysis

        19.19.2. Market Share Analysis, 2023

            19.19.2.1. By Threat Type

            19.19.2.2. By Service Type

            19.19.2.3. By Offering

            19.19.2.4. By Application

            19.19.2.5. By Enterprise Size

            19.19.2.6. By Industry

    19.20. South Korea

        19.20.1. Pricing Analysis

        19.20.2. Market Share Analysis, 2023

            19.20.2.1. By Threat Type

            19.20.2.2. By Service Type

            19.20.2.3. By Offering

            19.20.2.4. By Application

            19.20.2.5. By Enterprise Size

            19.20.2.6. By Industry

    19.21. GCC Countries

        19.21.1. Pricing Analysis

        19.21.2. Market Share Analysis, 2023

            19.21.2.1. By Threat Type

            19.21.2.2. By Service Type

            19.21.2.3. By Offering

            19.21.2.4. By Application

            19.21.2.5. By Enterprise Size

            19.21.2.6. By Industry

    19.22. South Africa

        19.22.1. Pricing Analysis

        19.22.2. Market Share Analysis, 2023

            19.22.2.1. By Threat Type

            19.22.2.2. By Service Type

            19.22.2.3. By Offering

            19.22.2.4. By Application

            19.22.2.5. By Enterprise Size

            19.22.2.6. By Industry

    19.23. Israel

        19.23.1. Pricing Analysis

        19.23.2. Market Share Analysis, 2023

            19.23.2.1. By Threat Type

            19.23.2.2. By Service Type

            19.23.2.3. By Offering

            19.23.2.4. By Application

            19.23.2.5. By Enterprise Size

            19.23.2.6. By Industry

20. Market Structure Analysis

    20.1. Competition Dashboard

    20.2. Competition Benchmarking

    20.3. Market Share Analysis of Top Players

        20.3.1. By Regional

        20.3.2. By Threat Type

        20.3.3. By Service Type

        20.3.4. By Offering

        20.3.5. By Application

        20.3.6. By Enterprise Size

        20.3.7. By Industry

21. Competition Analysis

    21.1. Competition Deep Dive

        21.1.1. Thales

            21.1.1.1. Overview

            21.1.1.2. Product Portfolio

            21.1.1.3. Profitability by Market Segments

            21.1.1.4. Sales Footprint

            21.1.1.5. Strategy Overview

                21.1.1.5.1. Marketing Strategy

        21.1.2. AT&T

            21.1.2.1. Overview

            21.1.2.2. Product Portfolio

            21.1.2.3. Profitability by Market Segments

            21.1.2.4. Sales Footprint

            21.1.2.5. Strategy Overview

                21.1.2.5.1. Marketing Strategy

        21.1.3. IBM CORPORATION

            21.1.3.1. Overview

            21.1.3.2. Product Portfolio

            21.1.3.3. Profitability by Market Segments

            21.1.3.4. Sales Footprint

            21.1.3.5. Strategy Overview

                21.1.3.5.1. Marketing Strategy

        21.1.4. Check Point Software Technologies

            21.1.4.1. Overview

            21.1.4.2. Product Portfolio

            21.1.4.3. Profitability by Market Segments

            21.1.4.4. Sales Footprint

            21.1.4.5. Strategy Overview

                21.1.4.5.1. Marketing Strategy

        21.1.5. Atos SE

            21.1.5.1. Overview

            21.1.5.2. Product Portfolio

            21.1.5.3. Profitability by Market Segments

            21.1.5.4. Sales Footprint

            21.1.5.5. Strategy Overview

                21.1.5.5.1. Marketing Strategy

        21.1.6. Arctic Wolf Networks

            21.1.6.1. Overview

            21.1.6.2. Product Portfolio

            21.1.6.3. Profitability by Market Segments

            21.1.6.4. Sales Footprint

            21.1.6.5. Strategy Overview

                21.1.6.5.1. Marketing Strategy

        21.1.7. Cloudflare, Inc

            21.1.7.1. Overview

            21.1.7.2. Product Portfolio

            21.1.7.3. Profitability by Market Segments

            21.1.7.4. Sales Footprint

            21.1.7.5. Strategy Overview

                21.1.7.5.1. Marketing Strategy

        21.1.8. Verizon

            21.1.8.1. Overview

            21.1.8.2. Product Portfolio

            21.1.8.3. Profitability by Market Segments

            21.1.8.4. Sales Footprint

            21.1.8.5. Strategy Overview

                21.1.8.5.1. Marketing Strategy

        21.1.9. Fortinet Inc

            21.1.9.1. Overview

            21.1.9.2. Product Portfolio

            21.1.9.3. Profitability by Market Segments

            21.1.9.4. Sales Footprint

            21.1.9.5. Strategy Overview

                21.1.9.5.1. Marketing Strategy

        21.1.10. NTT

            21.1.10.1. Overview

            21.1.10.2. Product Portfolio

            21.1.10.3. Profitability by Market Segments

            21.1.10.4. Sales Footprint

            21.1.10.5. Strategy Overview

                21.1.10.5.1. Marketing Strategy

22. Assumptions & Acronyms Used

23. Research Methodology

Don't pay for what you don't need

Customize your report by selecting specific countries or regions and save 30%!

List of Tables

Table 1: Global Market Value (US$ Million) Forecast by Region, 2019 to 2034

Table 2: Global Market Value (US$ Million) Forecast by Threat Type, 2019 to 2034

Table 3: Global Market Value (US$ Million) Forecast by Service Type, 2019 to 2034

Table 4: Global Market Value (US$ Million) Forecast by Offering, 2019 to 2034

Table 5: Global Market Value (US$ Million) Forecast by Application, 2019 to 2034

Table 6: Global Market Value (US$ Million) Forecast by Enterprise Size, 2019 to 2034

Table 7: Global Market Value (US$ Million) Forecast by Industry, 2019 to 2034

Table 8: North America Market Value (US$ Million) Forecast by Country, 2019 to 2034

Table 9: North America Market Value (US$ Million) Forecast by Threat Type, 2019 to 2034

Table 10: North America Market Value (US$ Million) Forecast by Service Type, 2019 to 2034

Table 11: North America Market Value (US$ Million) Forecast by Offering, 2019 to 2034

Table 12: North America Market Value (US$ Million) Forecast by Application, 2019 to 2034

Table 13: North America Market Value (US$ Million) Forecast by Enterprise Size, 2019 to 2034

Table 14: North America Market Value (US$ Million) Forecast by Industry, 2019 to 2034

Table 15: Latin America Market Value (US$ Million) Forecast by Country, 2019 to 2034

Table 16: Latin America Market Value (US$ Million) Forecast by Threat Type, 2019 to 2034

Table 17: Latin America Market Value (US$ Million) Forecast by Service Type, 2019 to 2034

Table 18: Latin America Market Value (US$ Million) Forecast by Offering, 2019 to 2034

Table 19: Latin America Market Value (US$ Million) Forecast by Application, 2019 to 2034

Table 20: Latin America Market Value (US$ Million) Forecast by Enterprise Size, 2019 to 2034

Table 21: Latin America Market Value (US$ Million) Forecast by Industry, 2019 to 2034

Table 22: Western Europe Market Value (US$ Million) Forecast by Country, 2019 to 2034

Table 23: Western Europe Market Value (US$ Million) Forecast by Threat Type, 2019 to 2034

Table 24: Western Europe Market Value (US$ Million) Forecast by Service Type, 2019 to 2034

Table 25: Western Europe Market Value (US$ Million) Forecast by Offering, 2019 to 2034

Table 26: Western Europe Market Value (US$ Million) Forecast by Application, 2019 to 2034

Table 27: Western Europe Market Value (US$ Million) Forecast by Enterprise Size, 2019 to 2034

Table 28: Western Europe Market Value (US$ Million) Forecast by Industry, 2019 to 2034

Table 29: Eastern Europe Market Value (US$ Million) Forecast by Country, 2019 to 2034

Table 30: Eastern Europe Market Value (US$ Million) Forecast by Threat Type, 2019 to 2034

Table 31: Eastern Europe Market Value (US$ Million) Forecast by Service Type, 2019 to 2034

Table 32: Eastern Europe Market Value (US$ Million) Forecast by Offering, 2019 to 2034

Table 33: Eastern Europe Market Value (US$ Million) Forecast by Application, 2019 to 2034

Table 34: Eastern Europe Market Value (US$ Million) Forecast by Enterprise Size, 2019 to 2034

Table 35: Eastern Europe Market Value (US$ Million) Forecast by Industry, 2019 to 2034

Table 36: South Asia and Pacific Market Value (US$ Million) Forecast by Country, 2019 to 2034

Table 37: South Asia and Pacific Market Value (US$ Million) Forecast by Threat Type, 2019 to 2034

Table 38: South Asia and Pacific Market Value (US$ Million) Forecast by Service Type, 2019 to 2034

Table 39: South Asia and Pacific Market Value (US$ Million) Forecast by Offering, 2019 to 2034

Table 40: South Asia and Pacific Market Value (US$ Million) Forecast by Application, 2019 to 2034

Table 41: South Asia and Pacific Market Value (US$ Million) Forecast by Enterprise Size, 2019 to 2034

Table 42: South Asia and Pacific Market Value (US$ Million) Forecast by Industry, 2019 to 2034

Table 43: East Asia Market Value (US$ Million) Forecast by Country, 2019 to 2034

Table 44: East Asia Market Value (US$ Million) Forecast by Threat Type, 2019 to 2034

Table 45: East Asia Market Value (US$ Million) Forecast by Service Type, 2019 to 2034

Table 46: East Asia Market Value (US$ Million) Forecast by Offering, 2019 to 2034

Table 47: East Asia Market Value (US$ Million) Forecast by Application, 2019 to 2034

Table 48: East Asia Market Value (US$ Million) Forecast by Enterprise Size, 2019 to 2034

Table 49: East Asia Market Value (US$ Million) Forecast by Industry, 2019 to 2034

Table 50: Middle East and Africa Market Value (US$ Million) Forecast by Country, 2019 to 2034

Table 51: Middle East and Africa Market Value (US$ Million) Forecast by Threat Type, 2019 to 2034

Table 52: Middle East and Africa Market Value (US$ Million) Forecast by Service Type, 2019 to 2034

Table 53: Middle East and Africa Market Value (US$ Million) Forecast by Offering, 2019 to 2034

Table 54: Middle East and Africa Market Value (US$ Million) Forecast by Application, 2019 to 2034

Table 55: Middle East and Africa Market Value (US$ Million) Forecast by Enterprise Size, 2019 to 2034

Table 56: Middle East and Africa Market Value (US$ Million) Forecast by Industry, 2019 to 2034
Sudip Saha
Sudip Saha

Principal Consultant

Talk to Analyst

Find your sweet spots for generating winning opportunities in this market.

List of Charts

Figure 1: Global Market Value (US$ Million) by Threat Type, 2024 to 2034

Figure 2: Global Market Value (US$ Million) by Service Type, 2024 to 2034

Figure 3: Global Market Value (US$ Million) by Offering, 2024 to 2034

Figure 4: Global Market Value (US$ Million) by Application, 2024 to 2034

Figure 5: Global Market Value (US$ Million) by Enterprise Size, 2024 to 2034

Figure 6: Global Market Value (US$ Million) by Industry, 2024 to 2034

Figure 7: Global Market Value (US$ Million) by Region, 2024 to 2034

Figure 8: Global Market Value (US$ Million) Analysis by Region, 2019 to 2034

Figure 9: Global Market Value Share (%) and BPS Analysis by Region, 2024 to 2034

Figure 10: Global Market Y-o-Y Growth (%) Projections by Region, 2024 to 2034

Figure 11: Global Market Value (US$ Million) Analysis by Threat Type, 2019 to 2034

Figure 12: Global Market Value Share (%) and BPS Analysis by Threat Type, 2024 to 2034

Figure 13: Global Market Y-o-Y Growth (%) Projections by Threat Type, 2024 to 2034

Figure 14: Global Market Value (US$ Million) Analysis by Service Type, 2019 to 2034

Figure 15: Global Market Value Share (%) and BPS Analysis by Service Type, 2024 to 2034

Figure 16: Global Market Y-o-Y Growth (%) Projections by Service Type, 2024 to 2034

Figure 17: Global Market Value (US$ Million) Analysis by Offering, 2019 to 2034

Figure 18: Global Market Value Share (%) and BPS Analysis by Offering, 2024 to 2034

Figure 19: Global Market Y-o-Y Growth (%) Projections by Offering, 2024 to 2034

Figure 20: Global Market Value (US$ Million) Analysis by Application, 2019 to 2034

Figure 21: Global Market Value Share (%) and BPS Analysis by Application, 2024 to 2034

Figure 22: Global Market Y-o-Y Growth (%) Projections by Application, 2024 to 2034

Figure 23: Global Market Value (US$ Million) Analysis by Enterprise Size, 2019 to 2034

Figure 24: Global Market Value Share (%) and BPS Analysis by Enterprise Size, 2024 to 2034

Figure 25: Global Market Y-o-Y Growth (%) Projections by Enterprise Size, 2024 to 2034

Figure 26: Global Market Value (US$ Million) Analysis by Industry, 2019 to 2034

Figure 27: Global Market Value Share (%) and BPS Analysis by Industry, 2024 to 2034

Figure 28: Global Market Y-o-Y Growth (%) Projections by Industry, 2024 to 2034

Figure 29: Global Market Attractiveness by Threat Type, 2024 to 2034

Figure 30: Global Market Attractiveness by Service Type, 2024 to 2034

Figure 31: Global Market Attractiveness by Offering, 2024 to 2034

Figure 32: Global Market Attractiveness by Application, 2024 to 2034

Figure 33: Global Market Attractiveness by Enterprise Size, 2024 to 2034

Figure 34: Global Market Attractiveness by Industry, 2024 to 2034

Figure 35: Global Market Attractiveness by Region, 2024 to 2034

Figure 36: North America Market Value (US$ Million) by Threat Type, 2024 to 2034

Figure 37: North America Market Value (US$ Million) by Service Type, 2024 to 2034

Figure 38: North America Market Value (US$ Million) by Offering, 2024 to 2034

Figure 39: North America Market Value (US$ Million) by Application, 2024 to 2034

Figure 40: North America Market Value (US$ Million) by Enterprise Size, 2024 to 2034

Figure 41: North America Market Value (US$ Million) by Industry, 2024 to 2034

Figure 42: North America Market Value (US$ Million) by Country, 2024 to 2034

Figure 43: North America Market Value (US$ Million) Analysis by Country, 2019 to 2034

Figure 44: North America Market Value Share (%) and BPS Analysis by Country, 2024 to 2034

Figure 45: North America Market Y-o-Y Growth (%) Projections by Country, 2024 to 2034

Figure 46: North America Market Value (US$ Million) Analysis by Threat Type, 2019 to 2034

Figure 47: North America Market Value Share (%) and BPS Analysis by Threat Type, 2024 to 2034

Figure 48: North America Market Y-o-Y Growth (%) Projections by Threat Type, 2024 to 2034

Figure 49: North America Market Value (US$ Million) Analysis by Service Type, 2019 to 2034

Figure 50: North America Market Value Share (%) and BPS Analysis by Service Type, 2024 to 2034

Figure 51: North America Market Y-o-Y Growth (%) Projections by Service Type, 2024 to 2034

Figure 52: North America Market Value (US$ Million) Analysis by Offering, 2019 to 2034

Figure 53: North America Market Value Share (%) and BPS Analysis by Offering, 2024 to 2034

Figure 54: North America Market Y-o-Y Growth (%) Projections by Offering, 2024 to 2034

Figure 55: North America Market Value (US$ Million) Analysis by Application, 2019 to 2034

Figure 56: North America Market Value Share (%) and BPS Analysis by Application, 2024 to 2034

Figure 57: North America Market Y-o-Y Growth (%) Projections by Application, 2024 to 2034

Figure 58: North America Market Value (US$ Million) Analysis by Enterprise Size, 2019 to 2034

Figure 59: North America Market Value Share (%) and BPS Analysis by Enterprise Size, 2024 to 2034

Figure 60: North America Market Y-o-Y Growth (%) Projections by Enterprise Size, 2024 to 2034

Figure 61: North America Market Value (US$ Million) Analysis by Industry, 2019 to 2034

Figure 62: North America Market Value Share (%) and BPS Analysis by Industry, 2024 to 2034

Figure 63: North America Market Y-o-Y Growth (%) Projections by Industry, 2024 to 2034

Figure 64: North America Market Attractiveness by Threat Type, 2024 to 2034

Figure 65: North America Market Attractiveness by Service Type, 2024 to 2034

Figure 66: North America Market Attractiveness by Offering, 2024 to 2034

Figure 67: North America Market Attractiveness by Application, 2024 to 2034

Figure 68: North America Market Attractiveness by Enterprise Size, 2024 to 2034

Figure 69: North America Market Attractiveness by Industry, 2024 to 2034

Figure 70: North America Market Attractiveness by Country, 2024 to 2034

Figure 71: Latin America Market Value (US$ Million) by Threat Type, 2024 to 2034

Figure 72: Latin America Market Value (US$ Million) by Service Type, 2024 to 2034

Figure 73: Latin America Market Value (US$ Million) by Offering, 2024 to 2034

Figure 74: Latin America Market Value (US$ Million) by Application, 2024 to 2034

Figure 75: Latin America Market Value (US$ Million) by Enterprise Size, 2024 to 2034

Figure 76: Latin America Market Value (US$ Million) by Industry, 2024 to 2034

Figure 77: Latin America Market Value (US$ Million) by Country, 2024 to 2034

Figure 78: Latin America Market Value (US$ Million) Analysis by Country, 2019 to 2034

Figure 79: Latin America Market Value Share (%) and BPS Analysis by Country, 2024 to 2034

Figure 80: Latin America Market Y-o-Y Growth (%) Projections by Country, 2024 to 2034

Figure 81: Latin America Market Value (US$ Million) Analysis by Threat Type, 2019 to 2034

Figure 82: Latin America Market Value Share (%) and BPS Analysis by Threat Type, 2024 to 2034

Figure 83: Latin America Market Y-o-Y Growth (%) Projections by Threat Type, 2024 to 2034

Figure 84: Latin America Market Value (US$ Million) Analysis by Service Type, 2019 to 2034

Figure 85: Latin America Market Value Share (%) and BPS Analysis by Service Type, 2024 to 2034

Figure 86: Latin America Market Y-o-Y Growth (%) Projections by Service Type, 2024 to 2034

Figure 87: Latin America Market Value (US$ Million) Analysis by Offering, 2019 to 2034

Figure 88: Latin America Market Value Share (%) and BPS Analysis by Offering, 2024 to 2034

Figure 89: Latin America Market Y-o-Y Growth (%) Projections by Offering, 2024 to 2034

Figure 90: Latin America Market Value (US$ Million) Analysis by Application, 2019 to 2034

Figure 91: Latin America Market Value Share (%) and BPS Analysis by Application, 2024 to 2034

Figure 92: Latin America Market Y-o-Y Growth (%) Projections by Application, 2024 to 2034

Figure 93: Latin America Market Value (US$ Million) Analysis by Enterprise Size, 2019 to 2034

Figure 94: Latin America Market Value Share (%) and BPS Analysis by Enterprise Size, 2024 to 2034

Figure 95: Latin America Market Y-o-Y Growth (%) Projections by Enterprise Size, 2024 to 2034

Figure 96: Latin America Market Value (US$ Million) Analysis by Industry, 2019 to 2034

Figure 97: Latin America Market Value Share (%) and BPS Analysis by Industry, 2024 to 2034

Figure 98: Latin America Market Y-o-Y Growth (%) Projections by Industry, 2024 to 2034

Figure 99: Latin America Market Attractiveness by Threat Type, 2024 to 2034

Figure 100: Latin America Market Attractiveness by Service Type, 2024 to 2034

Figure 101: Latin America Market Attractiveness by Offering, 2024 to 2034

Figure 102: Latin America Market Attractiveness by Application, 2024 to 2034

Figure 103: Latin America Market Attractiveness by Enterprise Size, 2024 to 2034

Figure 104: Latin America Market Attractiveness by Industry, 2024 to 2034

Figure 105: Latin America Market Attractiveness by Country, 2024 to 2034

Figure 106: Western Europe Market Value (US$ Million) by Threat Type, 2024 to 2034

Figure 107: Western Europe Market Value (US$ Million) by Service Type, 2024 to 2034

Figure 108: Western Europe Market Value (US$ Million) by Offering, 2024 to 2034

Figure 109: Western Europe Market Value (US$ Million) by Application, 2024 to 2034

Figure 110: Western Europe Market Value (US$ Million) by Enterprise Size, 2024 to 2034

Figure 111: Western Europe Market Value (US$ Million) by Industry, 2024 to 2034

Figure 112: Western Europe Market Value (US$ Million) by Country, 2024 to 2034

Figure 113: Western Europe Market Value (US$ Million) Analysis by Country, 2019 to 2034

Figure 114: Western Europe Market Value Share (%) and BPS Analysis by Country, 2024 to 2034

Figure 115: Western Europe Market Y-o-Y Growth (%) Projections by Country, 2024 to 2034

Figure 116: Western Europe Market Value (US$ Million) Analysis by Threat Type, 2019 to 2034

Figure 117: Western Europe Market Value Share (%) and BPS Analysis by Threat Type, 2024 to 2034

Figure 118: Western Europe Market Y-o-Y Growth (%) Projections by Threat Type, 2024 to 2034

Figure 119: Western Europe Market Value (US$ Million) Analysis by Service Type, 2019 to 2034

Figure 120: Western Europe Market Value Share (%) and BPS Analysis by Service Type, 2024 to 2034

Figure 121: Western Europe Market Y-o-Y Growth (%) Projections by Service Type, 2024 to 2034

Figure 122: Western Europe Market Value (US$ Million) Analysis by Offering, 2019 to 2034

Figure 123: Western Europe Market Value Share (%) and BPS Analysis by Offering, 2024 to 2034

Figure 124: Western Europe Market Y-o-Y Growth (%) Projections by Offering, 2024 to 2034

Figure 125: Western Europe Market Value (US$ Million) Analysis by Application, 2019 to 2034

Figure 126: Western Europe Market Value Share (%) and BPS Analysis by Application, 2024 to 2034

Figure 127: Western Europe Market Y-o-Y Growth (%) Projections by Application, 2024 to 2034

Figure 128: Western Europe Market Value (US$ Million) Analysis by Enterprise Size, 2019 to 2034

Figure 129: Western Europe Market Value Share (%) and BPS Analysis by Enterprise Size, 2024 to 2034

Figure 130: Western Europe Market Y-o-Y Growth (%) Projections by Enterprise Size, 2024 to 2034

Figure 131: Western Europe Market Value (US$ Million) Analysis by Industry, 2019 to 2034

Figure 132: Western Europe Market Value Share (%) and BPS Analysis by Industry, 2024 to 2034

Figure 133: Western Europe Market Y-o-Y Growth (%) Projections by Industry, 2024 to 2034

Figure 134: Western Europe Market Attractiveness by Threat Type, 2024 to 2034

Figure 135: Western Europe Market Attractiveness by Service Type, 2024 to 2034

Figure 136: Western Europe Market Attractiveness by Offering, 2024 to 2034

Figure 137: Western Europe Market Attractiveness by Application, 2024 to 2034

Figure 138: Western Europe Market Attractiveness by Enterprise Size, 2024 to 2034

Figure 139: Western Europe Market Attractiveness by Industry, 2024 to 2034

Figure 140: Western Europe Market Attractiveness by Country, 2024 to 2034

Figure 141: Eastern Europe Market Value (US$ Million) by Threat Type, 2024 to 2034

Figure 142: Eastern Europe Market Value (US$ Million) by Service Type, 2024 to 2034

Figure 143: Eastern Europe Market Value (US$ Million) by Offering, 2024 to 2034

Figure 144: Eastern Europe Market Value (US$ Million) by Application, 2024 to 2034

Figure 145: Eastern Europe Market Value (US$ Million) by Enterprise Size, 2024 to 2034

Figure 146: Eastern Europe Market Value (US$ Million) by Industry, 2024 to 2034

Figure 147: Eastern Europe Market Value (US$ Million) by Country, 2024 to 2034

Figure 148: Eastern Europe Market Value (US$ Million) Analysis by Country, 2019 to 2034

Figure 149: Eastern Europe Market Value Share (%) and BPS Analysis by Country, 2024 to 2034

Figure 150: Eastern Europe Market Y-o-Y Growth (%) Projections by Country, 2024 to 2034

Figure 151: Eastern Europe Market Value (US$ Million) Analysis by Threat Type, 2019 to 2034

Figure 152: Eastern Europe Market Value Share (%) and BPS Analysis by Threat Type, 2024 to 2034

Figure 153: Eastern Europe Market Y-o-Y Growth (%) Projections by Threat Type, 2024 to 2034

Figure 154: Eastern Europe Market Value (US$ Million) Analysis by Service Type, 2019 to 2034

Figure 155: Eastern Europe Market Value Share (%) and BPS Analysis by Service Type, 2024 to 2034

Figure 156: Eastern Europe Market Y-o-Y Growth (%) Projections by Service Type, 2024 to 2034

Figure 157: Eastern Europe Market Value (US$ Million) Analysis by Offering, 2019 to 2034

Figure 158: Eastern Europe Market Value Share (%) and BPS Analysis by Offering, 2024 to 2034

Figure 159: Eastern Europe Market Y-o-Y Growth (%) Projections by Offering, 2024 to 2034

Figure 160: Eastern Europe Market Value (US$ Million) Analysis by Application, 2019 to 2034

Figure 161: Eastern Europe Market Value Share (%) and BPS Analysis by Application, 2024 to 2034

Figure 162: Eastern Europe Market Y-o-Y Growth (%) Projections by Application, 2024 to 2034

Figure 163: Eastern Europe Market Value (US$ Million) Analysis by Enterprise Size, 2019 to 2034

Figure 164: Eastern Europe Market Value Share (%) and BPS Analysis by Enterprise Size, 2024 to 2034

Figure 165: Eastern Europe Market Y-o-Y Growth (%) Projections by Enterprise Size, 2024 to 2034

Figure 166: Eastern Europe Market Value (US$ Million) Analysis by Industry, 2019 to 2034

Figure 167: Eastern Europe Market Value Share (%) and BPS Analysis by Industry, 2024 to 2034

Figure 168: Eastern Europe Market Y-o-Y Growth (%) Projections by Industry, 2024 to 2034

Figure 169: Eastern Europe Market Attractiveness by Threat Type, 2024 to 2034

Figure 170: Eastern Europe Market Attractiveness by Service Type, 2024 to 2034

Figure 171: Eastern Europe Market Attractiveness by Offering, 2024 to 2034

Figure 172: Eastern Europe Market Attractiveness by Application, 2024 to 2034

Figure 173: Eastern Europe Market Attractiveness by Enterprise Size, 2024 to 2034

Figure 174: Eastern Europe Market Attractiveness by Industry, 2024 to 2034

Figure 175: Eastern Europe Market Attractiveness by Country, 2024 to 2034

Figure 176: South Asia and Pacific Market Value (US$ Million) by Threat Type, 2024 to 2034

Figure 177: South Asia and Pacific Market Value (US$ Million) by Service Type, 2024 to 2034

Figure 178: South Asia and Pacific Market Value (US$ Million) by Offering, 2024 to 2034

Figure 179: South Asia and Pacific Market Value (US$ Million) by Application, 2024 to 2034

Figure 180: South Asia and Pacific Market Value (US$ Million) by Enterprise Size, 2024 to 2034

Figure 181: South Asia and Pacific Market Value (US$ Million) by Industry, 2024 to 2034

Figure 182: South Asia and Pacific Market Value (US$ Million) by Country, 2024 to 2034

Figure 183: South Asia and Pacific Market Value (US$ Million) Analysis by Country, 2019 to 2034

Figure 184: South Asia and Pacific Market Value Share (%) and BPS Analysis by Country, 2024 to 2034

Figure 185: South Asia and Pacific Market Y-o-Y Growth (%) Projections by Country, 2024 to 2034

Figure 186: South Asia and Pacific Market Value (US$ Million) Analysis by Threat Type, 2019 to 2034

Figure 187: South Asia and Pacific Market Value Share (%) and BPS Analysis by Threat Type, 2024 to 2034

Figure 188: South Asia and Pacific Market Y-o-Y Growth (%) Projections by Threat Type, 2024 to 2034

Figure 189: South Asia and Pacific Market Value (US$ Million) Analysis by Service Type, 2019 to 2034

Figure 190: South Asia and Pacific Market Value Share (%) and BPS Analysis by Service Type, 2024 to 2034

Figure 191: South Asia and Pacific Market Y-o-Y Growth (%) Projections by Service Type, 2024 to 2034

Figure 192: South Asia and Pacific Market Value (US$ Million) Analysis by Offering, 2019 to 2034

Figure 193: South Asia and Pacific Market Value Share (%) and BPS Analysis by Offering, 2024 to 2034

Figure 194: South Asia and Pacific Market Y-o-Y Growth (%) Projections by Offering, 2024 to 2034

Figure 195: South Asia and Pacific Market Value (US$ Million) Analysis by Application, 2019 to 2034

Figure 196: South Asia and Pacific Market Value Share (%) and BPS Analysis by Application, 2024 to 2034

Figure 197: South Asia and Pacific Market Y-o-Y Growth (%) Projections by Application, 2024 to 2034

Figure 198: South Asia and Pacific Market Value (US$ Million) Analysis by Enterprise Size, 2019 to 2034

Figure 199: South Asia and Pacific Market Value Share (%) and BPS Analysis by Enterprise Size, 2024 to 2034

Figure 200: South Asia and Pacific Market Y-o-Y Growth (%) Projections by Enterprise Size, 2024 to 2034

Figure 201: South Asia and Pacific Market Value (US$ Million) Analysis by Industry, 2019 to 2034

Figure 202: South Asia and Pacific Market Value Share (%) and BPS Analysis by Industry, 2024 to 2034

Figure 203: South Asia and Pacific Market Y-o-Y Growth (%) Projections by Industry, 2024 to 2034

Figure 204: South Asia and Pacific Market Attractiveness by Threat Type, 2024 to 2034

Figure 205: South Asia and Pacific Market Attractiveness by Service Type, 2024 to 2034

Figure 206: South Asia and Pacific Market Attractiveness by Offering, 2024 to 2034

Figure 207: South Asia and Pacific Market Attractiveness by Application, 2024 to 2034

Figure 208: South Asia and Pacific Market Attractiveness by Enterprise Size, 2024 to 2034

Figure 209: South Asia and Pacific Market Attractiveness by Industry, 2024 to 2034

Figure 210: South Asia and Pacific Market Attractiveness by Country, 2024 to 2034

Figure 211: East Asia Market Value (US$ Million) by Threat Type, 2024 to 2034

Figure 212: East Asia Market Value (US$ Million) by Service Type, 2024 to 2034

Figure 213: East Asia Market Value (US$ Million) by Offering, 2024 to 2034

Figure 214: East Asia Market Value (US$ Million) by Application, 2024 to 2034

Figure 215: East Asia Market Value (US$ Million) by Enterprise Size, 2024 to 2034

Figure 216: East Asia Market Value (US$ Million) by Industry, 2024 to 2034

Figure 217: East Asia Market Value (US$ Million) by Country, 2024 to 2034

Figure 218: East Asia Market Value (US$ Million) Analysis by Country, 2019 to 2034

Figure 219: East Asia Market Value Share (%) and BPS Analysis by Country, 2024 to 2034

Figure 220: East Asia Market Y-o-Y Growth (%) Projections by Country, 2024 to 2034

Figure 221: East Asia Market Value (US$ Million) Analysis by Threat Type, 2019 to 2034

Figure 222: East Asia Market Value Share (%) and BPS Analysis by Threat Type, 2024 to 2034

Figure 223: East Asia Market Y-o-Y Growth (%) Projections by Threat Type, 2024 to 2034

Figure 224: East Asia Market Value (US$ Million) Analysis by Service Type, 2019 to 2034

Figure 225: East Asia Market Value Share (%) and BPS Analysis by Service Type, 2024 to 2034

Figure 226: East Asia Market Y-o-Y Growth (%) Projections by Service Type, 2024 to 2034

Figure 227: East Asia Market Value (US$ Million) Analysis by Offering, 2019 to 2034

Figure 228: East Asia Market Value Share (%) and BPS Analysis by Offering, 2024 to 2034

Figure 229: East Asia Market Y-o-Y Growth (%) Projections by Offering, 2024 to 2034

Figure 230: East Asia Market Value (US$ Million) Analysis by Application, 2019 to 2034

Figure 231: East Asia Market Value Share (%) and BPS Analysis by Application, 2024 to 2034

Figure 232: East Asia Market Y-o-Y Growth (%) Projections by Application, 2024 to 2034

Figure 233: East Asia Market Value (US$ Million) Analysis by Enterprise Size, 2019 to 2034

Figure 234: East Asia Market Value Share (%) and BPS Analysis by Enterprise Size, 2024 to 2034

Figure 235: East Asia Market Y-o-Y Growth (%) Projections by Enterprise Size, 2024 to 2034

Figure 236: East Asia Market Value (US$ Million) Analysis by Industry, 2019 to 2034

Figure 237: East Asia Market Value Share (%) and BPS Analysis by Industry, 2024 to 2034

Figure 238: East Asia Market Y-o-Y Growth (%) Projections by Industry, 2024 to 2034

Figure 239: East Asia Market Attractiveness by Threat Type, 2024 to 2034

Figure 240: East Asia Market Attractiveness by Service Type, 2024 to 2034

Figure 241: East Asia Market Attractiveness by Offering, 2024 to 2034

Figure 242: East Asia Market Attractiveness by Application, 2024 to 2034

Figure 243: East Asia Market Attractiveness by Enterprise Size, 2024 to 2034

Figure 244: East Asia Market Attractiveness by Industry, 2024 to 2034

Figure 245: East Asia Market Attractiveness by Country, 2024 to 2034

Figure 246: Middle East and Africa Market Value (US$ Million) by Threat Type, 2024 to 2034

Figure 247: Middle East and Africa Market Value (US$ Million) by Service Type, 2024 to 2034

Figure 248: Middle East and Africa Market Value (US$ Million) by Offering, 2024 to 2034

Figure 249: Middle East and Africa Market Value (US$ Million) by Application, 2024 to 2034

Figure 250: Middle East and Africa Market Value (US$ Million) by Enterprise Size, 2024 to 2034

Figure 251: Middle East and Africa Market Value (US$ Million) by Industry, 2024 to 2034

Figure 252: Middle East and Africa Market Value (US$ Million) by Country, 2024 to 2034

Figure 253: Middle East and Africa Market Value (US$ Million) Analysis by Country, 2019 to 2034

Figure 254: Middle East and Africa Market Value Share (%) and BPS Analysis by Country, 2024 to 2034

Figure 255: Middle East and Africa Market Y-o-Y Growth (%) Projections by Country, 2024 to 2034

Figure 256: Middle East and Africa Market Value (US$ Million) Analysis by Threat Type, 2019 to 2034

Figure 257: Middle East and Africa Market Value Share (%) and BPS Analysis by Threat Type, 2024 to 2034

Figure 258: Middle East and Africa Market Y-o-Y Growth (%) Projections by Threat Type, 2024 to 2034

Figure 259: Middle East and Africa Market Value (US$ Million) Analysis by Service Type, 2019 to 2034

Figure 260: Middle East and Africa Market Value Share (%) and BPS Analysis by Service Type, 2024 to 2034

Figure 261: Middle East and Africa Market Y-o-Y Growth (%) Projections by Service Type, 2024 to 2034

Figure 262: Middle East and Africa Market Value (US$ Million) Analysis by Offering, 2019 to 2034

Figure 263: Middle East and Africa Market Value Share (%) and BPS Analysis by Offering, 2024 to 2034

Figure 264: Middle East and Africa Market Y-o-Y Growth (%) Projections by Offering, 2024 to 2034

Figure 265: Middle East and Africa Market Value (US$ Million) Analysis by Application, 2019 to 2034

Figure 266: Middle East and Africa Market Value Share (%) and BPS Analysis by Application, 2024 to 2034

Figure 267: Middle East and Africa Market Y-o-Y Growth (%) Projections by Application, 2024 to 2034

Figure 268: Middle East and Africa Market Value (US$ Million) Analysis by Enterprise Size, 2019 to 2034

Figure 269: Middle East and Africa Market Value Share (%) and BPS Analysis by Enterprise Size, 2024 to 2034

Figure 270: Middle East and Africa Market Y-o-Y Growth (%) Projections by Enterprise Size, 2024 to 2034

Figure 271: Middle East and Africa Market Value (US$ Million) Analysis by Industry, 2019 to 2034

Figure 272: Middle East and Africa Market Value Share (%) and BPS Analysis by Industry, 2024 to 2034

Figure 273: Middle East and Africa Market Y-o-Y Growth (%) Projections by Industry, 2024 to 2034

Figure 274: Middle East and Africa Market Attractiveness by Threat Type, 2024 to 2034

Figure 275: Middle East and Africa Market Attractiveness by Service Type, 2024 to 2034

Figure 276: Middle East and Africa Market Attractiveness by Offering, 2024 to 2034

Figure 277: Middle East and Africa Market Attractiveness by Application, 2024 to 2034

Figure 278: Middle East and Africa Market Attractiveness by Enterprise Size, 2024 to 2034

Figure 279: Middle East and Africa Market Attractiveness by Industry, 2024 to 2034

Figure 280: Middle East and Africa Market Attractiveness by Country, 2024 to 2034

Recommendations

Technology

Business Process as a Service (BPaaS) Market

Published : July 2023

Technology

Unified Communication as a Service (UCaaS) Market

Published : January 2023

Technology

Biometric-as-a-Service Market

Published : November 2022

Explore Technology Insights

View Reports

Security Operation Centre as a Service Market