

- Market Size (2026)
- USD 10.6 Bn
- Forecast (2036)
- USD 40.2 Bn
- CAGR (2026 to 2036)
- 14.3%
Start Stop System Market Size, Forecast, and Outlook By FMI
Summary of the Start Stop System Market
- Demand and Growth Drivers
- Emission reduction regulations in the EU, USA, and Asia-Pacific are mandating idle-stop technology as standard equipment in passenger vehicles, creating a compliance-driven procurement cycle.
- Growth in urban commuting, where vehicles spend significant time at idle, is increasing the fuel savings and emission reduction impact of start-stop systems, supporting consumer acceptance.
- OEM integration of enhanced starter motors, AGM batteries, and DC-DC converters is raising system content and average selling prices across vehicle platforms.
- Product and Segment View
- Passenger cars is expected to account for 48.0% of the vehicle type segment in 2026, reflecting concentrated procurement in primary end-use categories.
- Gasoline is expected to account for 44.0% of the fuel type segment in 2026, reflecting concentrated procurement in primary end-use categories.
- OEM is expected to account for 56.0% of the sales channel segment in 2026, reflecting concentrated procurement in primary end-use categories.
- Geography and Competitive Outlook
- Germany is expected to lead growth at 16.9% CAGR, supported by strong end-use demand and regulatory drivers across primary application segments.
- USA at 14.7% CAGR reflects sustained procurement activity driven by compliance requirements and infrastructure investment.
- Continental AG maintains a leading competitive position through integrated manufacturing capabilities and established distribution networks across key regions.
- Analyst Opinion
- Nikhil Kaitwade, Principal Consultant at FMI says, 'Companies that can scale production capacity while maintaining consistent product quality across application segments are expected to strengthen their position over the forecast period. The start stop system market is transitioning toward a specification-driven procurement environment where compliance, reliability, and supply chain integration determine supplier selection.'
- The start stop system market is evolving from a fragmented supply base toward consolidated procurement relationships with qualified suppliers.
- Adoption is increasing due to tightening quality standards and performance requirements across key end-use industries.
- Demand is further supported by regulatory compliance timelines and investment cycles across major consuming regions.
- Pricing is expected to remain influenced by raw material costs and production scale improvements during the forecast period.
Key Takeaways, Market Size, and Forecast
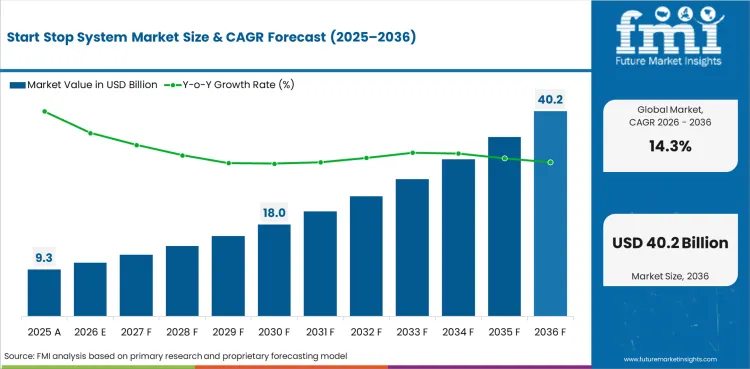
- The start stop system market was valued at USD 9.25 billion in 2025.
- By 2036, the Start Stop System Market is expected to be worth USD 40.24 billion.
- From 2026 to 2036, the market is projected to expand at a CAGR of 14.3%.
- The market is projected to create an incremental opportunity of USD 29.67 billion between 2026 and 2036.
- In 2026, passenger cars are expected to account for 48.0% of the vehicle type segment, driven by emission reduction mandates and fuel efficiency regulations across major automotive markets requiring idle-stop technology as standard equipment.
- Germany (16.9%) and USA (14.7%) are two of the fastest growing markets in the world.
Start Stop System Market Definition
The start stop system market includes all commercially traded products and services categorized under vehicle type, fuel type, sales channel, component, application, distribution channel, end user classifications. This market covers procurement, manufacturing, distribution, and end-use application across global and regional markets.
Start Stop System Market Inclusions
Market scope encompasses all commercially traded products in the start stop system market categorized by vehicle type, fuel type, sales channel, component, application, distribution channel, end user. Revenue coverage spans the 2026 to 2036 forecast period across North America, Latin America, Europe, East Asia, South Asia and Pacific, and Middle East and Africa.
Start Stop System Market Exclusions
The scope does not include raw materials sold without processing into finished products, products used exclusively for research and development purposes without commercial distribution, or services and solutions that fall outside the defined segmentation taxonomy.
Start Stop System Market Research Methodology
- Primary Research: FMI analysts conducted interviews with manufacturers, distributors, and end-use procurement teams across key markets to validate demand patterns and pricing structures.
- Desk Research: Combined data from industry associations, regulatory databases, trade publications, and manufacturer disclosures to establish market baselines.
- Market Sizing and Forecasting: Bottom-up aggregation across segments and regions, calibrated against top-down macroeconomic indicators and industry production data.
- Data Validation: Cross-checked quarterly against production statistics, trade data, and manufacturer financial disclosures.
Why is the Start Stop System Market Growing?
- CO2 emission targets in the EU and corporate average fuel economy (CAFE) standards in the USA are making start-stop systems a cost-effective compliance tool for automakers.
- Germany leads growth at 16.9%, reflecting its position as a center for automotive engineering and early adoption of emission reduction technologies.
- The shift from basic start-stop to enhanced systems with regenerative braking integration is increasing component content and system value per vehicle.
The start-stop system market is expanding at 14.3% CAGR as emission regulations tighten and automakers deploy idle-stop technology across their vehicle portfolios. Passenger cars account for 48.0% of the vehicle type segment, with adoption increasing across all size categories as OEMs meet fleet-wide CO2 targets. The OEM sales channel dominates at 56.0%, reflecting integration during vehicle manufacturing. Gasoline-powered vehicles represent 44.0% of the fuel type segment, where start-stop systems provide measurable fuel economy improvements of 5% to 10% in urban driving conditions.
Germany leads growth at 16.9% CAGR, reflecting its position as a global automotive engineering hub and the stringency of EU CO2 emission targets. German OEMs were early adopters of start-stop technology and continue to integrate more advanced systems with regenerative braking and 48V mild hybrid architectures. The USA at 14.7% reflects CAFE standard compliance pressures and growing consumer acceptance of fuel-saving technologies.
Component demand is distributed across engine parts (34.0%), electrical components, and body parts. Enhanced starter motors capable of frequent restart cycles are a critical component, alongside AGM (Absorbent Glass Mat) batteries that handle the deep discharge and rapid recharge cycles inherent in start-stop operation. The integration of start-stop with 48V mild hybrid systems is creating demand for DC-DC converters, belt-driven starter generators, and advanced battery management systems.
Market Segmentation Analysis
- Passenger cars accounts for 48.0% of the vehicle type segment, reflecting concentrated demand in primary application categories.
- Gasoline accounts for 44.0% of the fuel type segment, reflecting concentrated demand in primary application categories.
- OEM accounts for 56.0% of the sales channel segment, reflecting concentrated demand in primary application categories.
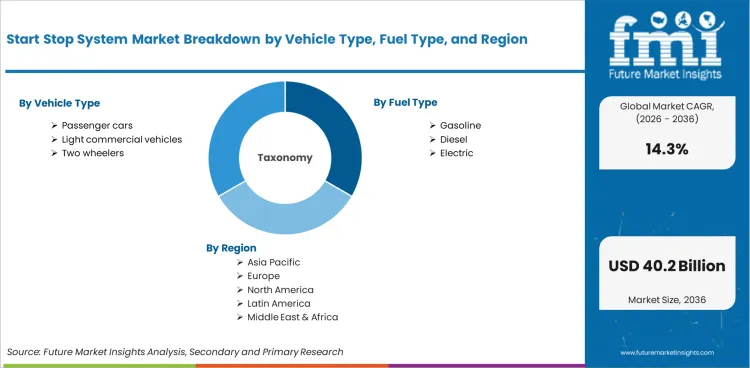
The start stop system market is segmented by vehicle type, fuel type, sales channel, component, application, distribution channel, end user. Demand is concentrated in primary categories that serve the largest end-use applications, with growth potential in specialty and emerging sub-segments.
Insights into the Passenger cars Vehicle Type Segment
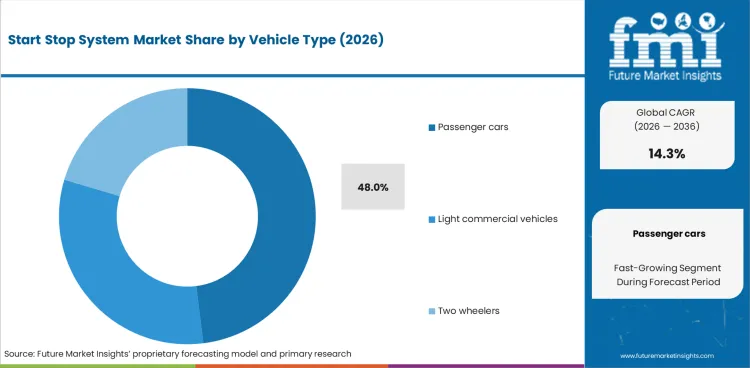
In 2026, passenger cars is expected to account for 48.0% of the market in the vehicle type segment. Demand reflects procurement patterns across primary end-use industries where passenger cars specifications meet performance, cost, and compliance requirements. This segment benefits from established supply chains and standardized procurement processes.
Light commercial vehicles and Two wheelers represent additional segments with growth potential as end-use applications diversify and new specifications emerge. These segments serve specialized requirements where standard offerings do not meet performance or regulatory thresholds.
Insights into the Gasoline Fuel Type Segment
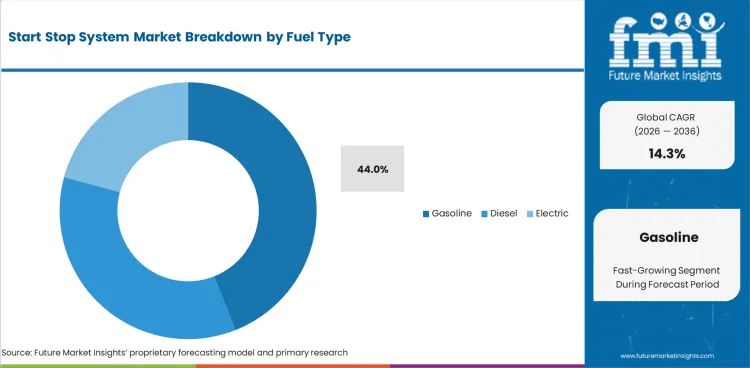
In 2026, gasoline is expected to account for 44.0% of the market in the fuel type segment. Demand reflects procurement patterns across primary end-use industries where gasoline specifications meet performance, cost, and compliance requirements. This segment benefits from established supply chains and standardized procurement processes.
Diesel and Electric represent additional segments with growth potential as end-use applications diversify and new specifications emerge. These segments serve specialized requirements where standard offerings do not meet performance or regulatory thresholds.
Start Stop System Market Drivers, Restraints, and Opportunities
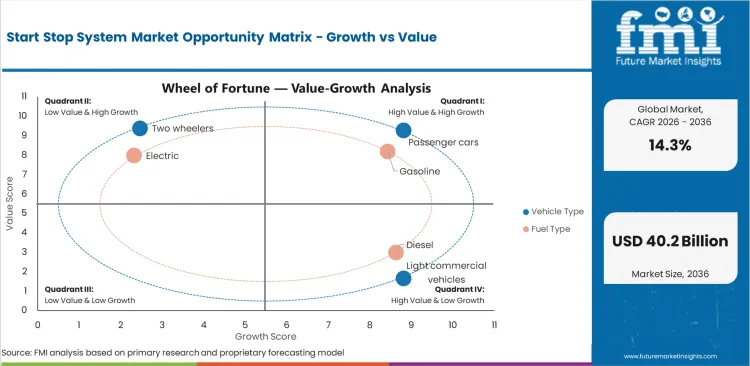
- Structural demand growth across primary end-use applications is expected to sustain procurement volumes through the forecast period.
- Cost pressures from raw material price fluctuations and supply chain complexity remain the primary constraint on margin expansion.
- Regulatory compliance requirements are creating new procurement specifications that favor qualified, certified suppliers.
The start stop system market is shaped by a combination of end-use demand growth, regulatory requirements, and supply chain dynamics. Growth opportunities exist in premium segments, emerging market expansion, and technology-driven product improvements. Cost pressures and supply chain constraints remain the primary barriers to accelerated adoption.
Emission Regulation Compliance
EU CO2 fleet targets, CAFE standards in the USA, and emission limits in China and Japan are making start-stop systems a cost-effective method for reducing measured emissions. Start-stop is one of the lowest-cost emission reduction technologies available to OEMs, making it a priority for compliance strategies. Tightening targets through 2030 and beyond ensure continued adoption growth.
Urban Commuting and Fuel Economy Gains
Start-stop systems deliver the greatest fuel savings in urban stop-and-go traffic, where vehicles spend 30% to 40% of driving time at idle. Consumer awareness of fuel cost savings is supporting acceptance of the technology. Real-world fuel economy improvements of 5% to 10% are measurable and contribute to the total cost-of-ownership case for equipped vehicles.
Integration with Mild Hybrid Architectures
The transition from basic start-stop to 48V mild hybrid systems is expanding the addressable component market. Mild hybrid architectures incorporate belt-driven starter generators, larger batteries, and DC-DC converters alongside the start-stop function, increasing system value by 3 to 5 times compared to conventional start-stop. This integration is a significant revenue growth driver during the forecast period.
Battery Technology Requirements
Start-stop systems require batteries capable of deep cycling and rapid recharge under frequent start-stop events. Conventional flooded lead acid batteries are being replaced by AGM and enhanced flooded batteries (EFB) that tolerate the higher electrical demands. This creates a structured aftermarket replacement cycle as start-stop batteries have shorter service lives than conventional automotive batteries.
Analysis of Start Stop System Market By Key Countries
.webp "Top Country Growth Comparison Start Stop System Market Cagr (2026 2036)")
| Country | CAGR |
|---|---|
| Germany | 16.9% |
| USA | 14.7% |
| South Korea | 14.6% |
| European Union | 14.3% |
| Japan | 13.9% |
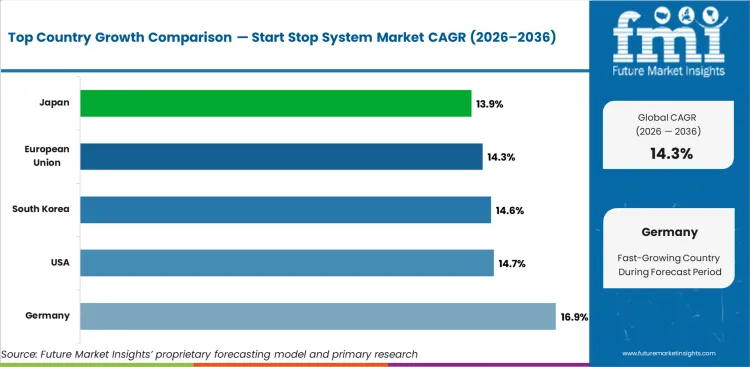
- Germany at 16.9% CAGR reflects automotive engineering leadership, industrial manufacturing, and regulatory stringency.
- USA at 14.7% CAGR reflects strong end-use demand, regulatory compliance, and manufacturing investment.
- South Korea at 14.6% CAGR reflects manufacturing output growth, technology investment, and export-oriented production.
- European Union at 14.3% CAGR reflects sustainability mandates, safety regulations, and manufacturing output.
The global start stop system market is projected to expand at 14.3% CAGR from 2026 to 2036. The analysis covers more than 30 countries, with key markets detailed below.
Demand Outlook for Start Stop System Market in Germany
The market in Germany is expected to grow at 16.9% CAGR through 2036. Industrial manufacturing strength, automotive sector scale, and regulatory leadership position Germany as a key procurement market. Engineering-grade specifications and quality requirements favor established, certified suppliers.
- End-use demand growth supports procurement volumes across primary application segments.
- Regulatory compliance requirements favor qualified and certified suppliers.
- Infrastructure and production investment creates additional demand across secondary application categories.
Future Outlook for Start Stop System Market in the United States
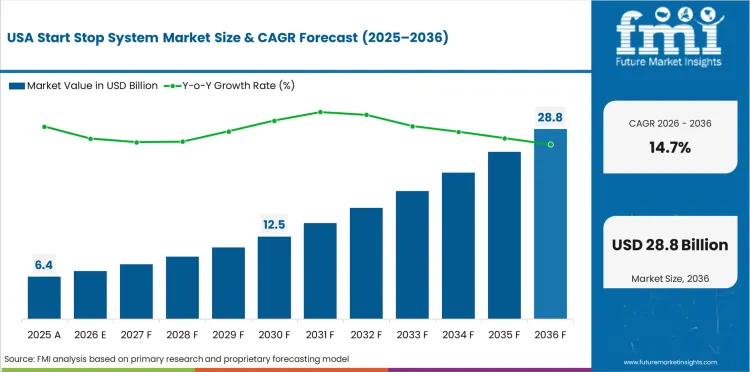
The market in the United States is expected to grow at 14.7% CAGR through 2036. Demand is supported by manufacturing activity, regulatory compliance, and technology adoption across primary end-use sectors. The established industrial base and standardized procurement processes create stable demand for qualified suppliers.
- End-use demand growth supports procurement volumes across primary application segments.
- Regulatory compliance requirements favor qualified and certified suppliers.
- Infrastructure and production investment creates additional demand across secondary application categories.
Opportunity Analysis of Start Stop System Market in South Korea
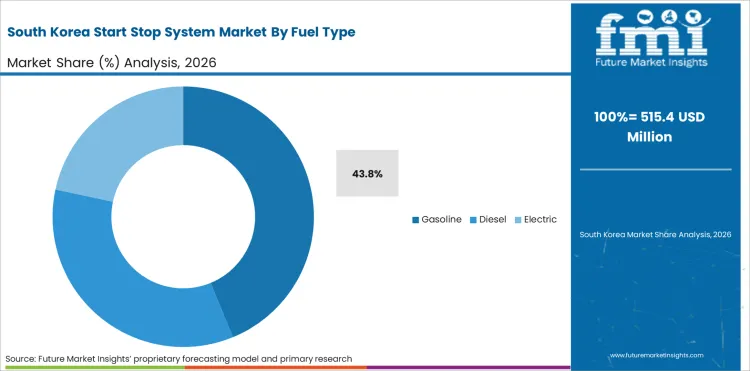
The market in South Korea is expected to grow at 14.6% CAGR through 2036. Manufacturing output growth and technology-driven procurement are supporting demand. Strong electronics, automotive, and chemical manufacturing bases drive specification-intensive procurement.
- End-use demand growth supports procurement volumes across primary application segments.
- Regulatory compliance requirements favor qualified and certified suppliers.
- Infrastructure and production investment creates additional demand across secondary application categories.
In-depth Analysis of Start Stop System Market in the European Union
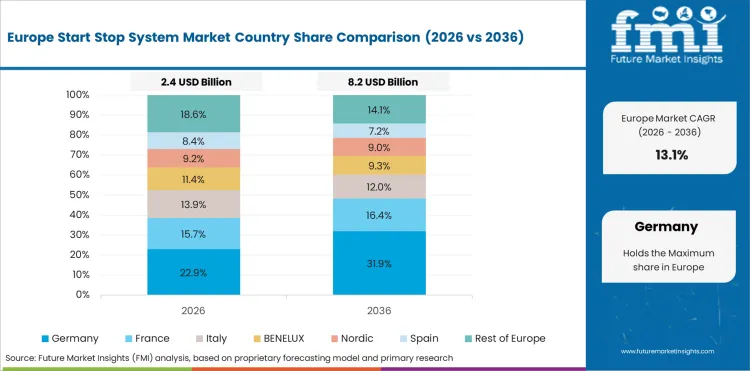
The market in the European Union is expected to grow at 14.3% CAGR through 2036. Growth reflects EU sustainability mandates, safety regulations, and strong manufacturing output. Procurement is shifting toward certified and compliant products as regulatory enforcement increases across member states.
- End-use demand growth supports procurement volumes across primary application segments.
- Regulatory compliance requirements favor qualified and certified suppliers.
- Infrastructure and production investment creates additional demand across secondary application categories.
Sales Analysis of Start Stop System Market in Japan
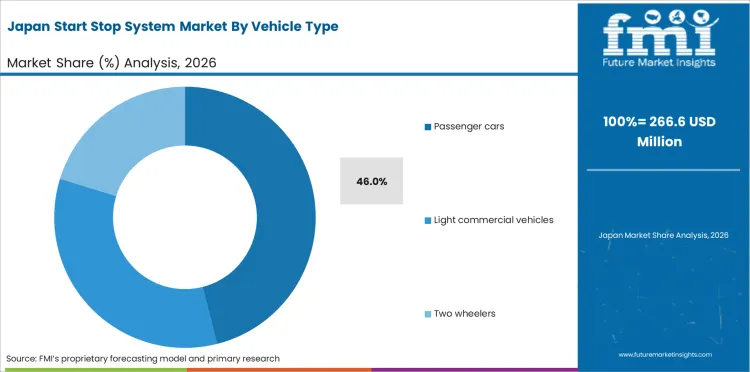
The market in Japan is expected to grow at 13.9% CAGR through 2036. Demand is driven by precision manufacturing standards, technology adoption, and quality requirements. Japanese procurement favors suppliers with demonstrated quality control and traceability capabilities.
- End-use demand growth supports procurement volumes across primary application segments.
- Regulatory compliance requirements favor qualified and certified suppliers.
- Infrastructure and production investment creates additional demand across secondary application categories.
Competitive Landscape and Strategic Positioning
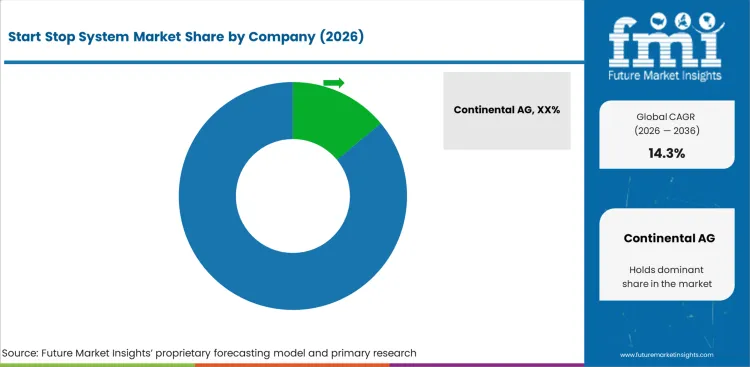
- Continental AG maintains a leading position through integrated manufacturing capabilities and established end-user relationships across key regions.
- Mid-tier players compete on regional presence, product specialization, and technical service capability.
- Entry barriers include capital intensity, quality certification requirements, and established supply chain relationships.
Continental AG holds a leading market position through broad product capabilities and global distribution networks. The company serves primary end-use segments across major regions with standardized and custom product offerings.
Denso Corporation and Valeo S.A. compete through technical specialization, regional market knowledge, and application-specific expertise.
The competitive landscape is shaped by capital requirements for manufacturing infrastructure, quality certification processes, and the need for established end-user relationships. New entrants typically focus on niche applications or regional markets before expanding into broader competition.
Key Companies in the Start Stop System Market
Key global companies leading the start stop system market include:
- Continental AG, Denso Corporation, Valeo S.A. maintain strong positions through global manufacturing infrastructure and established distribution networks.
- Hitachi Astemo Ltd., Robert Bosch GmbH compete through regional specialization and technical service capabilities.
Competitive Benchmarking: Start Stop System Market
| Company | Product Range | Manufacturing Scale | Distribution Reach | Technical Capability |
|---|---|---|---|---|
| Continental AG | High | High | Global | Strong |
| Denso Corporation | High | Medium | Global | Strong |
| Valeo S.A. | Medium | High | Regional | Strong |
| Hitachi Astemo Ltd. | Medium | Medium | Regional | Moderate |
| Robert Bosch GmbH | Medium | Medium | Global | Moderate |
Source: Future Market Insights competitive analysis, 2026.
Key Developments in Start Stop System Market
- In 2025, Continental AG expanded manufacturing capacity for passenger cars products to serve growing demand in Germany and European markets.
- In 2025, Denso Corporation introduced new product specifications aligned with updated regulatory requirements in North America and Europe.
Key Players in the Start Stop System Market
Major Global Players
- Continental AG
- Denso Corporation
- Valeo S.A.
- Hitachi Astemo Ltd.
- Robert Bosch GmbH
Emerging Players/Startups
- Hitachi Astemo Ltd.
- Robert Bosch GmbH
Report Scope and Coverage
| Parameter | Details |
|---|---|
| Quantitative Units | USD 10.57 billion to USD 40.24 billion, at a CAGR of 14.3% |
| Market Definition | The start stop system market encompasses products and services related to vehicle type, fuel type, sales channel, component, application, distribution channel, end user applications across key global regions. |
| Regions Covered | North America, Latin America, Europe, East Asia, South Asia and Pacific, Middle East and Africa |
| Countries Covered | USA, UK, France, Germany, Italy, South Korea, Japan, China, India, 30 plus countries |
| Key Companies Profiled | Continental AG, Denso Corporation, Valeo S.A., Hitachi Astemo Ltd., Robert Bosch GmbH |
| Forecast Period | 2026 to 2036 |
| Approach | Hybrid bottom-up and top-down methodology starting with verified transaction data, projecting adoption velocity across segments and regions. |
Segmentation
Start Stop System Market Market Segmented by Vehicle Type:
- Passenger cars
- Light commercial vehicles
- Two wheelers
Start Stop System Market Market Segmented by Fuel Type:
- Gasoline
- Diesel
- Electric
Start Stop System Market Market Segmented by Sales Channel:
- OEM
- Aftermarket
Start Stop System Market Market Segmented by Component:
- Engine parts
- Electrical components
- Body parts
Start Stop System Market Market Segmented by Application:
- Commuting
- Commercial transport
- Logistics
Start Stop System Market Market Segmented by Distribution Channel:
- Offline
- Online
Start Stop System Market Market Segmented by End User:
- Individual users
- Fleet operators
Start Stop System Market Market by Region:
- North America
- USA
- Canada
- Mexico
- Latin America
- Brazil
- Chile
- Rest of Latin America
- Western Europe
- Germany
- UK
- Italy
- Spain
- France
- Nordic
- BENELUX
- Rest of Western Europe
- Eastern Europe
- Russia
- Poland
- Hungary
- Balkan & Baltic
- Rest of Eastern Europe
- East Asia
- China
- Japan
- South Korea
- South Asia and Pacific
- India
- ASEAN
- Australia & New Zealand
- Rest of South Asia and Pacific
- Middle East & Africa
- Kingdom of Saudi Arabia
- Other GCC Countries
- Turkiye
- South Africa
- Other African Union
- Rest of Middle East & Africa
Research Sources and Bibliography
- 1. European Commission. (2025). EU CO2 Emission Standards for Passenger Cars and Light Commercial Vehicles. EC.
- 2. USA Environmental Protection Agency. (2025). EPA Corporate Average Fuel Economy Standards. EPA.
- 3. International Council on Clean Transportation. (2025). ICCT Global Passenger Vehicle Emission Standards. ICCT.
- 4. Society of Automotive Engineers. (2025). SAE J2908 Start-Stop System Testing Standards. SAE International.
- 5. International Energy Agency. (2025). IEA Global Fuel Economy Initiative Report. IEA.
This bibliography is provided for reader reference.
This Report Answers
- Estimating the size of the start stop system market and revenue projections from 2026 to 2036.
- Segmentation analysis by vehicle type, fuel type, sales channel, component, application, distribution channel, end user.
- Regional and country-level market insights covering more than 30 markets.
- Assessment of competitive landscape and key company positioning.
- Analysis of market drivers, restraints, and growth opportunities.
- Investment opportunity identification across primary segments and regions.
- Supply chain and procurement structure analysis.
- Delivery of data in PDF and Excel formats.
Frequently Asked Questions
What is the global market demand for Start Stop System Market in 2026?
In 2026, the global start stop system market is expected to be worth USD 10.57 billion.
How big will the Start Stop System Market be in 2036?
By 2036, the start stop system market is expected to reach USD 40.24 billion.
How much is demand for Start Stop System Market expected to grow between 2026 and 2036?
Between 2026 and 2036, demand for start stop system market is expected to grow at a CAGR of 14.3%.
Which vehicle type segment is expected to lead in 2026?
Passenger cars is expected to account for 48.0% of the vehicle type segment in 2026, driven by emission reduction mandates and fuel efficiency regulations across major automotive markets requiring idle-stop technology as standard equipment.
What is driving demand in Germany?
Germany is expected to grow at 16.9% CAGR through 2036, supported by automotive engineering leadership, industrial manufacturing, and regulatory stringency.
What is driving demand in USA?
USA is expected to grow at 14.7% CAGR through 2036, reflecting strong end-use demand, regulatory compliance, and manufacturing investment.
What does this report mean by 'Start Stop System Market definition'?
The start stop system market includes all commercially traded products categorized by vehicle type, fuel type, sales channel, component, application, distribution channel, end user across global and regional markets.
How does FMI make the Start Stop System Market forecast and validate it?
Forecasting uses a hybrid bottom-up and top-down methodology, starting with verified transaction data and validating against industry production statistics and manufacturer disclosures.
Preview the report firsthand - request a free sample
Get SampleGet the brochure for pricing and purchase details.
Get PDFTable of Content
- Executive Summary
- Global Market Outlook
- Demand-side Trends
- Supply-side Trends
- Technology Roadmap Analysis
- Analysis and Recommendations
- Market Overview
- Market Coverage / Taxonomy
- Market Definition / Scope / Limitations
- Research Methodology
- Chapter Orientation
- Analytical Lens and Working Hypotheses
- Market Structure, Signals, and Trend Drivers
- Benchmarking and Cross-market Comparability
- Market Sizing, Forecasting, and Opportunity Mapping
- Research Design and Evidence Framework
- Desk Research Programme (Secondary Evidence)
- Company Annual and Sustainability Reports
- Peer-reviewed Journals and Academic Literature
- Corporate Websites, Product Literature, and Technical Notes
- Earnings Decks and Investor Briefings
- Statutory Filings and Regulatory Disclosures
- Technical White Papers and Standards Notes
- Trade Journals, Industry Magazines, and Analyst Briefs
- Conference Proceedings, Webinars, and Seminar Materials
- Government Statistics Portals and Public Data Releases
- Press Releases and Reputable Media Coverage
- Specialist Newsletters and Curated Briefings
- Sector Databases and Reference Repositories
- FMI Internal Proprietary Databases and Historical Market Datasets
- Subscription Datasets and Paid Sources
- Social Channels, Communities, and Digital Listening Inputs
- Additional Desk Sources
- Expert Input and Fieldwork (Primary Evidence)
- Primary Modes
- Qualitative Interviews and Expert Elicitation
- Quantitative Surveys and Structured Data Capture
- Blended Approach
- Why Primary Evidence is Used
- Field Techniques
- Interviews
- Surveys
- Focus Groups
- Observational and In-context Research
- Social and Community Interactions
- Stakeholder Universe Engaged
- C-suite Leaders
- Board Members
- Presidents and Vice Presidents
- R&D and Innovation Heads
- Technical Specialists
- Domain Subject-matter Experts
- Scientists
- Physicians and Other Healthcare Professionals
- Governance, Ethics, and Data Stewardship
- Research Ethics
- Data Integrity and Handling
- Primary Modes
- Tooling, Models, and Reference Databases
- Desk Research Programme (Secondary Evidence)
- Data Engineering and Model Build
- Data Acquisition and Ingestion
- Cleaning, Normalisation, and Verification
- Synthesis, Triangulation, and Analysis
- Quality Assurance and Audit Trail
- Market Background
- Market Dynamics
- Drivers
- Restraints
- Opportunity
- Trends
- Scenario Forecast
- Demand in Optimistic Scenario
- Demand in Likely Scenario
- Demand in Conservative Scenario
- Opportunity Map Analysis
- Product Life Cycle Analysis
- Supply Chain Analysis
- Investment Feasibility Matrix
- Value Chain Analysis
- PESTLE and Porter’s Analysis
- Regulatory Landscape
- Regional Parent Market Outlook
- Production and Consumption Statistics
- Import and Export Statistics
- Market Dynamics
- Global Market Analysis 2021 to 2025 and Forecast, 2026 to 2036
- Historical Market Size Value (USD Million) Analysis, 2021 to 2025
- Current and Future Market Size Value (USD Million) Projections, 2026 to 2036
- Y-o-Y Growth Trend Analysis
- Absolute $ Opportunity Analysis
- Global Market Pricing Analysis 2021 to 2025 and Forecast 2026 to 2036
- Global Market Analysis 2021 to 2025 and Forecast 2026 to 2036, By Vehicle Type
- Introduction / Key Findings
- Historical Market Size Value (USD Million) Analysis By Vehicle Type , 2021 to 2025
- Current and Future Market Size Value (USD Million) Analysis and Forecast By Vehicle Type , 2026 to 2036
- Passenger cars
- Light commercial vehicles
- Two wheelers
- Passenger cars
- Y-o-Y Growth Trend Analysis By Vehicle Type , 2021 to 2025
- Absolute $ Opportunity Analysis By Vehicle Type , 2026 to 2036
- Global Market Analysis 2021 to 2025 and Forecast 2026 to 2036, By Fuel Type
- Introduction / Key Findings
- Historical Market Size Value (USD Million) Analysis By Fuel Type, 2021 to 2025
- Current and Future Market Size Value (USD Million) Analysis and Forecast By Fuel Type, 2026 to 2036
- Gasoline
- Diesel
- Electric
- Gasoline
- Y-o-Y Growth Trend Analysis By Fuel Type, 2021 to 2025
- Absolute $ Opportunity Analysis By Fuel Type, 2026 to 2036
- Global Market Analysis 2021 to 2025 and Forecast 2026 to 2036, By Sales Channel
- Introduction / Key Findings
- Historical Market Size Value (USD Million) Analysis By Sales Channel, 2021 to 2025
- Current and Future Market Size Value (USD Million) Analysis and Forecast By Sales Channel, 2026 to 2036
- OEM
- Aftermarket
- OEM
- Y-o-Y Growth Trend Analysis By Sales Channel, 2021 to 2025
- Absolute $ Opportunity Analysis By Sales Channel, 2026 to 2036
- Global Market Analysis 2021 to 2025 and Forecast 2026 to 2036, By Component
- Introduction / Key Findings
- Historical Market Size Value (USD Million) Analysis By Component, 2021 to 2025
- Current and Future Market Size Value (USD Million) Analysis and Forecast By Component, 2026 to 2036
- Engine parts
- Electrical components
- Body parts
- Engine parts
- Y-o-Y Growth Trend Analysis By Component, 2021 to 2025
- Absolute $ Opportunity Analysis By Component, 2026 to 2036
- Global Market Analysis 2021 to 2025 and Forecast 2026 to 2036, By Application
- Introduction / Key Findings
- Historical Market Size Value (USD Million) Analysis By Application, 2021 to 2025
- Current and Future Market Size Value (USD Million) Analysis and Forecast By Application, 2026 to 2036
- Commuting
- Commercial transport
- Logistics
- Commuting
- Y-o-Y Growth Trend Analysis By Application, 2021 to 2025
- Absolute $ Opportunity Analysis By Application, 2026 to 2036
- Global Market Analysis 2021 to 2025 and Forecast 2026 to 2036, By Distribution Channel
- Introduction / Key Findings
- Historical Market Size Value (USD Million) Analysis By Distribution Channel, 2021 to 2025
- Current and Future Market Size Value (USD Million) Analysis and Forecast By Distribution Channel, 2026 to 2036
- Offline
- Online
- Offline
- Y-o-Y Growth Trend Analysis By Distribution Channel, 2021 to 2025
- Absolute $ Opportunity Analysis By Distribution Channel, 2026 to 2036
- Global Market Analysis 2021 to 2025 and Forecast 2026 to 2036, By End User
- Introduction / Key Findings
- Historical Market Size Value (USD Million) Analysis By End User, 2021 to 2025
- Current and Future Market Size Value (USD Million) Analysis and Forecast By End User, 2026 to 2036
- Individual users
- Fleet operators
- Individual users
- Y-o-Y Growth Trend Analysis By End User, 2021 to 2025
- Absolute $ Opportunity Analysis By End User, 2026 to 2036
- Global Market Analysis 2021 to 2025 and Forecast 2026 to 2036, By Region
- Introduction
- Historical Market Size Value (USD Million) Analysis By Region, 2021 to 2025
- Current Market Size Value (USD Million) Analysis and Forecast By Region, 2026 to 2036
- North America
- Latin America
- Western Europe
- Eastern Europe
- East Asia
- South Asia and Pacific
- Middle East & Africa
- Market Attractiveness Analysis By Region
- North America Market Analysis 2021 to 2025 and Forecast 2026 to 2036, By Country
- Historical Market Size Value (USD Million) Trend Analysis By Market Taxonomy, 2021 to 2025
- Market Size Value (USD Million) Forecast By Market Taxonomy, 2026 to 2036
- By Country
- USA
- Canada
- Mexico
- By Vehicle Type
- By Fuel Type
- By Sales Channel
- By Component
- By Application
- By Distribution Channel
- By End User
- By Country
- Market Attractiveness Analysis
- By Country
- By Vehicle Type
- By Fuel Type
- By Sales Channel
- By Component
- By Application
- By Distribution Channel
- By End User
- Key Takeaways
- Latin America Market Analysis 2021 to 2025 and Forecast 2026 to 2036, By Country
- Historical Market Size Value (USD Million) Trend Analysis By Market Taxonomy, 2021 to 2025
- Market Size Value (USD Million) Forecast By Market Taxonomy, 2026 to 2036
- By Country
- Brazil
- Chile
- Rest of Latin America
- By Vehicle Type
- By Fuel Type
- By Sales Channel
- By Component
- By Application
- By Distribution Channel
- By End User
- By Country
- Market Attractiveness Analysis
- By Country
- By Vehicle Type
- By Fuel Type
- By Sales Channel
- By Component
- By Application
- By Distribution Channel
- By End User
- Key Takeaways
- Western Europe Market Analysis 2021 to 2025 and Forecast 2026 to 2036, By Country
- Historical Market Size Value (USD Million) Trend Analysis By Market Taxonomy, 2021 to 2025
- Market Size Value (USD Million) Forecast By Market Taxonomy, 2026 to 2036
- By Country
- Germany
- UK
- Italy
- Spain
- France
- Nordic
- BENELUX
- Rest of Western Europe
- By Vehicle Type
- By Fuel Type
- By Sales Channel
- By Component
- By Application
- By Distribution Channel
- By End User
- By Country
- Market Attractiveness Analysis
- By Country
- By Vehicle Type
- By Fuel Type
- By Sales Channel
- By Component
- By Application
- By Distribution Channel
- By End User
- Key Takeaways
- Eastern Europe Market Analysis 2021 to 2025 and Forecast 2026 to 2036, By Country
- Historical Market Size Value (USD Million) Trend Analysis By Market Taxonomy, 2021 to 2025
- Market Size Value (USD Million) Forecast By Market Taxonomy, 2026 to 2036
- By Country
- Russia
- Poland
- Hungary
- Balkan & Baltic
- Rest of Eastern Europe
- By Vehicle Type
- By Fuel Type
- By Sales Channel
- By Component
- By Application
- By Distribution Channel
- By End User
- By Country
- Market Attractiveness Analysis
- By Country
- By Vehicle Type
- By Fuel Type
- By Sales Channel
- By Component
- By Application
- By Distribution Channel
- By End User
- Key Takeaways
- East Asia Market Analysis 2021 to 2025 and Forecast 2026 to 2036, By Country
- Historical Market Size Value (USD Million) Trend Analysis By Market Taxonomy, 2021 to 2025
- Market Size Value (USD Million) Forecast By Market Taxonomy, 2026 to 2036
- By Country
- China
- Japan
- South Korea
- By Vehicle Type
- By Fuel Type
- By Sales Channel
- By Component
- By Application
- By Distribution Channel
- By End User
- By Country
- Market Attractiveness Analysis
- By Country
- By Vehicle Type
- By Fuel Type
- By Sales Channel
- By Component
- By Application
- By Distribution Channel
- By End User
- Key Takeaways
- South Asia and Pacific Market Analysis 2021 to 2025 and Forecast 2026 to 2036, By Country
- Historical Market Size Value (USD Million) Trend Analysis By Market Taxonomy, 2021 to 2025
- Market Size Value (USD Million) Forecast By Market Taxonomy, 2026 to 2036
- By Country
- India
- ASEAN
- Australia & New Zealand
- Rest of South Asia and Pacific
- By Vehicle Type
- By Fuel Type
- By Sales Channel
- By Component
- By Application
- By Distribution Channel
- By End User
- By Country
- Market Attractiveness Analysis
- By Country
- By Vehicle Type
- By Fuel Type
- By Sales Channel
- By Component
- By Application
- By Distribution Channel
- By End User
- Key Takeaways
- Middle East & Africa Market Analysis 2021 to 2025 and Forecast 2026 to 2036, By Country
- Historical Market Size Value (USD Million) Trend Analysis By Market Taxonomy, 2021 to 2025
- Market Size Value (USD Million) Forecast By Market Taxonomy, 2026 to 2036
- By Country
- Kingdom of Saudi Arabia
- Other GCC Countries
- Turkiye
- South Africa
- Other African Union
- Rest of Middle East & Africa
- By Vehicle Type
- By Fuel Type
- By Sales Channel
- By Component
- By Application
- By Distribution Channel
- By End User
- By Country
- Market Attractiveness Analysis
- By Country
- By Vehicle Type
- By Fuel Type
- By Sales Channel
- By Component
- By Application
- By Distribution Channel
- By End User
- Key Takeaways
- Key Countries Market Analysis
- USA
- Pricing Analysis
- Market Share Analysis, 2025
- By Vehicle Type
- By Fuel Type
- By Sales Channel
- By Component
- By Application
- By Distribution Channel
- By End User
- Canada
- Pricing Analysis
- Market Share Analysis, 2025
- By Vehicle Type
- By Fuel Type
- By Sales Channel
- By Component
- By Application
- By Distribution Channel
- By End User
- Mexico
- Pricing Analysis
- Market Share Analysis, 2025
- By Vehicle Type
- By Fuel Type
- By Sales Channel
- By Component
- By Application
- By Distribution Channel
- By End User
- Brazil
- Pricing Analysis
- Market Share Analysis, 2025
- By Vehicle Type
- By Fuel Type
- By Sales Channel
- By Component
- By Application
- By Distribution Channel
- By End User
- Chile
- Pricing Analysis
- Market Share Analysis, 2025
- By Vehicle Type
- By Fuel Type
- By Sales Channel
- By Component
- By Application
- By Distribution Channel
- By End User
- Germany
- Pricing Analysis
- Market Share Analysis, 2025
- By Vehicle Type
- By Fuel Type
- By Sales Channel
- By Component
- By Application
- By Distribution Channel
- By End User
- UK
- Pricing Analysis
- Market Share Analysis, 2025
- By Vehicle Type
- By Fuel Type
- By Sales Channel
- By Component
- By Application
- By Distribution Channel
- By End User
- Italy
- Pricing Analysis
- Market Share Analysis, 2025
- By Vehicle Type
- By Fuel Type
- By Sales Channel
- By Component
- By Application
- By Distribution Channel
- By End User
- Spain
- Pricing Analysis
- Market Share Analysis, 2025
- By Vehicle Type
- By Fuel Type
- By Sales Channel
- By Component
- By Application
- By Distribution Channel
- By End User
- France
- Pricing Analysis
- Market Share Analysis, 2025
- By Vehicle Type
- By Fuel Type
- By Sales Channel
- By Component
- By Application
- By Distribution Channel
- By End User
- India
- Pricing Analysis
- Market Share Analysis, 2025
- By Vehicle Type
- By Fuel Type
- By Sales Channel
- By Component
- By Application
- By Distribution Channel
- By End User
- ASEAN
- Pricing Analysis
- Market Share Analysis, 2025
- By Vehicle Type
- By Fuel Type
- By Sales Channel
- By Component
- By Application
- By Distribution Channel
- By End User
- Australia & New Zealand
- Pricing Analysis
- Market Share Analysis, 2025
- By Vehicle Type
- By Fuel Type
- By Sales Channel
- By Component
- By Application
- By Distribution Channel
- By End User
- China
- Pricing Analysis
- Market Share Analysis, 2025
- By Vehicle Type
- By Fuel Type
- By Sales Channel
- By Component
- By Application
- By Distribution Channel
- By End User
- Japan
- Pricing Analysis
- Market Share Analysis, 2025
- By Vehicle Type
- By Fuel Type
- By Sales Channel
- By Component
- By Application
- By Distribution Channel
- By End User
- South Korea
- Pricing Analysis
- Market Share Analysis, 2025
- By Vehicle Type
- By Fuel Type
- By Sales Channel
- By Component
- By Application
- By Distribution Channel
- By End User
- Russia
- Pricing Analysis
- Market Share Analysis, 2025
- By Vehicle Type
- By Fuel Type
- By Sales Channel
- By Component
- By Application
- By Distribution Channel
- By End User
- Poland
- Pricing Analysis
- Market Share Analysis, 2025
- By Vehicle Type
- By Fuel Type
- By Sales Channel
- By Component
- By Application
- By Distribution Channel
- By End User
- Hungary
- Pricing Analysis
- Market Share Analysis, 2025
- By Vehicle Type
- By Fuel Type
- By Sales Channel
- By Component
- By Application
- By Distribution Channel
- By End User
- Kingdom of Saudi Arabia
- Pricing Analysis
- Market Share Analysis, 2025
- By Vehicle Type
- By Fuel Type
- By Sales Channel
- By Component
- By Application
- By Distribution Channel
- By End User
- Turkiye
- Pricing Analysis
- Market Share Analysis, 2025
- By Vehicle Type
- By Fuel Type
- By Sales Channel
- By Component
- By Application
- By Distribution Channel
- By End User
- South Africa
- Pricing Analysis
- Market Share Analysis, 2025
- By Vehicle Type
- By Fuel Type
- By Sales Channel
- By Component
- By Application
- By Distribution Channel
- By End User
- USA
- Market Structure Analysis
- Competition Dashboard
- Competition Benchmarking
- Market Share Analysis of Top Players
- By Regional
- By Vehicle Type
- By Fuel Type
- By Sales Channel
- By Component
- By Application
- By Distribution Channel
- By End User
- Competition Analysis
- Competition Deep Dive
- Continental AG
- Overview
- Product Portfolio
- Profitability by Market Segments (Product/Age /Sales Channel/Region)
- Sales Footprint
- Strategy Overview
- Marketing Strategy
- Product Strategy
- Channel Strategy
- Denso Corporation
- Valeo S.A.
- Hitachi Astemo Ltd.
- Robert Bosch GmbH
- Continental AG
- Competition Deep Dive
- Assumptions & Acronyms Used


