

- Market Size (2026)
- USD 380.7 Mn
- Forecast (2036)
- USD 707.9 Mn
- CAGR (2026 to 2036)
- 6.4%
How big is the Step Touch Voltage Testers Market in 2026?
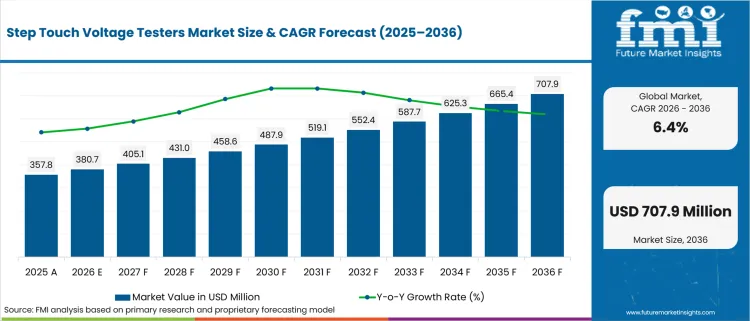
USD 380.7 million in 2026 and USD 707.9 million by 2036 at a 6.4% CAGR.
Grounding safety verification is moving from an engineering check toward a purchase requirement across substations and renewable interconnection sites. Utilities and EPC contractors need instruments that prove whether fault conditions can create unsafe voltage around grounded structures. The International Energy Agency reported in March 2025 that global electricity demand increased by 4.3% in 2024. That load growth raises the commercial value of electrical testing equipment used for commissioning records. Related test and measurement equipment also supports repeat field verification across utility programs. Buyers are therefore asking for systems that connect safety evidence to handover files and maintenance documentation.
Buyer groups include utilities and EPC contractors that manage high voltage field work across owned or client assets. Electrical test labs and industrial facilities also carry safety accountability for high voltage yards and heavy equipment sites. Their adoption is driven by fault-current studies, outage planning and contractor liability. Step touch voltage testers create value by combining current injection, voltage measurement and field reporting into one workflow. This helps buyers turn grounding design assumptions into evidence that can support engineering review, worker-safety files and project closeout approval.
Regional adoption differs by grid age and project volume across utility networks and industrial power sites. North America and Western Europe rely on renewal work and standards-driven procurement for repeat maintenance cycles. China and India show project-led demand supported by new high voltage transmission substations and renewable pooling stations. The product becomes more valuable once grounding records connect design studies, field testing and asset files. Contractor closeout evidence then frames the strategic buyer case for technical selection, calibration support and channel access during short outage windows.
| Metric | Value |
|---|---|
| 2025 Market Size | USD 357.8 million |
| 2026 Market Size | USD 380.7 million |
| 2036 Market Size | USD 707.9 million |
| Forecast CAGR (2026-2036) | 6.4% |
| Tester Type Focus | Ground Grid Test Systems |
| Ground Grid Test Systems Share (2026) | 36.5% |
| Application Focus | Substation Ground Testing |
| Substation Ground Testing Share (2026) | 42.0% |
| Current Injection Focus | Medium-current Systems |
| Medium-current Systems Share (2026) | 47.0% |
| Fastest-growing Country | India |
| India CAGR by 2036 | 8.1% |
Summary of the Step Touch Voltage Testers Market
| Market Signal | Commercial Impact |
|---|---|
| Demand and Growth Drivers | Demand for step touch voltage testers is increasing as utilities and EPC contractors strengthen grounding verification, personnel safety compliance, and substation commissioning procedures.
|
| Product and Segment View | Ground grid test systems, substation ground testing, and medium-current injection solutions continue to lead procurement as utilities prioritize integrated field verification and standards-based safety testing.
|
| Geography and Growth Outlook | Asia remains the primary growth region as renewable energy expansion, transmission investment, and grid modernization increase demand for grounding safety verification.
|
| Competitive Landscape | Competition increasingly focuses on grounding measurement accuracy, current injection capability, field reporting, and integration with broader electrical testing workflows.
|
| Analyst Perspective | Step touch voltage testing is evolving into a documented personnel safety requirement where measurement accuracy, reporting capability, and standards compliance increasingly determine supplier selection.
- Nikhil Kaitwade, Principal Consultant at Future Market Insights |
How is the step touch voltage testers market segmented?
The Step Touch Voltage Testers industry is segmented by tester type, application, current injection, end use, sales channel, and region.
The step touch voltage testers market is segmented by tester type, application, current injection, end use, sales channel and region. Tester type covers portable step voltage testers, touch voltage testers, ground grid test systems and integrated safety test kits. Application includes substation ground testing, transmission tower testing, renewable plant grounding and industrial earthing safety. Current injection spans low-current systems, medium-current systems and high-current systems. End use includes utilities, EPC contractors, electrical test labs and industrial facilities. Sales channel covers direct OEM, test equipment distributors and rental or service models. Regional coverage extends across North America, Latin America, Europe, East Asia, South Asia and Pacific and the Middle East and Africa.
Why are Ground Grid Test Systems important within the tester type category?
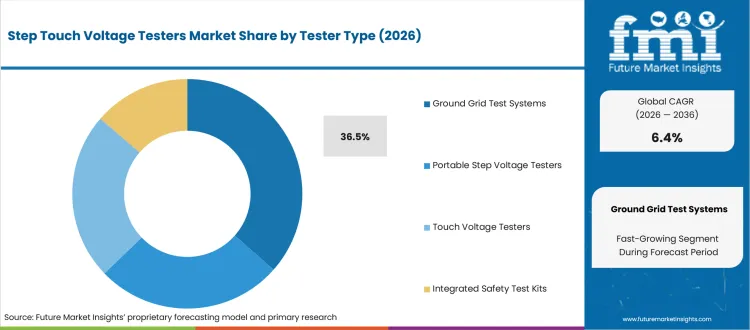
Utilities need grounding tests that answer more than one safety question during the same field campaign. A ground grid project can require impedance measurement and step voltage checks. It can also require touch voltage checks and mapped reporting around fences or equipment. Ground grid test systems are relevant due to this combined workflow, which reduces method gaps between engineering studies and field acceptance records.
- In 2026, Ground Grid Test Systems are anticipated to hold 36.5% of tester type demand due to utility preference for one workflow covering ground impedance and worker-exposure checks. OMICRON states that the CPC 100 and CP CU1 can determine ground impedance and touch or step voltages on large systems.
- The executive value is traceable safety acceptance. Buyers using ground grid systems can connect test points, current injection and reports in one record. This reduces dispute risk during commissioning and helps safety teams review exposure findings before a substation or renewable interconnection point is signed off.
What makes Substation Ground Testing the chosen application area?
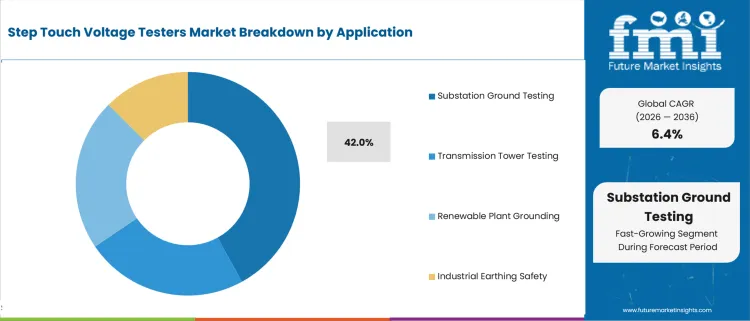
Substation owners need proof around grounded metalwork before workers enter energized or recently modified yards. The operating issue is exposure during fault-current events, not only low earth resistance. Substation ground testing gains relevance due to this personnel-safety problem. It also helps buyers map voltage gradients around transformers and fences. Towers and switchyard structures create further field points for crew review.
- Substation Ground Testing represents estimated 42.0% share in 2026, supported by safety exposure around fenced yards and grounded steel structures. OSHA’s appendix on electric potential states that substation and transmission grounding should minimize step and touch potentials. This makes formal testing a practical safety control.
- Utility teams using substation ground testing are able to identify unsafe spots before energization or maintenance sign-off. The buyer value is evidence that field crews can trust during outage planning. It also helps engineering teams compare installed grounding performance against study assumptions and safety procedures.
How do buyers evaluate Medium-current Systems within current injection?
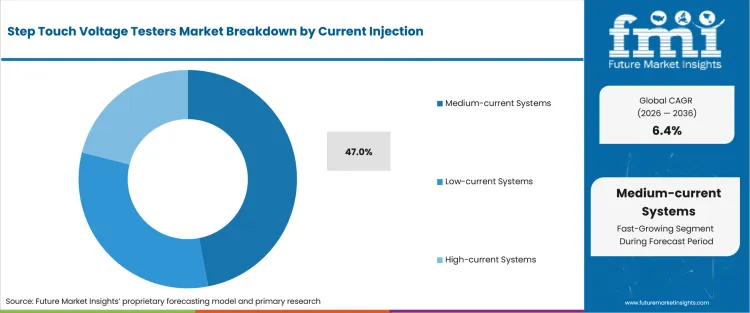
Field crews often work in live yards, remote renewable substations and constrained industrial sites. Very high current injection can require heavier logistics and more setup time. Medium-current systems are relevant owing to the balance between usable signal strength and field mobility, which lets contractors and utilities move across several test points during one campaign.
- Medium-current Systems account for predicted 47.0% share in in 2026, attributable to field crews needing stable readings without heavy generator logistics. Metrel describes the MI 3295 for protective earthing checks in power stations and substations. That fit supports routine field use.
- For contractors, medium-current kits reduce transport and setup burden due to smaller field campaigns and rental jobs. The practical value is faster movement between test locations. Buyers can still obtain readings that support engineering review without turning every grounding check into a heavy equipment mobilization.
What market factors influence demand from Utilities?
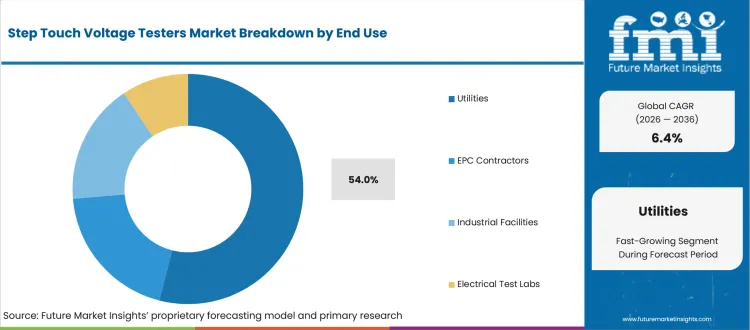
Utilities own the assets that carry the recurring safety obligation. Their buying decision is shaped by substations, transmission towers and renewable interconnections that remain in service for decades. Utilities need repeatable methods, calibration discipline and records that survive internal audits. This makes tester demand more recurrent than project-only contractor buying.
- Utilities are projected to capture 54.0% of end-use demand in 2026, reinforced by ownership of substations and network safety files. DV Power describes the GGT Series ground grid integrity tester for substation grounding systems. That product scope supports utility maintenance use cases.
- The utility case is built around repeatability. Operators need equipment that crews can use across many sites and outage windows. This supports direct purchasing for larger utilities and service contracts for smaller network owners that still require documented grounding evidence.
How is Direct OEM positioned within sales channels?
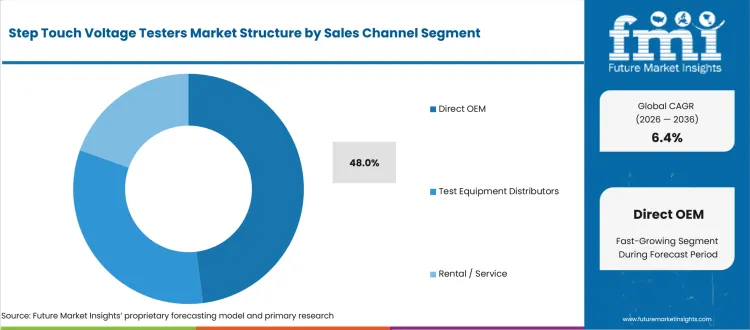
Direct OEM buying is important in step touch voltage testing due to method control and accessory matching. Buyers are not choosing a meter alone. They need current injection units and probes. Foot electrodes and cables must also match software setup and training during field campaigns. This pushes complex projects toward direct technical support.
- Direct OEM is estimated to hold 48.0% share in 2026, shaped by buyer need for calibrated systems and training from one supplier. The channel also overlaps underground power cable partial discharge and fault location test equipment procurement routes. High-voltage crews often compare technical support and field accessories across related tools.
- Distributor access remains useful for simpler electrical instruments. Direct OEM support gains importance due to software setup, method guidance and post-sale troubleshooting. OMICRON’s PTM for HGT1 supports automated testing and GPS-based test-point tracking. That shows why direct support can influence system selection.
What are the drivers, restraints, and opportunities in the step touch voltage testers market?
Near-term purchases are being shaped by worker-exposure proof, system cost pressure, and rental-led access for project commissioning.
- Driver: Worker-exposure proof is driving tester spending due to utility need for documented voltage checks around grounding systems.
- Restraint: Full-system cost restrains adoption among smaller contractors owing to the cost of injection units and probes plus field leads and reporting software.
- Opportunity: Rental and service models gain traction from EPC projects that need calibrated systems during limited commissioning windows.
Utility and EPC buyers use step touch voltage results for high-voltage site acceptance evidence. The purchase trigger is supported by grid expansion and the need to show that grounding designs protect personnel during fault events. IEA reported in February 2025 that more than 1,600 GW of solar and wind projects in advanced development were awaiting grid connections. That queue creates more substations and interconnection yards needing acceptance tests, which gives specialist suppliers a clearer route into utility and renewable project budgets.
System cost remains a restraint for smaller contractors and test labs that may not use a full kit every month. IEA reported in February 2025 that power transformer prices had increased by around 75% in real terms, showing the wider capital pressure around grid equipment procurement. That pressure makes buyers cautious about owning every specialist instrument during short project windows and one-off substation jobs. Suppliers that combine rental access, calibration support and method guidance can convert the cost barrier into service-led revenue.
Project-based access creates an opening for suppliers that can support short commissioning windows and mobile field teams. The USA Department of Energy stated in March 2026 that the SPARK funding opportunity would provide about USD 1.9 billion for electricity infrastructure investments. That policy signal supports faster grid-upgrade work and raises the need for test equipment that can move between sites. Startups and regional service firms can compete by pairing calibrated kits and trained technicians plus fast report delivery for EPC closeout work.
Which country CAGRs are profiled in the step touch voltage testers market?
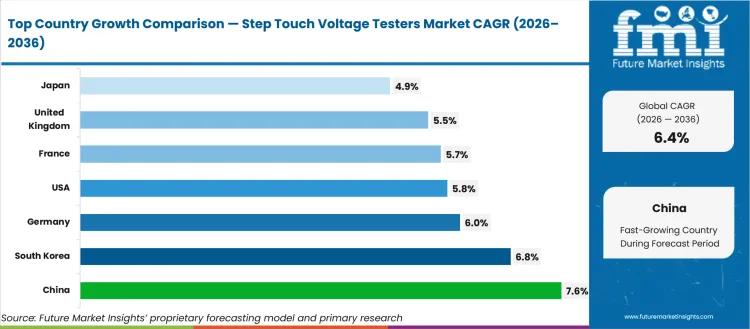
| Country | CAGR |
|---|---|
| United States | 5.8% |
| United Kingdom | 5.5% |
| Germany | 6.0% |
| France | 5.7% |
| Japan | 4.9% |
| China | 7.6% |
| South Korea | 6.8% |
| India | 8.1% |
How do country-level CAGRs compare in the step touch voltage testers market?
Country CAGR variation in step touch voltage testers is best read by separating renewal-led maintenance markets from project-led grid expansion markets. The United States and the United Kingdom sit in one renewal group tied to established utility procurement. Germany and France rely on safety documentation cycles and formal grid planning. Japan and South Korea show narrower growth profiles shaped by dense industrial grids and strict project approval. China and India carry more project-led demand due to renewable pooling stations and transmission build-out. For buyers and suppliers, the comparison shows that direct OEM support and rental access can be more important than equipment price alone. Field service depth also needs to match outage timing and local grid investment cycles.
- By 2036, the United States is projected to record 5.8% CAGR due to utility safety programs and reinforcement around high-load corridors. The USA Energy Information Administration reported in May 2026 that net electricity generation increased 4.5% in March 2026 from the year-earlier month. Replacement cycles keep growth steadier than new-build markets.
- The United Kingdom is expected to grow at 5.5% CAGR during the forecast period, driven by renewable grid integration and tight outage windows. UK government Energy Trends reported in March 2026 that renewables supplied 52.5% of electricity generation in 2025. Contractor-led testing keeps equipment ownership more selective than direct utility purchase markets.
- Over the assessment period, Germany is forecast to advance at 6.0% CAGR owing to standards-led buying and renewable grid interfaces. Bundesnetzagentur reported in January 2026 that renewable installed capacity reached just under 210 GW in 2025. Buyers favor documented methods and technical support over quick replacement buying.
- Through 2036, France is anticipated to post 5.7% CAGR shaped by transmission reliability work and formal procurement paths. RTE’s 2025 Electricity Review stated that low-carbon generation remained over 95% of France’s electricity output. That grid mix supports grounding checks around gas insulated substations and cross-border flows.
- Japan is likely to expand at 4.9% CAGR by 2036, supported by compact substations and cautious utility approval cycles. Japan’s Energy White Paper 2025 summary stated that energy self-sufficiency was 15.3%. Long equipment life and careful supplier selection limit rapid tester turnover relative to India and China.
- China is estimated to rise at 7.6% CAGR between 2026 and 2036, propelled by renewable construction and state utility tender activity. China’s State Council reported in January 2026 that installed renewable capacity rose above 1,800 GW in 2025. Domestic price competition limits premium imports in routine projects.
- South Korea is projected to record 6.8% CAGR by 2036, supported by grid reinforcement for offshore wind and high-load industrial clusters. IEA World Energy Investment 2025 noted Korea’s energy self-sufficiency rate at 19%. That security context supports HVDC transmission systems and grid upgrades in dense industrial zones.
- India is expected to grow at 8.1% CAGR during the forecast period, led by new transmission assets and renewable pooling substations. India’s Press Information Bureau reported in June 2026 that installed wind capacity reached 56.09 GW in March 2026. Project commissioning volume creates a more tender-driven purchase profile.
Who are the notable companies in the step touch voltage testers market?
OMICRON, Metrel, Megger, DV Power, BAUR, SCOPE T&M, AEMC Instruments, Kyoritsu, and Sonel are the notable companies shaping this market.
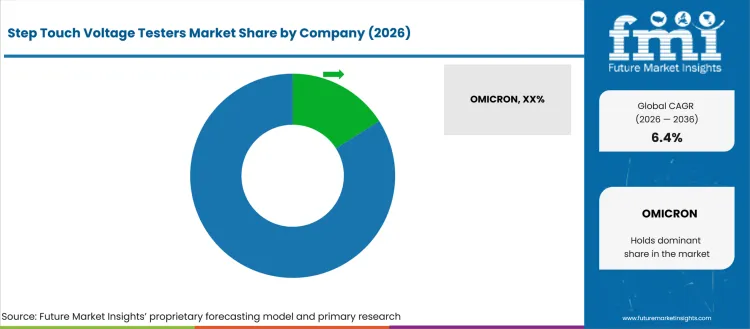
Supplier competition is shaped by the level of control buyers want over grounding safety proof. OMICRON and Metrel are more relevant for dedicated step touch voltage workflows. Megger and AEMC Instruments are suited to broader electrical test portfolios. Kyoritsu and Sonel support field maintenance accounts. DV Power, BAUR and SCOPE T&M gain relevance in adjacent high-voltage testing support. The supplier selection question is practical. Buyers must decide whether method control belongs at the specialist system layer or a broader field-test portfolio.
- Dedicated system buyers often compare OMICRON and Metrel due to their focus on step touch voltage and protective earthing workflows. These companies are important during utility programs that need current injection and voltage measurement to follow one field method during acceptance testing.
- Broader electrical test buyers evaluate Megger and AEMC Instruments for grounding and maintenance portfolios. Kyoritsu and Sonel serve comparable field maintenance needs. Their relevance is suited to facilities and contractors that need several electrical instruments before investing in a specialist ground-grid system.
- Project-driven buyers use DV Power and BAUR in adjacent high-voltage workflows. Their role is influenced by cable, transformer and ground-grid testing needs that often appear in the same substation commissioning or maintenance program.
- Regional utility and EPC accounts use SCOPE T&M for field access and local service coverage. The company is relevant due to technical support and availability during short outage windows or contractor-led test campaigns.
Competitive Benchmarking: Step Touch Voltage Testers Market
| Company | Grounding Safety Portfolio | Field Reporting Fit | Utility/EPC Access | Geographic Reach |
|---|---|---|---|---|
| OMICRON | High | Strong | High | Global |
| Metrel | High | Medium | Medium | Global |
| Megger | Medium | Medium | High | Global |
| DV Power | Medium | Medium | Strong | Global |
| BAUR | Medium | Medium | Medium | Global |
| SCOPE T&M | Medium | Medium | Strong | Regional |
| AEMC Instruments | Medium | Medium | Medium | Regional |
| Kyoritsu | Medium | Medium | Medium | Global |
| Sonel | Medium | Medium | Medium | Regional |
Source: Future Market Insights competitive analysis, 2026. Ratings reflect relative portfolio relevance, workflow or project fit, service capability, and geographic reach.
Key Developments in the Step Touch Voltage Testers Market
- In April 2025, OMICRON reported fiscal year 2024 results and highlighted the market launch of the CMC 500 protection test set. The action is significant for this market because grid-test suppliers are investing in field-test technology during utility modernization of protection and grounding safety programs.
- In June 2025, DV Power presented the CVA500 for current transformer and voltage transformer testing. The launch is relevant due to high-voltage field crews buying grounding and transformer test systems under related technical procurement routes, which supports account access for suppliers serving substations.
- In January 2025, DV Power updated its GGT Series user manual for ground grid testers. The update is relevant because product documentation and repeatable procedures affect how utilities use grounding systems during maintenance and acceptance testing.
- In December 2025, AEMC Instruments introduced the CA 6011 point-to-point continuity tester for large interconnected systems. This is important to grounding workflows due to continuity checks supporting inspection routines around bonded structures and related electrical safety assets.
Key Players in the Step Touch Voltage Testers Market
Integrated grounding test system providers
- OMICRON
- Metrel
Grounding and electrical test portfolio suppliers
- Megger
- AEMC Instruments
- Kyoritsu
- Sonel
Regional and adjacent workflow specialists
- DV Power
- BAUR
- SCOPE T&M
Step Touch Voltage Testers Market - Report Scope
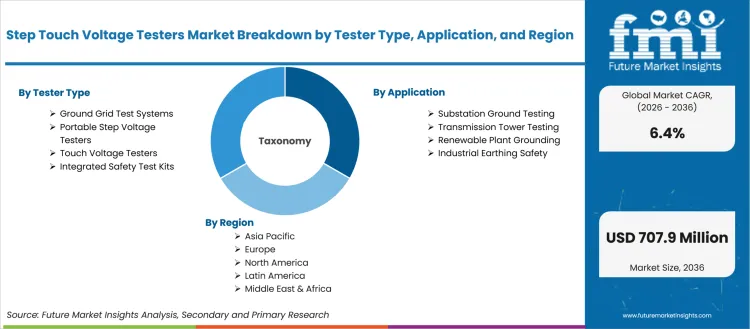
| Coverage field | Report scope |
|---|---|
| Market breakdown | Step Touch Voltage Testers Market Breakdown By Tester Type, Application, Current Injection, End Use, Sales Channel, and Region |
| Market Definition | Equipment used to measure hazardous step and touch voltage around grounded structures during fault or simulated fault conditions |
| Regions Covered | North America, Latin America, Europe, East Asia, South Asia and Pacific, Middle East and Africa |
| Countries Covered | United States, United Kingdom, Germany, France, Japan, China, South Korea, India and 30+ countries |
| Key Companies Profiled | OMICRON, Metrel, Megger, DV Power, BAUR, SCOPE T&M, AEMC Instruments, Kyoritsu, Sonel |
| Forecast Period | 2026 to 2036 |
| Approach | Hybrid bottom-up and top-down methodology using equipment demand, project workflows, application mix, country grid activity and supplier portfolio evidence |
Step Touch Voltage Testers Market - Research Methodology
| Method | Approach |
|---|---|
| Primary Research | FMI analysts reviewed inputs from utilities, EPC contractors, electrical test labs and industrial safety teams. Inputs focused on grounding test frequency, current injection choices, rental use, calibration needs and reporting expectations during commissioning or maintenance work. |
| Desk Research | Desk research covered OSHA electrical safety language, IEC high-voltage installation standards, government electricity data, renewable capacity releases and official company product information. Product relevance was checked against step voltage, touch voltage, ground impedance and earthing safety workflows. |
| Market Sizing and Forecasting | The model combined equipment volume, average system pricing, application mix, direct OEM share, rental penetration and country-level grid activity. Forecast assumptions were adjusted for renewable interconnection, substation renewal, utility maintenance cycles and contractor commissioning demand. |
| Data Validation | Forecasts were checked against adjacent electrical test equipment categories, utility investment signals, public energy statistics and verified supplier portfolios. Duplicate external statistics were avoided by assigning each evidence point to one section before final writing. |
Step Touch Voltage Testers Market by Segments
Step Touch Voltage Testers Market segmented by Tester Type:
- Portable Step Voltage Testers
- Touch Voltage Testers
- Ground Grid Test Systems
- Integrated Safety Test Kits
Step Touch Voltage Testers Market segmented by Application:
- Substation Ground Testing
- Transmission Tower Testing
- Renewable Plant Grounding
- Industrial Earthing Safety
Step Touch Voltage Testers Market segmented by Current Injection:
- Low-current Systems
- Medium-current Systems
- High-current Systems
Step Touch Voltage Testers Market segmented by End Use:
- Utilities
- EPC Contractors
- Electrical Test Labs
- Industrial Facilities
Step Touch Voltage Testers Market segmented by Sales Channel:
- Direct OEM
- Test Equipment Distributors
- Rental / Service
Step Touch Voltage Testers Market by Region:
- North America
- United States
- Canada
- Mexico
- Latin America
- Brazil
- Chile
- Rest of Latin America
- Western Europe
- Germany
- United Kingdom
- France
- Italy
- Spain
- BENELUX
- Nordics
- Rest of Western Europe
- Eastern Europe
- Russia
- Poland
- Hungary
- Balkan and Baltic countries
- Rest of Eastern Europe
- East Asia
- China
- Japan
- South Korea
- South Asia and Pacific
- India
- ASEAN
- Australia and New Zealand
- Rest of South Asia and Pacific
- Middle East and Africa
- Kingdom of Saudi Arabia
- Other GCC Countries
- Turkiye
- South Africa
- Other African Union
- Rest of Middle East and Africa
Research Sources and Bibliography
- Occupational Safety and Health Administration. (2026). 1910.269 App C - Protection From Hazardous Differences in Electric Potential. USA Department of Labor.
- International Energy Agency. (2025, March). Global Energy Review 2025: Electricity. International Energy Agency.
- International Energy Agency. (2025, October). Renewables 2025: Renewable electricity. International Energy Agency.
- International Energy Agency. (2026, January). Electricity 2026: Supply. International Energy Agency.
- International Energy Agency. (2025, June). Japan and Korea. World Energy Investment 2025. International Energy Agency.
- USA Energy Information Administration. (2026, May). Electricity Monthly Update: March 2026. USA Energy Information Administration.
- Department for Energy Security and Net Zero. (2026, March). Energy Trends March 2026. UK Government.
- Bundesnetzagentur. (2026, January 8). Growth in renewable energy in 2025. Bundesnetzagentur.
- RTE. (2026, April). 2025 Electricity Review: Key Findings. RTE.
- Agency for Natural Resources and Energy. (2025, August). Energy White Paper 2025 Summary. Ministry of Economy, Trade and Industry.
- State Council of the People’s Republic of China. (2026, January 30). Renewables account for over 60 pct of China’s power capacity in 2025.
- Ministry of Climate, Energy and Environment. (2025, December 23). Ministry of Climate and Energy and Environment to Hold 2025 Power System Policy Sharing Meeting. Republic of Korea.
- Press Information Bureau. (2025, December 29). 2025 Marks Highest-Ever Renewable Energy Expansion. Government of India.
- Press Information Bureau. (2026, June 14). Global Wind Day 2026. Government of India.
- OMICRON. (2025, April 10). Successful fiscal year 2024. OMICRON electronics.
- OMICRON. (2026). Step and Touch Voltage Tests. OMICRON electronics.
- Metrel. (2026). MI 3295 Step Contact Voltage Measuring System. Metrel d.o.o.
- IEC. (2021, July 7). IEC 61936-1:2021 Power installations exceeding 1 kV AC and 1.5 kV DC. International Electrotechnical Commission.
- DV Power. (2025, June 18). CT, VT and CVT Testing with the New CVA500. DV Power.
- AEMC Instruments. (2025, December 23). AEMC Instruments Introduces the NEW Point-to-Point Continuity Tester Model CA 6011. AEMC Instruments.
- Megger. (2026). New Essential 5 kV and 10 kV insulation resistance testers. Megger.
This bibliography is provided for reader reference and uses primary government, standards-body, official trade body, and company sources.
This Report Answers
- What is the expected global value of the Step Touch Voltage Testers Market in 2026 and 2036?
- What CAGR is forecast for step touch voltage testers during the 2026 to 2036 period?
- Which tester type category is used to assess Ground Grid Test Systems demand in 2026?
- Why do utilities and EPC contractors buy integrated ground grid test systems?
- How does substation ground testing shape application demand for step touch voltage testers?
- Which countries are compared in the step touch voltage testers forecast?
- Which companies compete across grounding safety test workflows and adjacent electrical testing portfolios?
- What product types are included within the step touch voltage testers definition?
- How does FMI size and forecast step touch voltage tester demand across segments and countries?
- What buyer factors should executives assess before choosing a step touch voltage testing system?
Frequently Asked Questions
What is driving growth in the Step Touch Voltage Testers Market?
Growth is driven by utility grounding safety proof, renewable interconnection work and demand for traceable field reports.
Why should executives track the Step Touch Voltage Testers Market?
Executives should track this market because grounding safety proof is becoming a mandatory requirement for substations renewable interconnections and high voltage maintenance approval.
What business problem does the Step Touch Voltage Testers Market address?
It verifies whether fault conditions can create unsafe step or touch voltages around grounded equipment before workers enter energized or recently modified sites.
What should procurement leaders evaluate before selecting suppliers?
Procurement leaders should evaluate current injection capability measurement accuracy reporting quality calibration access training support and local service availability.
What can limit return on investment for buyers?
Return on investment can be limited by high system cost limited utilization windows and lack of rental or service flexibility for short commissioning projects.
How can suppliers build executive confidence?
Suppliers build confidence by delivering reliable field proven measurements traceable reports stable injection control and responsive technical support during outages.
Preview the report firsthand - request a free sample
Get SampleGet the brochure for pricing and purchase details.
Get PDFTable of Content
- Key Takeaways
- Market Size and CAGR
- Top Growth Driver
- Fastest Growing Segment
- Leading Region
- Key Companies
- Emerging Opportunities
- Executive Summary
- Global Market Outlook
- Demand-side Trends
- Supply-side Trends
- Technology Roadmap Analysis
- Analysis and Recommendations
- Analyst Perspective (What is happening? Why now? What should investors know?)
- Key Questions Answered
- How large is the market?
- What is the CAGR?
- What are key trends?
- Which region dominates?
- Who are the leaders?
- Market Overview
- Market Coverage / Taxonomy
- Market Definition / Scope / Limitations
- Research Methodology
- Chapter Orientation
- Analytical Lens and Working Hypotheses
- Market Structure, Signals, and Trend Drivers
- Benchmarking and Cross-market Comparability
- Market Sizing, Forecasting, and Opportunity Mapping
- Research Design and Evidence Framework
- Desk Research Programme (Secondary Evidence)
- Expert Input and Fieldwork (Primary Evidence)
- Tooling, Models, and Reference Databases
- Data Engineering and Model Build
- Quality Assurance and Audit Trail
- Market Background
- Market Dynamics (Drivers, Restraints, Opportunity, Trends)
- Scenario Forecast (Optimistic, Likely, Conservative)
- Impact Analysis
- AI Impact
- Sustainability Impact
- Regulatory Impact
- Technology Impact
- Consumer / Buyer Analysis
- Purchase Drivers
- Adoption Barriers
- Buyer Journey
- Opportunity Map Analysis
- Product Life Cycle Analysis
- Supply Chain Analysis
- Investment Feasibility Matrix
- Value Chain Analysis
- PESTLE and Porter's Analysis
- Regulatory Landscape
- Regional Parent Market Outlook
- Production and Consumption Statistics
- Import and Export Statistics
- Global Market Analysis and Forecast, 2021 to 2036
- Historical Market Size Value (USD Million) & Volume (Unit) Analysis, 2021 to 2025
- Current and Future Market Size Value (USD Million) & Volume (Unit) Projections, 2026 to 2036
- Y-o-Y Growth Trend Analysis
- Absolute $ Opportunity Analysis
- Global Market Pricing Analysis, 2021 to 2036
- Global Market Analysis and Forecast, By Tester Type, 2021 to 2036
- Introduction / Key Findings
- Historical Market Size Value (USD Million) & Volume (Unit) Analysis By Tester Type, 2021 to 2025
- Current and Future Market Size Value (USD Million) & Volume (Unit) Analysis and Forecast By Tester Type, 2026 to 2036
- Ground Grid Test Systems
- Portable Step Voltage Testers
- Touch Voltage Testers
- Integrated Safety Test Kits
- Ground Grid Test Systems
- Y-o-Y Growth Trend Analysis By Tester Type, 2021 to 2025
- Absolute $ Opportunity Analysis By Tester Type, 2026 to 2036
- Global Market Analysis and Forecast, By Application, 2021 to 2036
- Introduction / Key Findings
- Historical Market Size Value (USD Million) & Volume (Unit) Analysis By Application, 2021 to 2025
- Current and Future Market Size Value (USD Million) & Volume (Unit) Analysis and Forecast By Application, 2026 to 2036
- Substation Ground Testing
- Transmission Tower Testing
- Renewable Plant Grounding
- Industrial Earthing Safety
- Substation Ground Testing
- Y-o-Y Growth Trend Analysis By Application, 2021 to 2025
- Absolute $ Opportunity Analysis By Application, 2026 to 2036
- Global Market Analysis and Forecast, By Current Injection, 2021 to 2036
- Introduction / Key Findings
- Historical Market Size Value (USD Million) & Volume (Unit) Analysis By Current Injection, 2021 to 2025
- Current and Future Market Size Value (USD Million) & Volume (Unit) Analysis and Forecast By Current Injection, 2026 to 2036
- Medium-current Systems
- Low-current Systems
- High-current Systems
- Medium-current Systems
- Y-o-Y Growth Trend Analysis By Current Injection, 2021 to 2025
- Absolute $ Opportunity Analysis By Current Injection, 2026 to 2036
- Global Market Analysis and Forecast, By End Use, 2021 to 2036
- Introduction / Key Findings
- Historical Market Size Value (USD Million) & Volume (Unit) Analysis By End Use, 2021 to 2025
- Current and Future Market Size Value (USD Million) & Volume (Unit) Analysis and Forecast By End Use, 2026 to 2036
- Utilities
- EPC Contractors
- Industrial Facilities
- Electrical Test Labs
- Utilities
- Y-o-Y Growth Trend Analysis By End Use, 2021 to 2025
- Absolute $ Opportunity Analysis By End Use, 2026 to 2036
- Global Market Analysis and Forecast, By Sales Channel, 2021 to 2036
- Introduction / Key Findings
- Historical Market Size Value (USD Million) & Volume (Unit) Analysis By Sales Channel, 2021 to 2025
- Current and Future Market Size Value (USD Million) & Volume (Unit) Analysis and Forecast By Sales Channel, 2026 to 2036
- Direct OEM
- Test Equipment Distributors
- Rental / Service
- Direct OEM
- Y-o-Y Growth Trend Analysis By Sales Channel, 2021 to 2025
- Absolute $ Opportunity Analysis By Sales Channel, 2026 to 2036
- Global Market Analysis and Forecast, By Region, 2021 to 2036
- Introduction
- Historical Market Size Value (USD Million) & Volume (Unit) Analysis By Region, 2021 to 2025
- Current Market Size Value (USD Million) & Volume (Unit) Analysis and Forecast By Region, 2026 to 2036
- North America
- Latin America
- Western Europe
- Eastern Europe
- East Asia
- South Asia and Pacific
- Middle East & Africa
- Market Attractiveness Analysis By Region
- North America Market Analysis and Forecast, By Country, 2021 to 2036
- Historical Market Size Value (USD Million) & Volume (Unit) Trend Analysis By Market Taxonomy, 2021 to 2025
- Market Size Value (USD Million) & Volume (Unit) Forecast By Market Taxonomy, 2026 to 2036
- By Country
- USA
- Canada
- Mexico
- By Tester Type
- By Application
- By Current Injection
- By End Use
- By Sales Channel
- By Country
- Market Attractiveness Analysis
- By Country
- By Tester Type
- By Application
- By Current Injection
- By End Use
- By Sales Channel
- Key Takeaways
- Latin America Market Analysis and Forecast, By Country
- Historical Market Size Value (USD Million) & Volume (Unit) Trend Analysis By Market Taxonomy, 2021 to 2025
- Market Size Value (USD Million) & Volume (Unit) Forecast By Market Taxonomy, 2026 to 2036
- By Country
- Brazil
- Chile
- Rest of Latin America
- By Tester Type
- By Application
- By Current Injection
- By End Use
- By Sales Channel
- By Country
- Market Attractiveness Analysis
- By Country
- By Tester Type
- By Application
- By Current Injection
- By End Use
- By Sales Channel
- Key Takeaways
- Western Europe Market Analysis and Forecast, By Country
- Historical Market Size Value (USD Million) & Volume (Unit) Trend Analysis By Market Taxonomy, 2021 to 2025
- Market Size Value (USD Million) & Volume (Unit) Forecast By Market Taxonomy, 2026 to 2036
- By Country
- Germany
- UK
- Italy
- Spain
- France
- Nordic
- BENELUX
- Rest of Western Europe
- By Tester Type
- By Application
- By Current Injection
- By End Use
- By Sales Channel
- By Country
- Market Attractiveness Analysis
- By Country
- By Tester Type
- By Application
- By Current Injection
- By End Use
- By Sales Channel
- Key Takeaways
- Eastern Europe Market Analysis and Forecast, By Country
- Historical Market Size Value (USD Million) & Volume (Unit) Trend Analysis By Market Taxonomy, 2021 to 2025
- Market Size Value (USD Million) & Volume (Unit) Forecast By Market Taxonomy, 2026 to 2036
- By Country
- Russia
- Poland
- Hungary
- Balkan & Baltic
- Rest of Eastern Europe
- By Tester Type
- By Application
- By Current Injection
- By End Use
- By Sales Channel
- By Country
- Market Attractiveness Analysis
- By Country
- By Tester Type
- By Application
- By Current Injection
- By End Use
- By Sales Channel
- Key Takeaways
- East Asia Market Analysis and Forecast, By Country
- Historical Market Size Value (USD Million) & Volume (Unit) Trend Analysis By Market Taxonomy, 2021 to 2025
- Market Size Value (USD Million) & Volume (Unit) Forecast By Market Taxonomy, 2026 to 2036
- By Country
- China
- Japan
- South Korea
- By Tester Type
- By Application
- By Current Injection
- By End Use
- By Sales Channel
- By Country
- Market Attractiveness Analysis
- By Country
- By Tester Type
- By Application
- By Current Injection
- By End Use
- By Sales Channel
- Key Takeaways
- South Asia and Pacific Market Analysis and Forecast, By Country
- Historical Market Size Value (USD Million) & Volume (Unit) Trend Analysis By Market Taxonomy, 2021 to 2025
- Market Size Value (USD Million) & Volume (Unit) Forecast By Market Taxonomy, 2026 to 2036
- By Country
- India
- ASEAN
- Australia & New Zealand
- Rest of South Asia and Pacific
- By Tester Type
- By Application
- By Current Injection
- By End Use
- By Sales Channel
- By Country
- Market Attractiveness Analysis
- By Country
- By Tester Type
- By Application
- By Current Injection
- By End Use
- By Sales Channel
- Key Takeaways
- Middle East & Africa Market Analysis and Forecast, By Country
- Historical Market Size Value (USD Million) & Volume (Unit) Trend Analysis By Market Taxonomy, 2021 to 2025
- Market Size Value (USD Million) & Volume (Unit) Forecast By Market Taxonomy, 2026 to 2036
- By Country
- Kingdom of Saudi Arabia
- Other GCC Countries
- Türkiye
- South Africa
- Other African Union
- Rest of Middle East & Africa
- By Tester Type
- By Application
- By Current Injection
- By End Use
- By Sales Channel
- By Country
- Market Attractiveness Analysis
- By Country
- By Tester Type
- By Application
- By Current Injection
- By End Use
- By Sales Channel
- Key Takeaways
- Key Countries Market Analysis
- USA
- Pricing Analysis
- Market Share Analysis, 2025
- By Tester Type
- By Application
- By Current Injection
- By End Use
- By Sales Channel
- Canada
- Pricing Analysis
- Market Share Analysis, 2025
- By Tester Type
- By Application
- By Current Injection
- By End Use
- By Sales Channel
- Mexico
- Pricing Analysis
- Market Share Analysis, 2025
- By Tester Type
- By Application
- By Current Injection
- By End Use
- By Sales Channel
- Brazil
- Pricing Analysis
- Market Share Analysis, 2025
- By Tester Type
- By Application
- By Current Injection
- By End Use
- By Sales Channel
- Chile
- Pricing Analysis
- Market Share Analysis, 2025
- By Tester Type
- By Application
- By Current Injection
- By End Use
- By Sales Channel
- Germany
- Pricing Analysis
- Market Share Analysis, 2025
- By Tester Type
- By Application
- By Current Injection
- By End Use
- By Sales Channel
- UK
- Pricing Analysis
- Market Share Analysis, 2025
- By Tester Type
- By Application
- By Current Injection
- By End Use
- By Sales Channel
- Italy
- Pricing Analysis
- Market Share Analysis, 2025
- By Tester Type
- By Application
- By Current Injection
- By End Use
- By Sales Channel
- Spain
- Pricing Analysis
- Market Share Analysis, 2025
- By Tester Type
- By Application
- By Current Injection
- By End Use
- By Sales Channel
- France
- Pricing Analysis
- Market Share Analysis, 2025
- By Tester Type
- By Application
- By Current Injection
- By End Use
- By Sales Channel
- India
- Pricing Analysis
- Market Share Analysis, 2025
- By Tester Type
- By Application
- By Current Injection
- By End Use
- By Sales Channel
- ASEAN
- Pricing Analysis
- Market Share Analysis, 2025
- By Tester Type
- By Application
- By Current Injection
- By End Use
- By Sales Channel
- Australia & New Zealand
- Pricing Analysis
- Market Share Analysis, 2025
- By Tester Type
- By Application
- By Current Injection
- By End Use
- By Sales Channel
- China
- Pricing Analysis
- Market Share Analysis, 2025
- By Tester Type
- By Application
- By Current Injection
- By End Use
- By Sales Channel
- Japan
- Pricing Analysis
- Market Share Analysis, 2025
- By Tester Type
- By Application
- By Current Injection
- By End Use
- By Sales Channel
- South Korea
- Pricing Analysis
- Market Share Analysis, 2025
- By Tester Type
- By Application
- By Current Injection
- By End Use
- By Sales Channel
- Russia
- Pricing Analysis
- Market Share Analysis, 2025
- By Tester Type
- By Application
- By Current Injection
- By End Use
- By Sales Channel
- Poland
- Pricing Analysis
- Market Share Analysis, 2025
- By Tester Type
- By Application
- By Current Injection
- By End Use
- By Sales Channel
- Hungary
- Pricing Analysis
- Market Share Analysis, 2025
- By Tester Type
- By Application
- By Current Injection
- By End Use
- By Sales Channel
- Kingdom of Saudi Arabia
- Pricing Analysis
- Market Share Analysis, 2025
- By Tester Type
- By Application
- By Current Injection
- By End Use
- By Sales Channel
- Türkiye
- Pricing Analysis
- Market Share Analysis, 2025
- By Tester Type
- By Application
- By Current Injection
- By End Use
- By Sales Channel
- South Africa
- Pricing Analysis
- Market Share Analysis, 2025
- By Tester Type
- By Application
- By Current Injection
- By End Use
- By Sales Channel
- USA
- Market Structure Analysis
- Competition Dashboard
- Competition Benchmarking
- Market Share Analysis of Top Players
- By Region
- By Tester Type
- By Application
- By Current Injection
- By End Use
- By Sales Channel
- Emerging Startups
- Innovation Benchmarking
- Competition Analysis
- Competition Deep Dive
- OMICRON
- Overview
- Product Portfolio
- Profitability by Market Segments (Product/Region/Sales Channel)
- Sales Footprint
- Strategy Overview
- Marketing Strategy
- Product Strategy
- Channel Strategy
- Metrel
- Megger
- Kyoritsu
- Sonel
- OMICRON
- Case Studies
- Success Stories
- Recent Developments
- Competition Deep Dive
- Assumptions & Acronyms Used


