Stuffed and Plush Toy Market Outlook 2024 to 2034

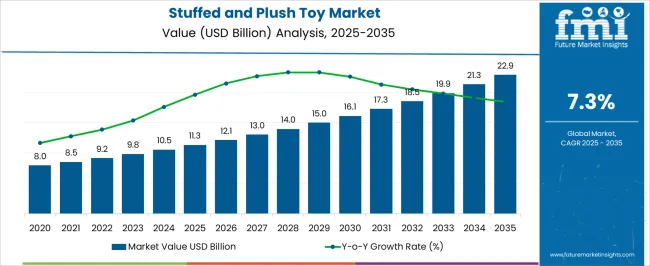
The stuffed and plush toy market share is estimated to exhibit healthy growth throughout the forecast period, expanding at a CAGR of 7.3%. The market size is expected to expand from US$ 10,543.9 million in 2024 to US$ 21,243.6 million by 2034.

Key Trends Shaping the Stuffed and Plush Toy Market

  • Surging preference for custom-made plush and fur toys motivates key players to develop unique action-figure plush toys and others.
  • Several leading players are further innovating plush toys with GPS trackers and sensors to ensure their leading stance in the market.
  • Rising preference for action-figure and vintage stuffed toys among millennials and Gen Zs is raising the demand for stuffed and plush toys.
  • Increasing penetration of the eCommerce industry is projected to ramp up the sales of stuffed and plush toys.
  • The escalating popularity of anime characters and vintage cartoons among young kids and millennials is inducing market players to work towards getting permissions for the licenses for the trademark characters to leverage the increasing demand.
Attributes Key Insights
Estimated Stuffed and Plush Toy Market Size (2024E) US$ 10,543.9 million
Projected Stuffed and Plush Toy Industry Value (2034F) US$ 21,243.6 million
Value-based CAGR (2024 to 2034) 7.3%

Don't pay for what you don't need

Customize your report by selecting specific countries or regions and save 30%!

Overview of Markets Adjacent to the Global Stuffed and Plush Toy Market

The table below offers key insights into the markets that are closely associated with the stuffed and plush toy market. For this study, the decompression toy market and the cat toy market are the other two markets that are considered.

Based on the growth rate, the stuffed and plush toy market is projected to rank higher than the other two markets, i.e., 7.3% CAGR, thanks to increasing competition among the manufacturers which is driving innovation in their product offerings.

Next up is the cat toy market, which is projected to expand at a CAGR of 6.1% through 2034. The market is driven by growing concerns about the environmental friendliness and safety of the products, which are addressed by key players in their new launches.

The market for decompression toys is propelled by the growing demand for DIY and customized decompression toy kits that allow for creativity and personalization.

Stuffed and Plush Toy Market:

Attributes Stuffed and Plush Toy Market
CAGR (2024 to 2034) 7.3%
Growth Factor Surging demand for soft figurines
Opportunity Manufacturers are developing custom-made plush and fur toys
Key Trends Increasing penetration of e-commerce industry

Decompression Toy Market:

Attributes Decompression Toy Market
CAGR (2024 to 2034) 5.3%
Growth Factor Extending awareness about stress management and mental health
Opportunity Increasing research and development efforts to result in distinct toy designs and features
Key Trends Integration of technology like interactive elements and smart sensors to raise the appeal of decompression toys

Cat Toy Market:

Attributes Cat Toy Market
CAGR (2024 to 2034) 6.1%
Growth Factor Surging sales of cat toy subscription box services
Opportunity Key players explore the development of bio-degradable and natural toys
Key Trends Growing inclination for online purchasing is projected to be reflected in the sales of cat toys

Category-wise Stuffed and Plush Toy Market Insights

Cartoon Toys to Capture a Notable Market Share

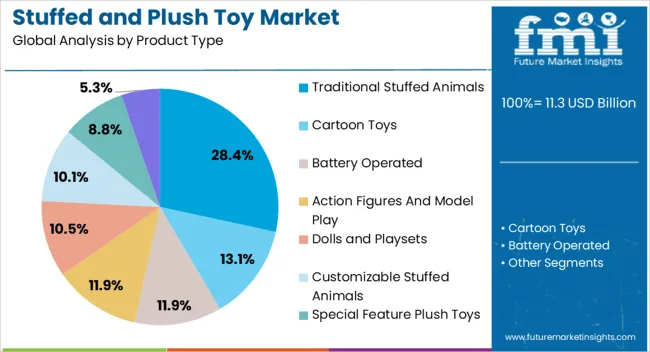
Leading Product Type Cartoon Toys
Value Share (2024) 19.80%

Based on product type, the cartoon toys segment is projected to acquire a market share of 19.80% in 2024. The segment is driven by the following factors:

  • Growing influence of animal TV shows and surging merchandising trends are expected to propel sales of cartoon toys.
  • Increasing initiatives like events and giveaway campaigns at different places are expected to promote cartoon toys at an extensive scale.

Synthetic Material is a Highly Sought-after Stuffed and Plush Toys Material

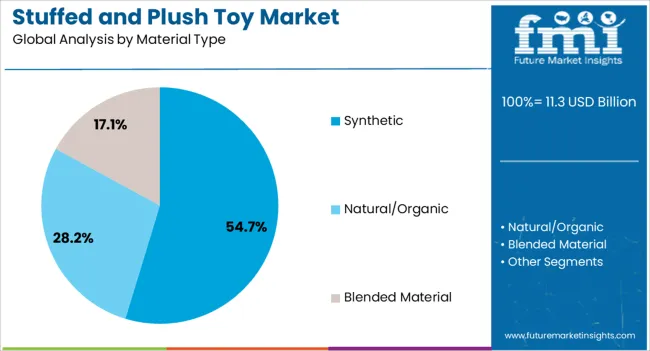
Leading Material Synthetic Material
Value Share (2024) 45.70%

The synthetic material is significantly used to make stuffed and plush toys. In 2024, the synthetic material segment is projected to acquire a value share of 45.70%. Leading growing factors are:

  • Cost-effectiveness and easy availability of synthetic materials-based stuffed and plush toys at various sales channels are contributing to its demand in households with economic income.
  • Demand for synthetic materials is increasing in the development of stuffed and plush toys as they are easier to maintain than the ones with natural fibers, thus making them convenient for parents.
Sudip Saha
Sudip Saha

Principal Consultant

Talk to Analyst

Find your sweet spots for generating winning opportunities in this market.

Stuffed and Plush Toy Market Analysis by Country

Countries Forecast CAGR (2024 to 2034)
The United States 4.20%
Spain 5.80%
China 9.20%
India 11.10%
Japan 6.90%

Market in India Spearheaded by Favorable Government Measures for the Sales of Stuffed and Plush Toys

According to the latest market research conducted by FMI analysts, the India stuffed and plush toy market is projected to pace at a CAGR of 11.1% through 2034. The market is also anticipated to acquire a sizeable share of the Asia Pacific region. Key factors that are contributing to market growth are:

  • Indian government is encouraging entrepreneurs and startups to increase the domestic manufacture of toys and games to meet the increasing demand for toys, decrease imports, and push the country’s contribution to global toy exports. To stimulate the toy business in the country, the government is hiking the import levies, and offering financial subsidies and incentives to indigenous toy makers.
  • Top toy manufacturers are incessantly launching new and unique plush toys that feature interactive elements, licensed themes, and popular characters to engage and arouse interest among consumers.

Toy Companies in the United States to Partner up with Cartoon and Movie Makers to Increase their Revenue

The United States stuffed and plush toy industry is estimated to expand at a CAGR of 4.2% through 2034. This regional market holds a prominent place in North America. Salient factors that impact the market dynamics are:

  • Increasing popularity of action movies and animated movies is motivating top manufacturers of stuffed and plush toys to focus on partnerships, mergers, and acquisitions with animated cartoon makers and movie makers to widen their portfolio and advertise their products to potential customers.
  • Growing demand for plush toys among Gen Z and millennials as they seek to overcome their challenges by taking comfort in toys that evoke nostalgia. These toys are a portal to positive memories and offer to provide security.

Hyped up Kawaii Culture in Japan to Drive Sales of Stuffed and Plush Toys in the Country

The stuffed and plush toy industry in Japan is expected to propel at a CAGR of 6.9% from 2024 to 2034. Over the forecast period, the market is anticipated to be catalyzed by:

  • Increasing popularity of stuffed and plush toys, designed with a fashionable touch, to toys' color, textile, and texture.
  • Manufacturers in Japan include different animals and characters from Kawaii culture to serve the consumer demands for squishy and cute stuffed toys. Developing cute plush and stuffed toys that reflect popular characters and indigenous Japanese animals is a running trend in the market.

Increasing Pet Ownership in Spain to Surge the Demand for Stuffed and Plush Toys

The Spain stuffed and plush toy industry is driven by a CAGR of 5.8% over the next 10 years. Top factors that are propelling the market expansion are:

  • Gen Z and millennials in Spain, with surging disposable incomes and childhood memories of plush toys, are purchasing stuffed and plush toys for various needs like stress relief, nostalgia, and comfort.
  • Growing demand for plush toys as companion and enrichment tools for pets as pet ownership is surging at a steady rate.
  • Surging awareness about mental health is raising the use of plush toys as tools for stress management and emotional support.

Thriving eCommerce Platforms to Boost Growth of Stuffed and Plush Toy Market

The China stuffed and plush toy market is accelerating at a CAGR of 9.2% through 2034. Key factors that are catapulting the products’ sales are:

  • Growing demand for manufacturers to constantly develop new designs, materials, and functionalities for these toys, making them more attractive for various age groups.
  • Surging eCommerce platforms like JD.com and Alibaba are expected to make plush toys more convenient and accessible to purchase, thus augmenting the market growth.
  • Increasing popularity of plush toys for gifts like holidays, birthdays, and graduations, thus contributing to their continuous demand.

Steps to Beat the Stiff Competition for the Stuffed and Plush Toy Merchants

Brands are attempting to cozy up to consumers with the new offerings of these plushies. For instance, MGA Entertainment, which is a creator of Bratz launched Fluffie Stuffiez, a line of ultra-fluffy and huggable toys that come in multiple shapes. Ty also upgraded its iconic Beanie Babies to be softer with the new fabric.

Key players are launching sensational videos or campaigns on social media to increase their popularity and sales. For instance, Squishmallows and Jellycat are having a moment on TikTok with their relevant hashtags amassing 6.3 billion and 873.2 million views. Such popularity is making them the top-selling toys in the market.

The success of stuffed and plush toys is being catalyzed by an important new category of toy purchasers, i.e., adults. Increasing sales from “kidults” who purchase toys motivated by childhood nostalgia. Additionally, surging cases of loneliness, anxiety, and sensory issues are catapulting the sales of soft and cuddly objects that can offer moments of comfort.

Latest Developments in the Stuffed and Plush Toy Market
  • In August 2023, PlushThis, a pioneering DTC stuffed animal brand revealed its innovative approach to making plush toy designs with the help of cutting-edge AI technology. As the first-ever brand to design stuffed animals with the power of AI, PlushThis is transforming the industry and opening new creative possibilities.
  • In June 2023, USA Today announced that Squishmallows, which are referred to as squishy and soft stuffed toys, are going to come to McDonald’s restaurants across the United States as the featured toys in Happy Meals by the end of 2023.
  • In August 2023, Cody Rhodes reported that WWE is soon going to introduce plush toys modeled after his dog Pharaoh.

Get the data you need at a Fraction of the cost

Personalize your report by choosing insights you need
and save 40%!

Key Coverage in the Stuffed and Plush Toy Industry Report

  • Adjacent Study of the Teddy Bears Market, Toy Dolls Market, Fabric Toys Market, Children’s Toys Market, and Cuddly Toys Market
  • Competitive Landscape of Plush Dolls
  • Know-how of the Remarkable Journey of Soft Toy Journey in India
  • Exhaustive List of Emerging Trends like Microwaveable Stuffed Animal Toys
  • Revenue Estimation of Soft Toys Sold Via Online Channels

Manufacturers of Stuffed and Plush Toys

  • J Sainsbury plc.
  • Hallmark Cards, Inc.
  • Nakajima USA, Inc.
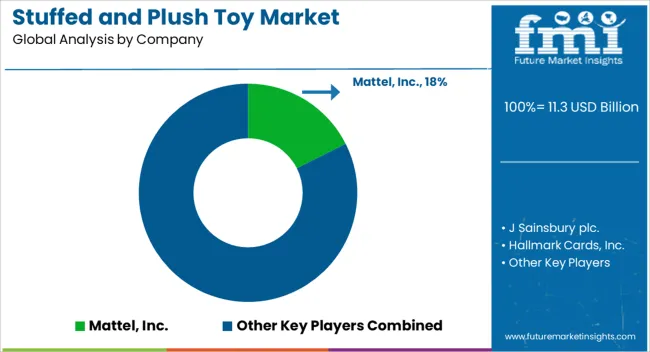
  • Mattel, Inc.
  • Bandai Co., Ltd.
  • Lego System A/S
  • Hasbro, Inc.
  • Simba-Dickie Group
  • H. Scharrer and Koch GmbH
  • Spin Master Ltd.
  • Mary Meyer Corporation
  • Hamleys Global Holdings Limited
  • Ganz, Inc.
  • GIANTmicrobes
  • Nici AG
  • Build-A-Bear Workshop, Inc.
  • Ty Inc.
  • Steiff Beteiligungsgesellschaft mbH.
  • The Boyds Collection, Ltd.
  • Suki Gifts International Ltd
  • Others

Stuffed and Plush Toy Industry by Category

By Product Type:

  • Cartoon Toys
  • Traditional Stuffed Animals
  • Battery Operated
  • Action Figures and Model Play
  • Dolls and Playsets
  • Customizable Stuffed Animals
  • Special Feature Plush toys
  • Puppets

By Material Type:

  • Synthetic
  • Natural/Organic
  • Blended Material

By Price Range:

  • Low
  • Medium
  • High

By Sales Channel:

  • Hypermarkets/Supermarkets
  • Multi-brand Stores
  • Exclusive Stores
  • Hobby and Craft Stores
  • Online Retailers
  • Other Sales Channels

By Region:

  • North America
  • Europe
  • Asia Pacific
  • Middle East and Africa
  • Latin America

Frequently Asked Questions

How Big Will be the Stuffed and Plush Toy Industry in 2024?

The market is estimated to account for US$ 10,543.9 million in 2024.

At What Rate Will the Stuffed and Plush Toy Industry Grow?

Throughout the forecast period, the stuffed and plush toy industry is projected to register a CAGR of 7.3%.

What is the Expected Value of the Stuffed and Plush Toy Industry by 2034?

By 2034, the stuffed and plush toy industry is forecast to be worth US$ 21,243.6 million.

Which Product Type is Expected to Acquire a Significant Share in the Stuffed and Plush Toy Industry?

Cartoon toys are expected to obtain a substantial value share in the stuffed and plush toy market.

Which Country is Projected to Find Significant Growth Opportunities?

India is expected to find substantial growth prospects in the future.

Who are the Leading Companies in the Stuffed and Plush Toy Industry?

Leading companies in the stuffed and plush toy industry include Nici AG, Build-A-Bear Workshop, Inc., and Ty Inc.

Table of Content
1. Executive Summary

    1.1. Global Market Outlook

    1.2. Demand-side Trends

    1.3. Supply-side Trends

    1.4. Technology Roadmap Analysis

    1.5. Analysis and Recommendations

2. Market Overview

    2.1. Market Coverage / Taxonomy

    2.2. Market Definition / Scope / Limitations

3. Market Background

    3.1. Market Dynamics

        3.1.1. Drivers

        3.1.2. Restraints

        3.1.3. Opportunity

        3.1.4. Trends

    3.2. Scenario Forecast

        3.2.1. Demand in Optimistic Scenario

        3.2.2. Demand in Likely Scenario

        3.2.3. Demand in Conservative Scenario

    3.3. Opportunity Map Analysis

    3.4. Product Life Cycle Analysis

    3.5. Supply Chain Analysis

        3.5.1. Supply Side Participants and their Roles

            3.5.1.1. Producers

            3.5.1.2. Mid-Level Participants (Traders/ Agents/ Brokers)

            3.5.1.3. Wholesalers and Distributors

        3.5.2. Value Added and Value Created at Node in the Supply Chain

        3.5.3. List of Raw Material Suppliers

        3.5.4. List of Existing and Potential Buyer’s

    3.6. Investment Feasibility Matrix

    3.7. Value Chain Analysis

        3.7.1. Profit Margin Analysis

        3.7.2. Wholesalers and Distributors

        3.7.3. Retailers

    3.8. PESTLE and Porter’s Analysis

    3.9. Regulatory Landscape

        3.9.1. By Key Regions

        3.9.2. By Key Countries

    3.10. Regional Parent Market Outlook

    3.11. Production and Consumption Statistics

    3.12. Import and Export Statistics

4. Global Market Analysis 2019 to 2023 and Forecast, 2024 to 2034

    4.1. Historical Market Size Value (US$ Million) & Volume (Units) Analysis, 2019 to 2023

    4.2. Current and Future Market Size Value (US$ Million) & Volume (Units) Projections, 2024 to 2034

        4.2.1. Y-o-Y Growth Trend Analysis

        4.2.2. Absolute $ Opportunity Analysis

5. Global Market Analysis 2019 to 2023 and Forecast 2024 to 2034, By Product Type

    5.1. Introduction / Key Findings

    5.2. Historical Market Size Value (US$ Million) & Volume (Units) Analysis By Product Type, 2019 to 2023

    5.3. Current and Future Market Size Value (US$ Million) & Volume (Units) Analysis and Forecast By Product Type, 2024 to 2034

        5.3.1. Cartoon Toys

        5.3.2. Traditional Stuffed Animals

        5.3.3. Battery Operated

        5.3.4. Action Figures & Model Play

        5.3.5. Dolls & Playsets

        5.3.6. Customizable Stuffed Animals

        5.3.7. Special Feature Plush toys

        5.3.8. Puppets

    5.4. Y-o-Y Growth Trend Analysis By Product Type, 2019 to 2023

    5.5. Absolute $ Opportunity Analysis By Product Type, 2024 to 2034

6. Global Market Analysis 2019 to 2023 and Forecast 2024 to 2034, By Material Type

    6.1. Introduction / Key Findings

    6.2. Historical Market Size Value (US$ Million) & Volume (Units) Analysis By Material Type, 2019 to 2023

    6.3. Current and Future Market Size Value (US$ Million) & Volume (Units) Analysis and Forecast By Material Type, 2024 to 2034

        6.3.1. Synthetic

        6.3.2. Natural/Organic

        6.3.3. Blended Material

    6.4. Y-o-Y Growth Trend Analysis By Material Type, 2019 to 2023

    6.5. Absolute $ Opportunity Analysis By Material Type, 2024 to 2034

7. Global Market Analysis 2019 to 2023 and Forecast 2024 to 2034, By Price Range

    7.1. Introduction / Key Findings

    7.2. Historical Market Size Value (US$ Million) & Volume (Units) Analysis By Price Range, 2019 to 2023

    7.3. Current and Future Market Size Value (US$ Million) & Volume (Units) Analysis and Forecast By Price Range, 2024 to 2034

        7.3.1. Low

        7.3.2. Medium

        7.3.3. High

    7.4. Y-o-Y Growth Trend Analysis By Price Range, 2019 to 2023

    7.5. Absolute $ Opportunity Analysis By Price Range, 2024 to 2034

8. Global Market Analysis 2019 to 2023 and Forecast 2024 to 2034, By Sales Channel

    8.1. Introduction / Key Findings

    8.2. Historical Market Size Value (US$ Million) & Volume (Units) Analysis By Sales Channel, 2019 to 2023

    8.3. Current and Future Market Size Value (US$ Million) & Volume (Units) Analysis and Forecast By Sales Channel, 2024 to 2034

        8.3.1. Hypermarkets/Supermarkets

        8.3.2. Multi-brand Stores

        8.3.3. Exclusive Stores

        8.3.4. Online Retailers

        8.3.5. Others

    8.4. Y-o-Y Growth Trend Analysis By Sales Channel, 2019 to 2023

    8.5. Absolute $ Opportunity Analysis By Sales Channel, 2024 to 2034

9. Global Market Analysis 2019 to 2023 and Forecast 2024 to 2034, By Region

    9.1. Introduction

    9.2. Historical Market Size Value (US$ Million) & Volume (Units) Analysis By Region, 2019 to 2023

    9.3. Current Market Size Value (US$ Million) & Volume (Units) Analysis and Forecast By Region, 2024 to 2034

        9.3.1. North America

        9.3.2. Latin America

        9.3.3. Western Europe

        9.3.4. Eastern Europe

        9.3.5. South Asia and Pacific

        9.3.6. East Asia

        9.3.7. Middle East and Africa

    9.4. Market Attractiveness Analysis By Region

10. North America Market Analysis 2019 to 2023 and Forecast 2024 to 2034, By Country

    10.1. Historical Market Size Value (US$ Million) & Volume (Units) Trend Analysis By Market Taxonomy, 2019 to 2023

    10.2. Market Size Value (US$ Million) & Volume (Units) Forecast By Market Taxonomy, 2024 to 2034

        10.2.1. By Country

            10.2.1.1. USA

            10.2.1.2. Canada

        10.2.2. By Product Type

        10.2.3. By Material Type

        10.2.4. By Price Range

        10.2.5. By Sales Channel

    10.3. Market Attractiveness Analysis

        10.3.1. By Country

        10.3.2. By Product Type

        10.3.3. By Material Type

        10.3.4. By Price Range

        10.3.5. By Sales Channel

    10.4. Key Takeaways

11. Latin America Market Analysis 2019 to 2023 and Forecast 2024 to 2034, By Country

    11.1. Historical Market Size Value (US$ Million) & Volume (Units) Trend Analysis By Market Taxonomy, 2019 to 2023

    11.2. Market Size Value (US$ Million) & Volume (Units) Forecast By Market Taxonomy, 2024 to 2034

        11.2.1. By Country

            11.2.1.1. Brazil

            11.2.1.2. Mexico

            11.2.1.3. Rest of Latin America

        11.2.2. By Product Type

        11.2.3. By Material Type

        11.2.4. By Price Range

        11.2.5. By Sales Channel

    11.3. Market Attractiveness Analysis

        11.3.1. By Country

        11.3.2. By Product Type

        11.3.3. By Material Type

        11.3.4. By Price Range

        11.3.5. By Sales Channel

    11.4. Key Takeaways

12. Western Europe Market Analysis 2019 to 2023 and Forecast 2024 to 2034, By Country

    12.1. Historical Market Size Value (US$ Million) & Volume (Units) Trend Analysis By Market Taxonomy, 2019 to 2023

    12.2. Market Size Value (US$ Million) & Volume (Units) Forecast By Market Taxonomy, 2024 to 2034

        12.2.1. By Country

            12.2.1.1. Germany

            12.2.1.2. UK

            12.2.1.3. France

            12.2.1.4. Spain

            12.2.1.5. Italy

            12.2.1.6. Rest of Western Europe

        12.2.2. By Product Type

        12.2.3. By Material Type

        12.2.4. By Price Range

        12.2.5. By Sales Channel

    12.3. Market Attractiveness Analysis

        12.3.1. By Country

        12.3.2. By Product Type

        12.3.3. By Material Type

        12.3.4. By Price Range

        12.3.5. By Sales Channel

    12.4. Key Takeaways

13. Eastern Europe Market Analysis 2019 to 2023 and Forecast 2024 to 2034, By Country

    13.1. Historical Market Size Value (US$ Million) & Volume (Units) Trend Analysis By Market Taxonomy, 2019 to 2023

    13.2. Market Size Value (US$ Million) & Volume (Units) Forecast By Market Taxonomy, 2024 to 2034

        13.2.1. By Country

            13.2.1.1. Poland

            13.2.1.2. Russia

            13.2.1.3. Czech Republic

            13.2.1.4. Romania

            13.2.1.5. Rest of Eastern Europe

        13.2.2. By Product Type

        13.2.3. By Material Type

        13.2.4. By Price Range

        13.2.5. By Sales Channel

    13.3. Market Attractiveness Analysis

        13.3.1. By Country

        13.3.2. By Product Type

        13.3.3. By Material Type

        13.3.4. By Price Range

        13.3.5. By Sales Channel

    13.4. Key Takeaways

14. South Asia and Pacific Market Analysis 2019 to 2023 and Forecast 2024 to 2034, By Country

    14.1. Historical Market Size Value (US$ Million) & Volume (Units) Trend Analysis By Market Taxonomy, 2019 to 2023

    14.2. Market Size Value (US$ Million) & Volume (Units) Forecast By Market Taxonomy, 2024 to 2034

        14.2.1. By Country

            14.2.1.1. India

            14.2.1.2. Bangladesh

            14.2.1.3. Australia

            14.2.1.4. New Zealand

            14.2.1.5. Rest of South Asia and Pacific

        14.2.2. By Product Type

        14.2.3. By Material Type

        14.2.4. By Price Range

        14.2.5. By Sales Channel

    14.3. Market Attractiveness Analysis

        14.3.1. By Country

        14.3.2. By Product Type

        14.3.3. By Material Type

        14.3.4. By Price Range

        14.3.5. By Sales Channel

    14.4. Key Takeaways

15. East Asia Market Analysis 2019 to 2023 and Forecast 2024 to 2034, By Country

    15.1. Historical Market Size Value (US$ Million) & Volume (Units) Trend Analysis By Market Taxonomy, 2019 to 2023

    15.2. Market Size Value (US$ Million) & Volume (Units) Forecast By Market Taxonomy, 2024 to 2034

        15.2.1. By Country

            15.2.1.1. China

            15.2.1.2. Japan

            15.2.1.3. South Korea

        15.2.2. By Product Type

        15.2.3. By Material Type

        15.2.4. By Price Range

        15.2.5. By Sales Channel

    15.3. Market Attractiveness Analysis

        15.3.1. By Country

        15.3.2. By Product Type

        15.3.3. By Material Type

        15.3.4. By Price Range

        15.3.5. By Sales Channel

    15.4. Key Takeaways

16. Middle East and Africa Market Analysis 2019 to 2023 and Forecast 2024 to 2034, By Country

    16.1. Historical Market Size Value (US$ Million) & Volume (Units) Trend Analysis By Market Taxonomy, 2019 to 2023

    16.2. Market Size Value (US$ Million) & Volume (Units) Forecast By Market Taxonomy, 2024 to 2034

        16.2.1. By Country

            16.2.1.1. GCC Countries

            16.2.1.2. South Africa

            16.2.1.3. Israel

            16.2.1.4. Rest of MEA

        16.2.2. By Product Type

        16.2.3. By Material Type

        16.2.4. By Price Range

        16.2.5. By Sales Channel

    16.3. Market Attractiveness Analysis

        16.3.1. By Country

        16.3.2. By Product Type

        16.3.3. By Material Type

        16.3.4. By Price Range

        16.3.5. By Sales Channel

    16.4. Key Takeaways

17. Key Countries Market Analysis

    17.1. USA

        17.1.1. Pricing Analysis

        17.1.2. Market Share Analysis, 2023

            17.1.2.1. By Product Type

            17.1.2.2. By Material Type

            17.1.2.3. By Price Range

            17.1.2.4. By Sales Channel

    17.2. Canada

        17.2.1. Pricing Analysis

        17.2.2. Market Share Analysis, 2023

            17.2.2.1. By Product Type

            17.2.2.2. By Material Type

            17.2.2.3. By Price Range

            17.2.2.4. By Sales Channel

    17.3. Brazil

        17.3.1. Pricing Analysis

        17.3.2. Market Share Analysis, 2023

            17.3.2.1. By Product Type

            17.3.2.2. By Material Type

            17.3.2.3. By Price Range

            17.3.2.4. By Sales Channel

    17.4. Mexico

        17.4.1. Pricing Analysis

        17.4.2. Market Share Analysis, 2023

            17.4.2.1. By Product Type

            17.4.2.2. By Material Type

            17.4.2.3. By Price Range

            17.4.2.4. By Sales Channel

    17.5. Germany

        17.5.1. Pricing Analysis

        17.5.2. Market Share Analysis, 2023

            17.5.2.1. By Product Type

            17.5.2.2. By Material Type

            17.5.2.3. By Price Range

            17.5.2.4. By Sales Channel

    17.6. UK

        17.6.1. Pricing Analysis

        17.6.2. Market Share Analysis, 2023

            17.6.2.1. By Product Type

            17.6.2.2. By Material Type

            17.6.2.3. By Price Range

            17.6.2.4. By Sales Channel

    17.7. France

        17.7.1. Pricing Analysis

        17.7.2. Market Share Analysis, 2023

            17.7.2.1. By Product Type

            17.7.2.2. By Material Type

            17.7.2.3. By Price Range

            17.7.2.4. By Sales Channel

    17.8. Spain

        17.8.1. Pricing Analysis

        17.8.2. Market Share Analysis, 2023

            17.8.2.1. By Product Type

            17.8.2.2. By Material Type

            17.8.2.3. By Price Range

            17.8.2.4. By Sales Channel

    17.9. Italy

        17.9.1. Pricing Analysis

        17.9.2. Market Share Analysis, 2023

            17.9.2.1. By Product Type

            17.9.2.2. By Material Type

            17.9.2.3. By Price Range

            17.9.2.4. By Sales Channel

    17.10. Poland

        17.10.1. Pricing Analysis

        17.10.2. Market Share Analysis, 2023

            17.10.2.1. By Product Type

            17.10.2.2. By Material Type

            17.10.2.3. By Price Range

            17.10.2.4. By Sales Channel

    17.11. Russia

        17.11.1. Pricing Analysis

        17.11.2. Market Share Analysis, 2023

            17.11.2.1. By Product Type

            17.11.2.2. By Material Type

            17.11.2.3. By Price Range

            17.11.2.4. By Sales Channel

    17.12. Czech Republic

        17.12.1. Pricing Analysis

        17.12.2. Market Share Analysis, 2023

            17.12.2.1. By Product Type

            17.12.2.2. By Material Type

            17.12.2.3. By Price Range

            17.12.2.4. By Sales Channel

    17.13. Romania

        17.13.1. Pricing Analysis

        17.13.2. Market Share Analysis, 2023

            17.13.2.1. By Product Type

            17.13.2.2. By Material Type

            17.13.2.3. By Price Range

            17.13.2.4. By Sales Channel

    17.14. India

        17.14.1. Pricing Analysis

        17.14.2. Market Share Analysis, 2023

            17.14.2.1. By Product Type

            17.14.2.2. By Material Type

            17.14.2.3. By Price Range

            17.14.2.4. By Sales Channel

    17.15. Bangladesh

        17.15.1. Pricing Analysis

        17.15.2. Market Share Analysis, 2023

            17.15.2.1. By Product Type

            17.15.2.2. By Material Type

            17.15.2.3. By Price Range

            17.15.2.4. By Sales Channel

    17.16. Australia

        17.16.1. Pricing Analysis

        17.16.2. Market Share Analysis, 2023

            17.16.2.1. By Product Type

            17.16.2.2. By Material Type

            17.16.2.3. By Price Range

            17.16.2.4. By Sales Channel

    17.17. New Zealand

        17.17.1. Pricing Analysis

        17.17.2. Market Share Analysis, 2023

            17.17.2.1. By Product Type

            17.17.2.2. By Material Type

            17.17.2.3. By Price Range

            17.17.2.4. By Sales Channel

    17.18. China

        17.18.1. Pricing Analysis

        17.18.2. Market Share Analysis, 2023

            17.18.2.1. By Product Type

            17.18.2.2. By Material Type

            17.18.2.3. By Price Range

            17.18.2.4. By Sales Channel

    17.19. Japan

        17.19.1. Pricing Analysis

        17.19.2. Market Share Analysis, 2023

            17.19.2.1. By Product Type

            17.19.2.2. By Material Type

            17.19.2.3. By Price Range

            17.19.2.4. By Sales Channel

    17.20. South Korea

        17.20.1. Pricing Analysis

        17.20.2. Market Share Analysis, 2023

            17.20.2.1. By Product Type

            17.20.2.2. By Material Type

            17.20.2.3. By Price Range

            17.20.2.4. By Sales Channel

    17.21. GCC Countries

        17.21.1. Pricing Analysis

        17.21.2. Market Share Analysis, 2023

            17.21.2.1. By Product Type

            17.21.2.2. By Material Type

            17.21.2.3. By Price Range

            17.21.2.4. By Sales Channel

    17.22. South Africa

        17.22.1. Pricing Analysis

        17.22.2. Market Share Analysis, 2023

            17.22.2.1. By Product Type

            17.22.2.2. By Material Type

            17.22.2.3. By Price Range

            17.22.2.4. By Sales Channel

    17.23. Israel

        17.23.1. Pricing Analysis

        17.23.2. Market Share Analysis, 2023

            17.23.2.1. By Product Type

            17.23.2.2. By Material Type

            17.23.2.3. By Price Range

            17.23.2.4. By Sales Channel

18. Market Structure Analysis

    18.1. Competition Dashboard

    18.2. Competition Benchmarking

    18.3. Market Share Analysis of Top Players

        18.3.1. By Regional

        18.3.2. By Product Type

        18.3.3. By Material Type

        18.3.4. By Price Range

        18.3.5. By Sales Channel

19. Competition Analysis

    19.1. Competition Deep Dive

        19.1.1. Hallmark Cards, Inc.

            19.1.1.1. Overview

            19.1.1.2. Product Portfolio

            19.1.1.3. Profitability by Market Segments

            19.1.1.4. Sales Footprint

            19.1.1.5. Strategy Overview

                19.1.1.5.1. Marketing Strategy

                19.1.1.5.2. Product Strategy

                19.1.1.5.3. Channel Strategy

        19.1.2. Nakajima USA, Inc.

            19.1.2.1. Overview

            19.1.2.2. Product Portfolio

            19.1.2.3. Profitability by Market Segments

            19.1.2.4. Sales Footprint

            19.1.2.5. Strategy Overview

                19.1.2.5.1. Marketing Strategy

                19.1.2.5.2. Product Strategy

                19.1.2.5.3. Channel Strategy

        19.1.3. Mattel, Inc.

            19.1.3.1. Overview

            19.1.3.2. Product Portfolio

            19.1.3.3. Profitability by Market Segments

            19.1.3.4. Sales Footprint

            19.1.3.5. Strategy Overview

                19.1.3.5.1. Marketing Strategy

                19.1.3.5.2. Product Strategy

                19.1.3.5.3. Channel Strategy

        19.1.4. Bandai Co., Ltd.

            19.1.4.1. Overview

            19.1.4.2. Product Portfolio

            19.1.4.3. Profitability by Market Segments

            19.1.4.4. Sales Footprint

            19.1.4.5. Strategy Overview

                19.1.4.5.1. Marketing Strategy

                19.1.4.5.2. Product Strategy

                19.1.4.5.3. Channel Strategy

        19.1.5. Lego System A/S

            19.1.5.1. Overview

            19.1.5.2. Product Portfolio

            19.1.5.3. Profitability by Market Segments

            19.1.5.4. Sales Footprint

            19.1.5.5. Strategy Overview

                19.1.5.5.1. Marketing Strategy

                19.1.5.5.2. Product Strategy

                19.1.5.5.3. Channel Strategy

        19.1.6. Hasbro, Inc.

            19.1.6.1. Overview

            19.1.6.2. Product Portfolio

            19.1.6.3. Profitability by Market Segments

            19.1.6.4. Sales Footprint

            19.1.6.5. Strategy Overview

                19.1.6.5.1. Marketing Strategy

                19.1.6.5.2. Product Strategy

                19.1.6.5.3. Channel Strategy

        19.1.7. Simba-Dickie Group

            19.1.7.1. Overview

            19.1.7.2. Product Portfolio

            19.1.7.3. Profitability by Market Segments

            19.1.7.4. Sales Footprint

            19.1.7.5. Strategy Overview

                19.1.7.5.1. Marketing Strategy

                19.1.7.5.2. Product Strategy

                19.1.7.5.3. Channel Strategy

        19.1.8. H. Scharrer & Koch GmbH

            19.1.8.1. Overview

            19.1.8.2. Product Portfolio

            19.1.8.3. Profitability by Market Segments

            19.1.8.4. Sales Footprint

            19.1.8.5. Strategy Overview

                19.1.8.5.1. Marketing Strategy

                19.1.8.5.2. Product Strategy

                19.1.8.5.3. Channel Strategy

        19.1.9. Spin Master Ltd.

            19.1.9.1. Overview

            19.1.9.2. Product Portfolio

            19.1.9.3. Profitability by Market Segments

            19.1.9.4. Sales Footprint

            19.1.9.5. Strategy Overview

                19.1.9.5.1. Marketing Strategy

                19.1.9.5.2. Product Strategy

                19.1.9.5.3. Channel Strategy

        19.1.10. Mary Meyer Corporation

            19.1.10.1. Overview

            19.1.10.2. Product Portfolio

            19.1.10.3. Profitability by Market Segments

            19.1.10.4. Sales Footprint

            19.1.10.5. Strategy Overviewa

                19.1.10.5.1. Marketing Strategy

                19.1.10.5.2. Product Strategy

                19.1.10.5.3. Channel Strategy

        19.1.11. Hamleys Global Holdings Limited.

            19.1.11.1. Overview

            19.1.11.2. Product Portfolio

            19.1.11.3. Profitability by Market Segments

            19.1.11.4. Sales Footprint

            19.1.11.5. Strategy Overview

                19.1.11.5.1. Marketing Strategy

                19.1.11.5.2. Product Strategy

                19.1.11.5.3. Channel Strategy

20. Assumptions & Acronyms Used

21. Research Methodology
Recommendations

Consumer Product

Traditional Toys and Games Market

November 2021

REP-GB-4951

June 2023

442 pages

Consumer Product

Pet Toys Market

March 2021

REP-GB-12550

February 2023

321 pages

Explore Consumer Product Insights

View Reports
Future Market Insights

Stuffed and Plush Toy Market