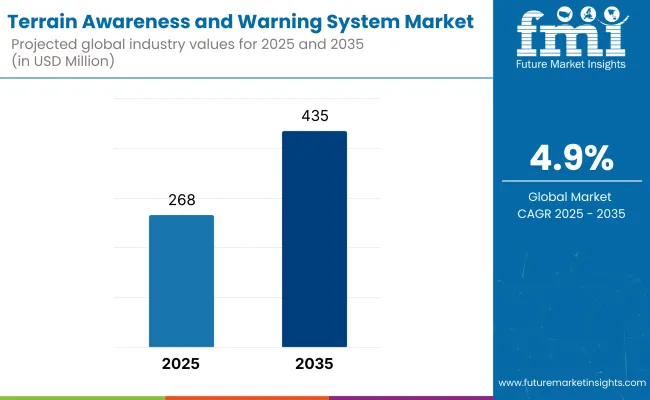
The terrain awareness and warning system market is expected to maintain a CAGR of 4.9% and reach USD 435 million in revenue by 2035. In 2025, the Terrain Awareness and Warning System (TAWS) industry experienced steady growth, driven by increased regulatory enforcement and heightened safety awareness.

Aviation authorities like the FAA and EASA mandate TAWS installation in commercial aircraft. Smaller regional carriers and cargo planes are a key focus. Additionally, emerging economies in Asia-Pacific and Latin America saw greater adoption of TAWS due to the expansion of low-cost carriers and the growing demand for air travel.
Technological advancements played a key role in 2025, with manufacturers integrating enhanced sensors, AI-powered analytics, and real-time data processing into TAWS. These innovations improved predictive accuracy and reduced false alerts. Partnerships between TAWS providers and avionics companies also expanded, leading to more comprehensive and integrated safety solutions.
Growth will be fueled by the rising adoption of business jets and general aviation aircraft equipped with advanced safety features. Furthermore, investments in next-generation avionics, including cloud-based monitoring systems and autonomous aircraft technologies, will provide new opportunities. The increasing focus on enhancing pilot situational awareness and preventing Controlled Flight into Terrain (CFIT) incidents will continue to be a key driver for industry expansion.
(Surveyed Q4 2024, n=450 stakeholder participants evenly distributed across manufacturers, airlines, aviation regulators, and technology providers in the USA, Western Europe, Japan, and South Korea)
Regional Variance:
High Variance:
Convergent and Divergent Perspectives on ROI:
76% of USA stakeholders believed in AI-powered TAWS as a worthwhile investment, while only 32% in Japan preferred traditional systems.
Consensus:
Polycarbonate Enclosures: Selected by 60% globally for their durability and resistance to harsh environments.
Variance:
Shared Challenges:
83% cited semiconductor shortages and rising component costs as a major concern.
Regional Differences:
Manufacturers:
Distributors:
End-Users (Airlines and Operators):
Alignment:
74% of global manufacturers plan to invest in AI-enhanced TAWS for predictive analysis.
Divergence:
USA:
68% stated FAA regulations were significant drivers for adoption.
Western Europe:
85% saw EASA regulations as a major factor influencing premium product sales.
Japan/South Korea:
Only 38% felt regulations significantly impacted purchasing decisions due to less stringent enforcement.
High Consensus: Safety compliance, accident prevention, and cost management are global priorities.
Key Variances:
Strategic Insight: Companies must adopt a region-specific approach to cater to varying demands. Advanced AI and eco-friendly solutions can drive industry growth in the USA and Europe, while budget-conscious and modular systems can succeed in Asian industries.
| Country | Government Regulations and Certifications |
|---|---|
| USA | FAA mandates TAWS for all turbine-powered and large aircraft. Compliance with FAR Part 91.223. |
| UK | CAA requires TAWS under EASA regulations. Compliance with UK CAA Safety Standards. |
| France | DGAC mandates EASA-certified TAWS for commercial aircraft. Aviation law enforcement is strict. |
| Germany | EASA regulations apply. Additional local aviation safety assessments for private operators. |
| Italy | ENAC follows EASA TAWS mandates. Strict oversight on aviation safety certifications. |
| South Korea | MOLIT mandates TAWS installation on commercial aircraft. Adherence to ICAO standards. |
| Japan | JCAB requires TAWS for passenger-carrying aircraft. Compliance with JAR-OPS 1 standards. |
| China | CAAC mandates TAWS for all civil aircraft. Certification required under CCAR Part 91. |
| Australia-NZ | CASA mandates TAWS for turbine-powered and pressurized aircraft. NZ CAA follows similar rules. |
| India | DGCA mandates TAWS for commercial aircraft. Compliance with CAR Section 8, Series ‘C’, Part I. |

| 2020 to 2024 | 2025 to 2035 |
|---|---|
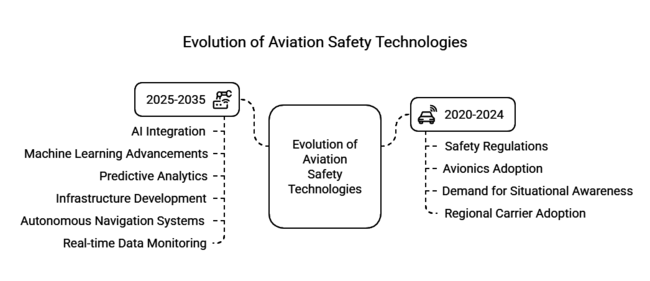
| Safety regulations, increased avionics adoption, and demand for enhanced situational awareness systems. | AI integration, machine learning advancements, and predictive analytics for proactive safety management. |
| Pandemic-related supply chain disruptions and reduced aircraft production. | High implementation costs, data security concerns, and the need for large-scale data management. |
| Regional carriers and private charters adopting terrain awareness systems. | Infrastructure development in emerging economies and increased adoption by commercial aviation sectors. |
| Basic situational awareness systems for accident prevention. | Autonomous navigation systems, real-time data monitoring, and predictive hazard detection tools. |
| Compliance-driven growth with regulatory bodies mandating safety systems. | Stricter global mandates for the use of AI-powered safety solutions and data reporting requirements. |
| Focus on safety in aviation and improved pilot situational awareness. | Increased preference for intelligent systems that offer real-time decision-making support. |
| Moderate investments in R&D due to economic uncertainty. | Significant capital influx into AI-powered aviation safety technologies and digital infrastructure. |
Class A is still the most common system type in this industry. For commercial airlines and large passenger planes, Class A systems are required, as other types are unsuitable for larger commercial aircraft, making them dominant due to regulatory requirements from aviation authorities like the FAA and EASA.
Suitable for the task, these systems provide significant improvements to terrain mapping, real-time alerts, and situational awareness for the pilot, thus mitigating the risk of controlled flight into terrain (CFIT) accidents.
Designed with the operational requirements of smaller operators in mind, Class B systems are capable of delivering similar types of safety capabilities and therefore hold strong market presence.
The Turboprop engine segment is anticipated to witness the fastest growth in the TAWS market during the forecast period. The mainstay of regional and short-haul routes, turboprop planes are popular in developing markets with little in the way of aviation infrastructure. With the increase in air travel across these areas, the need for low-cost, reliable and safe aircraft equipped with next-generation TAWS technology increases accordingly.
Moreover, the development of lightweight TAWS systems for turboprop engines has made such solutions more accessible, driving segment's growth. Conversely, the jet engine segment remains on an upward trajectory, supported by the rising deliveries of commercial jets and private business aircraft that need advanced safety systems such as TAWS to meet international aviation safety regulations.
The on-going growth of global airline fleets and the implementation of stringent safety regulations make commercial aviation the largest application segment in the TAWS industry. TAWS is widely used to increase safety and reduce operational risk by eliminating such accidents from an airline's operation. The business aviation segment is also getting press, as private jet operators tout advanced safety features for their planes.
Moreover, significant growth is experienced in the military aviation segment, driven by increased military budgets and the expanding need for military transport and surveillance aircraft. High altitude low opening (HALO) operations for military aircraft require stable TAWS in rugged terrain for pilot safety, such features will add to the expansion of this application segment.

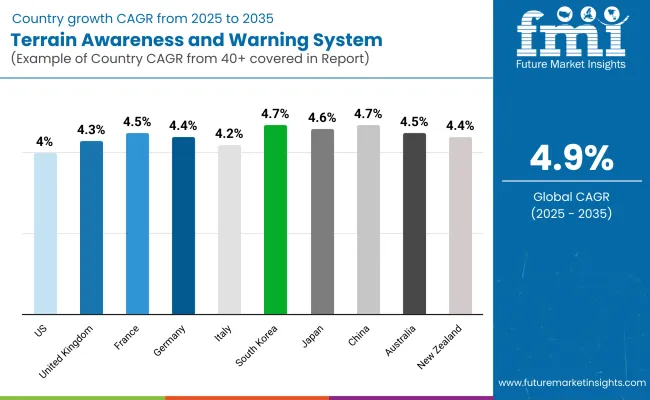
The USA is anticipated to expand at a rapidly growing CAGR of 4.0%, largely owing to FAA regulations. Its huge fleet of commercial and business aircraft is perpetually modernized to be compliant with changing safety requirements. TAWS adoption is accelerated by the increase of air cargo services and regional aviation.
Increasing demand for predictive safety measures and technological advances in avionics ensure compliance with state-of-the-art certifications and improved operational safety. Industry growth is also facilitated by government support and the presence of major avionics manufacturers.
United Kingdom is estimated to expand at a CAGR of 4.3%, also benefits from a compulsion to adhere to some EASA norms. The growing need for regional and business aviation, complemented by infrastructure investment in airports, will drive TAWS adoption. The defense industry also emphasizes safety systems in military aircraft that extract more data.
Technological progress and collaboration among aerospace companies promote innovation. Furthermore, the UK's dedication to improving aviation safety standards and the presence of major aerospace companies underpin industry growth.
France will observe a CAGR of 4.5% fueled by its robust aerospace manufacturing sector bolstered by Airbus. The industry is bolstered by ongoing investments in aviation R&D, and stringent EASA safety requirements. Growing international air traffic drives demand for innovative safety solutions, propelling TAWS uptake.
Government programs aimed at enhancing aviation safety, along with technological advancements in avionics facilities, further drive industry growth. The growth of the industry's potential is also due to collaborations with global aviation players and the country's focus to improve operational safety.
Germany is forecasted to grow at a CAGR of 4.4%, led by its advanced aviation sector and focus on technological innovation. Key aircraft manufacturers and commercial airlines drive consistent demand for TAWS. Government regulations mandate advanced safety systems, while airline investments in cutting-edge avionics further stimulate growth.
Germany’s emphasis on operational efficiency and enhanced aviation safety standards supports industry expansion. Additionally, partnerships with leading technology providers and on-going safety enhancement initiatives further contribute to industry growth.
Italy is projected to grow at a CAGR of 4.2%, driven by rising demand for private and business aviation. Growth in regional airline operations boosts the need for advanced safety systems. Compliance with EASA safety standards ensures increased TAWS adoption. Continuous investments in aviation infrastructure and technological advancements enhance industry growth.
The expanding domestic air travel sector and government support for aviation safety initiatives further promote industry expansion. Collaborations with global avionics manufacturers also contribute to the development of advanced safety solutions.
South Korea is expected to grow at a CAGR of 4.7%, supported by its expanding aviation sector. Government investments in safety infrastructure for low-cost carriers drive TAWS adoption. Technological advancements and the presence of major aerospace companies accelerate growth.
Increasing passenger safety awareness and strict compliance with international safety standards further strengthen the industry. South Korea's focus on upgrading aircraft safety systems and promoting innovation in avionics supports continuous industry expansion.
Japan is anticipated to grow at a CAGR of 4.6%, backed by strong domestic and international air traffic. The Civil Aviation Bureau of Japan mandates the use of advanced safety systems, increasing TAWS adoption. Leading avionics manufacturers and a commitment to aviation technology innovation further drive industry growth.
On-going investments in airport infrastructure and a focus on passenger safety contribute to industry expansion. Japan’s advancements in avionics and collaborative efforts between aviation companies ensure continuous development in safety technologies.
China is expected to grow at a CAGR of 4.7%, driven by significant investments in airport infrastructure and fleet expansion. The CAAC enforces strict safety regulations, encouraging airlines to adopt TAWS. Rapid growth in domestic and international air travel boosts industry demand. Government-led aviation advancements and continuous technological innovation further accelerate growth.
Increasing safety awareness, partnerships with global avionics providers, and a focus on enhancing operational safety standards contribute to the expansion of the TAWS industry in China.
Australia is forecasted to grow at a CAGR of 4.5%, driven by the expansion of regional airline networks and increased air travel. CASA mandates the integration of TAWS in commercial and private aircraft. The country’s vast geographic expanse and reliance on air transport accelerate adoption.
Government initiatives to enhance aviation safety standards and rising investments in air infrastructure further support industry growth. Additionally, technological advancements and a growing focus on operational safety contribute to the widespread use of TAWS.
New Zealand is projected to grow at a CAGR of 4.4%, supported by increased air passenger traffic and strict aviation safety regulations. Regional carriers adopt TAWS to comply with safety standards. Continuous investments in aviation infrastructure and technological advancements foster industry growth.
Enhanced safety measures, government regulations, and a growing emphasis on air travel security further strengthen the industry. The country's emphasis on operational safety, along with collaborations with global avionics manufacturers, fuels further industry growth.
In 2024 only, TAWS industry achieved new records, with almost all companies introducing new technologies for a secure take-off and landing. Dominant players concentrated on the incorporation of artificial intelligence and predictive analytics to offer more precise and timely alerts to pilots. These enhancements reduced the risk of controlled flight into terrain (CFIT) events, a major concern in both commercial and military aviation.
One way the major players also increased their presence in the industry was through the formation of strategic alliances with airlines and aviation authorities. In collaboration for fleet modernization programs, companies were able to sell their newest TAWS solutions on a wider array of aircraft. Improvements in sensor technology and terrain mapping systems also increased the reliability and accuracy of warnings.
In the defense sector, governments intensified their investments in TAWS to enhance military aviation safety. Upgraded combat helicopters and transport planes got systems with advanced capabilities of detecting obstacles. Such spikes in demand, especially in regions such as Asia-Pacific, played a role in the industry’s expansion.
Additionally, companies sought to capitalize on emerging industries by providing economical and readily retrofittable TAWS solutions. That made this method of access - larger, well-heeled peacekeepers - open to smaller airlines and even regional operators without huge up-front costs. Industry leaders are focusing on product portfolio expansion, and partner-assisted rollouts to stake a huge market share in the potential but competitive TAWS industry.
Universal Avionics Systems Corporation

Estimated Share: ~15-20%
A leading provider of advanced avionics systems, Universal Avionics is known for its innovative TAWS solutions, particularly for business and commercial aviation. Its strong R&D and global customer base contribute to its significant industry presence.
Honeywell International Inc.
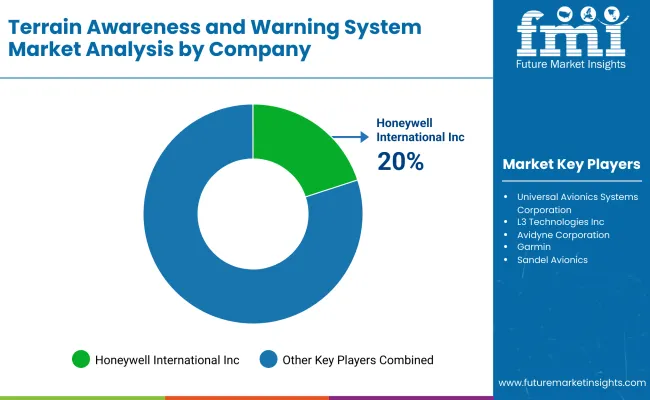
Estimated Share: ~20-25%
Honeywell is a dominant player in the avionics industry, offering integrated TAWS solutions for both civil and military aircraft. Its extensive product portfolio and global reach make it a key competitor in the industry.
L3 Technologies Inc.
Estimated Share: ~10-15%
L3 Technologies specializes in advanced avionics and communication systems, including TAWS. Its focus on military and commercial applications gives it a solid foothold in the industry.
Avidyne Corporation
Estimated Share: ~5-10%
Avidyne is a notable player in the general aviation sector, providing cost-effective and reliable TAWS solutions. Its focus on smaller aircraft and retrofitting older systems contributes to its niche industry share.
Garmin
Estimated Share: ~15-20%
Garmin is a well-known name in the aviation industry, offering user-friendly and innovative TAWS solutions. Its strong presence in general aviation and its reputation for quality give it a competitive edge.
Collins Aerospace
Estimated Share: ~20-25%
Collins Aerospace, a subsidiary of Raytheon Technologies, is a major player in the avionics industry. Its comprehensive TAWS solutions for both commercial and military aircraft make it one of the top competitors.
Sandel Avionics
Estimated Share: ~5-10%
Sandel Avionics specializes in terrain awareness and navigation systems, particularly for helicopters and smaller aircraft. Its focus on precision and reliability gives it a niche industry share.
Aspen Avionics
Estimated Share: ~5-10%
Aspen Avionics is known for its advanced avionics displays and systems, including TAWS. Its focus on general aviation and cost-effective solutions contributes to its industry presence.
Genesys Aerosystems
Estimated Share: ~5-10%
Genesys Aerosystems provides integrated avionics solutions, including TAWS, for both fixed-wing and rotary-wing aircraft. Its focus on innovation and customer support helps maintain its industry share.
Mid-Continent Instruments and Avionics
Estimated Share: ~5-10%
Mid-Continent Instruments specializes in avionics for general aviation and retrofitting older aircraft. Its TAWS solutions are known for their reliability and affordability, contributing to its niche market share.
This industry belongs to the aerospace and defense sector, specifically within the aviation safety systems category. The macroeconomic environment influencing this industry is shaped by rising air traffic, regulatory mandates for enhanced flight safety, and increasing investments in modernizing aircraft fleets.
Developed regions like North America and Europe lead in adoption, driven by stringent safety regulations from authorities like the FAA and EASA. Emerging economies in Asia-Pacific are also witnessing growth, fueled by expanding air travel and regional airline expansion. Additionally, military aviation modernization programs contribute to demand.
Supply chain disruptions and geopolitical tensions may pose challenges, while technological advancements in avionics and AI-powered predictive systems create opportunities. Sustainability efforts promoting fuel-efficient aviation also indirectly influence innovation in safety systems. Overall, the TAWS industry is expected to grow steadily, underpinned by global air traffic recovery, safety compliance, and advancements in flight management technology.
Growth opportunities in this industry are primarily driven by regional expansion, technological advancements, and aftermarket services. Stakeholders can capitalize on the rising demand in emerging industries like Asia-Pacific and the Middle East, where growing air travel and aviation infrastructure investments are increasing the need for advanced safety systems.
Investing in AI-powered predictive analytics, improved sensor technologies, and real-time data integration will enhance system accuracy and reliability, reducing false alarms. Additionally, focusing on aftermarket opportunities by offering retrofit solutions for older fleets can generate significant revenue, especially with customizable TAWS systems. Forming strategic alliances with aircraft manufacturers, maintenance providers, and system integrators can also accelerate industry presence.
Partnerships for developing region-specific solutions based on geographic challenges will further enhance competitiveness. Lastly, engaging closely with aviation regulators to ensure compliance and provide certification support to operators can strengthen credibility and foster long-term customer relationships.
The industry is segmented into Class A, Class B, and Class C.
It is divided into turbine powered systems and piston powered systems.
It is segmented into commercial aircrafts, civil airlines, chartered planes, civilian/private rotorcraft, military & defense aircraft, fighter planes, carrier planes, rotorcraft, other aircraft
The industry is divided into North America, Latin America, Europe, Asia Pacific, Middle East and Africa.
TAWS is an aircraft safety system that provides real-time alerts to pilots about potential terrain collisions, enhancing flight safety.
Key companies include Honeywell International Inc., Universal Avionics Systems Corporation, L3 Technologies Inc., Garmin Ltd., and Collins Aerospace.
Increasing air traffic, regulatory mandates for enhanced safety, and technological advancements are major drivers.
Yes, North America and Europe lead due to strict regulations, while Asia-Pacific is experiencing growth with expanding airline operations.
AI-powered predictive analytics, advanced sensors, and real-time data integration are enhancing accuracy and reducing false alarms.


Full Research Suite comprises of:
Market outlook & trends analysis
Interviews & case studies
Strategic recommendations
Vendor profiles & capabilities analysis
5-year forecasts
8 regions and 60+ country-level data splits
Market segment data splits
12 months of continuous data updates
DELIVERED AS:
PDF EXCEL ONLINE
All-Terrain Vehicle Market
Utility Terrain Vehicles Market Size and Share Forecast Outlook 2025 to 2035
Electric All Terrain Vehicle Market Size and Share Forecast Outlook 2025 to 2035
Off-Road All Terrain E-Scooter Market Growth - Trends & Forecast 2024 to 2034
Compact Track and Multi-Terrain Loader Market Size and Share Forecast Outlook 2025 to 2035
Middle East and Africa Rough Terrain Cranes Market Growth - Trends & Forecast 2025 to 2035
Space Situational Awareness Market Size and Share Forecast Outlook 2025 to 2035
System-On-Package Market Size and Share Forecast Outlook 2025 to 2035
Systems Administration Management Tools Market Size and Share Forecast Outlook 2025 to 2035
Systemic Sclerosis Treatment Market - Trends & Forecast 2025 to 2035
System on Module Market Growth – Trends & Forecast 2025 to 2035
SLE Drugs Market Insights - Growth & Forecast 2025 to 2035
Systemic Mastocytosis Treatment Market
Systemic Infection Treatment Market
5G System Integration Market Insights - Demand & Growth Forecast 2025 to 2035
VRF Systems Market Growth - Trends & Forecast 2025 to 2035
Rail System Dryer Market Size and Share Forecast Outlook 2025 to 2035
HVAC System Analyzer Market Size and Share Forecast Outlook 2025 to 2035
DWDM System Market Analysis by Services, Product, Vertical, and Region – Growth, Trends, and Forecast from 2025 to 2035
Brake System Market Size and Share Forecast Outlook 2025 to 2035

Thank you!
You will receive an email from our Business Development Manager. Please be sure to check your SPAM/JUNK folder too.
Chat With
MaRIA