The tinnitus management market is estimated to be valued at USD 3 billion in 2025 and is projected to reach USD 4 billion by 2035, registering a compound annual growth rate (CAGR) of 4% over the forecast period. The market is expected to add an absolute dollar opportunity of USD 1.0 billion during this period. This represents a 1.33 times growth at a CAGR of 4%. The market evolution is expected to be shaped by rising awareness about hearing disorders, advancements in sound therapy devices, and rising prevalence of tinnitus among aging populations.
By 2030, the market is projected to reach USD 3.3 billion, generating an incremental gain of USD 300 million in the first half of the decade. The remaining USD 620 million is expected during the second half, supported by the increasing availability of innovative neuromodulation therapies, integration of digital hearing aids with tinnitus management features, and improved access to treatment in emerging economies.
Companies such as Pfizer Inc., Sanofi, Teva Pharmaceutical, GlaxoSmithKline, Eli Lilly and Co., Bayer AG, Takeda Pharmaceutical Company Ltd., Boehringer Ingelheim, Merck & Co., Abbvie, Starkey Laboratories Inc., Oticon Inc., Neuromod Devices Ltd., Neuromonics Inc., Puretone Ltd., Signia, and GN Hearing A/S are strengthening their presence through R&D, regulatory approvals, and partnerships. Personalized therapy approaches, patient-centric solutions, and integration of AI-driven digital health tools are expected to be major trends driving future growth.
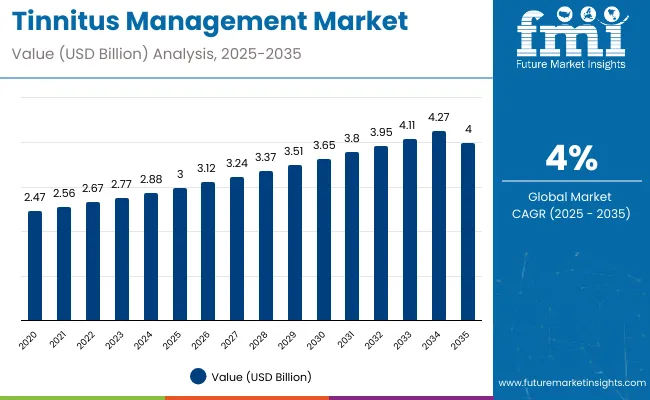
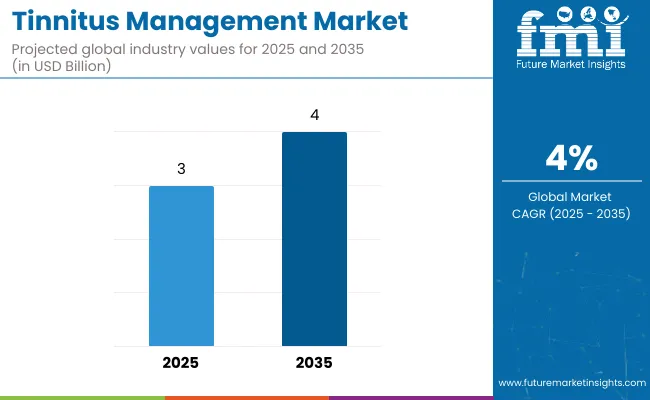
| Metric | Value |
|---|---|
| Estimated Size (2025E) | USD 3 billion |
| Projected Value (2035F) | USD 4 billion |
| CAGR (2025 to 2035) | 4% |
The market holds a strong position across its parent industries and reflects rising adoption in healthcare, pharmaceuticals, and consumer health segments. Within healthcare, tinnitus devices account for nearly 90% of the market, driven by increasing demand for hearing aids, sound therapy systems, and neuromodulation solutions designed to improve quality of life. In pharmaceuticals, drug-based approaches represent about 8% of the market, supported by research into off-label treatments, anti-anxiety medications, and investigational therapies targeting underlying neurological mechanisms. Consumer health and wellness contributes an estimated 2%, primarily through mobile applications, sound generators, and wellness-focused interventions for stress-induced tinnitus.
The market is being driven by expanding prevalence of tinnitus globally, with increasing cases among aging populations, individuals exposed to occupational noise, and those with underlying auditory conditions. Rising demand for advanced digital hearing aids with integrated tinnitus relief, alongside innovations in neuromodulation and sound therapy, is fueling growth. Developments include miniaturized wearable devices, AI-driven sound personalization, and smartphone-linked tinnitus management platforms, enhancing accessibility and patient engagement.
Significant adoption is observed in North America and Europe, while Asia-Pacific is emerging as a fast-growing hub with rising healthcare investments and expanding hearing care infrastructure. Trends indicate a gradual shift toward personalized treatment protocols, digital health integration, and combined therapy approaches, though devices remain dominant due to proven efficacy and broad clinical acceptance.
Tinnitus management solutions’ unique ability to provide symptom relief, improve quality of life, and enhance hearing experiences across diverse patient groups is driving their adoption. Their versatile applications make them indispensable in healthcare, pharmaceuticals, and consumer health, where effective treatment, patient compliance, and accessibility are critical.
Rising prevalence of tinnitus in aging populations, noise-exposed workers, and individuals with hearing loss is a key growth driver. Growth is further supported by increasing use of advanced hearing aids, sound therapy devices, and neuromodulation systems, which provide convenience, symptom reduction, and personalized therapy. Expanding research into drug-based therapies and mobile app-driven digital health tools is also adding momentum to the market.
Innovations in AI-powered hearing aids, wearable neuromodulation devices, and smartphone-linked sound therapy platforms are enhancing both performance and patient engagement, aligning with global healthcare trends and regulatory standards. Rising healthcare infrastructure investments in Asia-Pacific, combined with stringent regulatory focus on safety, efficacy, and accessibility in North America and Europe, are strengthening market prospects.
The market is segmented by product, indication, distribution channel, and region. By product, the market is categorized into devices (sound masking devices, notched music devices, and hearing aids) and drugs (tricyclic antidepressants, antianxiety agents, and anticonvulsants). Based on indication, the market is bifurcated into subjective tinnitus and objective tinnitus. In terms of distribution channel, the market is segmented into audiology centers, ENT clinics, hospitals, and e-commerce. Regionally, the market spans North America, Latin America, Europe, South Asia, East Asia, Oceania, and the Middle East & Africa (MEA).
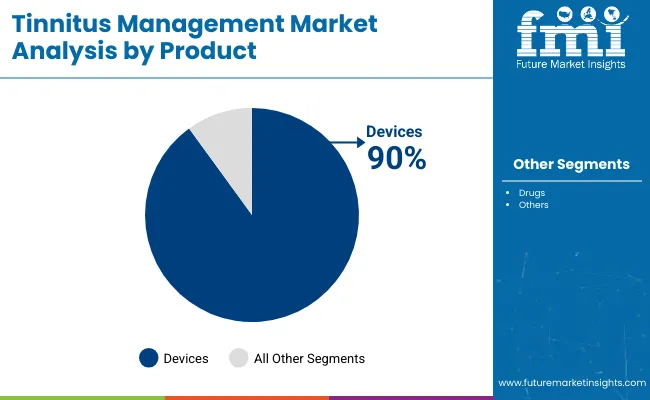
The devices segment dominates the product category in the tinnitus management market with a 90% share, driven by the widespread adoption of hearing aids, sound masking devices, and neuromodulation systems. These devices form the foundation of therapy, offering patients symptom relief, improved hearing experiences, and higher treatment compliance. Their clinical effectiveness, combined with integration capabilities with digital platforms, has positioned devices as the primary growth driver in the global market.
Hearing aids remain the most widely used solution, supported by innovations in digital connectivity, AI-powered sound personalization, and discreet form factors that enhance patient acceptance. Sound masking and notched music devices are also gaining traction, especially among patients seeking non-invasive, customizable therapies. Rising awareness of tinnitus care, along with increasing diagnosis rates, has further fueled adoption across healthcare and consumer markets.
Expanding healthcare infrastructure in North America, Europe, and Asia-Pacific, alongside favorable reimbursement policies and growing availability of over-the-counter hearing devices, is strengthening demand. Leading manufacturers are focusing on miniaturized, wireless, and integrated solutions that combine tinnitus relief with everyday hearing support. With increasing applications in audiology centers, ENT clinics, and consumer health platforms, the devices segment is expected to remain the cornerstone of product consumption in the coming decade.
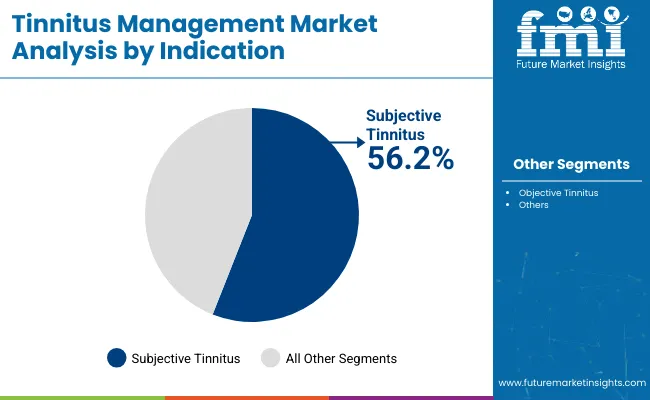
The subjective tinnitus segment dominates the indication category with a 56.2% market share in 2025, driven by the high prevalence of subjective tinnitus worldwide. This segment includes patients experiencing phantom sounds, ringing, or buzzing in the ears without any external source, which constitutes the majority of tinnitus cases. Management approaches typically combine devices, sound therapy, and counseling, making it a key revenue-generating segment.
The rising incidence of noise-induced hearing loss, age-related auditory decline, and stress-related tinnitus are fueling demand for effective therapies. Subjective tinnitus management benefits from technological innovations in hearing aids, sound masking devices, and digital neuromodulation systems, which provide customizable relief and improved patient outcomes.
Geographically, North America, Europe, and Asia-Pacific contribute significantly to the segment’s growth due to increasing healthcare infrastructure, higher diagnosis rates, and growing awareness about tinnitus treatments. With continued focus on innovative, patient-centric devices and therapies, the subjective tinnitus segment is expected to maintain its dominance over the forecast period.
In 2025, the global tinnitus management market is estimated at USD 3 billion, projected to reach USD 4 billion by 2035, at a CAGR of 4%. Devices account for 90% of market share, while subjective tinnitus leads with 56.2% share in 2025. Applications include audiology clinics, hospitals, homecare, and research institutions. Manufacturers are focusing on advanced sound therapy devices, smartphone-integrated solutions, neuromodulation technologies, and eco-friendly designs to improve patient comfort, adherence, and clinical efficacy. Increasing awareness programs, clinical trials, and integration of AI-enabled solutions further support market penetration.
Rising Prevalence and Technological Advancements Drive Market Adoption
The growing prevalence of tinnitus, linked to age-related hearing loss, noise exposure, and chronic health conditions, is a major driver of demand. The healthcare sector, particularly audiology and ENT clinics, is the leading consumer of tinnitus management devices due to their role in improving quality of life and reducing psychological distress. Sound masking devices, hearing aids with tinnitus therapy, and neuromodulation systems are witnessing rapid adoption. The ability of these devices to provide personalized therapy, reduce perceived ringing, and improve sleep and concentration continues to strengthen their uptake. Expanding healthcare access in North America, Europe, and Asia-Pacific further fuels market growth.
High Costs, Limited Awareness, and Regulatory Challenges Restrain Expansion
Despite growth, the market faces restraints due to the high cost of advanced tinnitus devices, limited reimbursement coverage, and uneven awareness levels across emerging economies. Regulatory approval processes for neuromodulation and AI-based devices add to commercialization challenges. In addition, the absence of a universal cure and variability in patient response reduce overall adoption. Environmental and supply chain concerns tied to electronic components also influence production costs. These limitations are encouraging manufacturers to innovate cost-effective, clinically validated, and accessible solutions while balancing compliance and patient affordability.
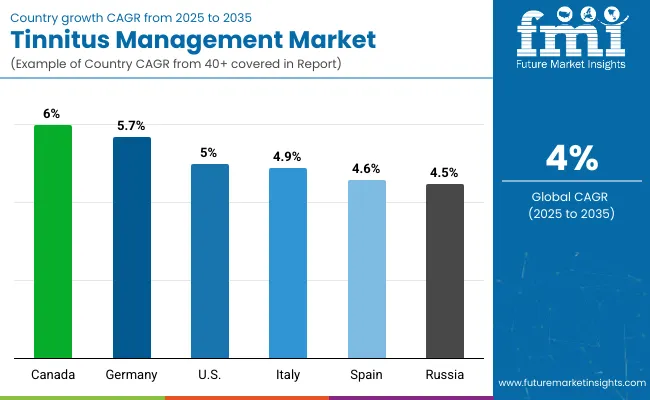
| Country | CAGR (2025 to 2035) |
|---|---|
| Canada | 6.0% |
| Germany | 5.7% |
| USA | 5.0% |
| Italy | 4.9% |
| Spain | 4.6% |
| Russia | 4.5% |
The tinnitus management market shows varied growth trajectories across the top six countries. Canada leads with the highest projected CAGR of 6.0% from 2025 to 2035, supported by increasing awareness of tinnitus therapies, technological adoption in audiology clinics, and expanding healthcare access. Germany maintains strong growth at 5.7%, fueled by rising prevalence, advanced hearing care infrastructure, and adoption of AI-driven and digital tinnitus management devices. The USA follows at 5.0%, driven by supportive reimbursement policies, early adoption of innovative devices, and well-established ENT and audiology networks. Meanwhile, Italy (4.9%), Spain (4.6%), and Russia (4.5%) experience steady growth, reflecting mature markets, rising patient awareness, and gradual adoption of advanced devices and digital therapy solutions.
The report covers an in-depth analysis of 40+ countries; six top-performing markets are highlighted below.
The tinnitus management market in Canada is projected to expand at a CAGR of 6.0% from 2025 to 2035, driven by increasing awareness of tinnitus therapies, technological adoption in audiology clinics, and expanding healthcare access. Manufacturers are investing in digital hearing aids, neuromodulation devices, and AI-enabled sound therapy solutions to improve treatment effectiveness and patient compliance. Growing healthcare infrastructure, ENT clinics, and specialized audiology centers are fueling adoption across clinical and homecare settings.
Key Statistics:
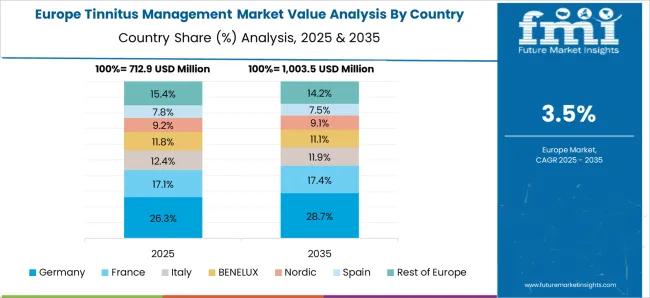
Revenue from tinnitus management in Germany is projected to grow at a CAGR of 5.7% from 2025 to 2035, fueled by rising prevalence, advanced hearing care infrastructure, and adoption of AI-driven and digital devices. Manufacturers are emphasizing clinically validated hearing aids, sound masking devices, and neuromodulation systems to meet regulatory standards and patient expectations. Expanding ENT clinics and research initiatives are driving adoption in both hospital and homecare settings.
Key Statistics:
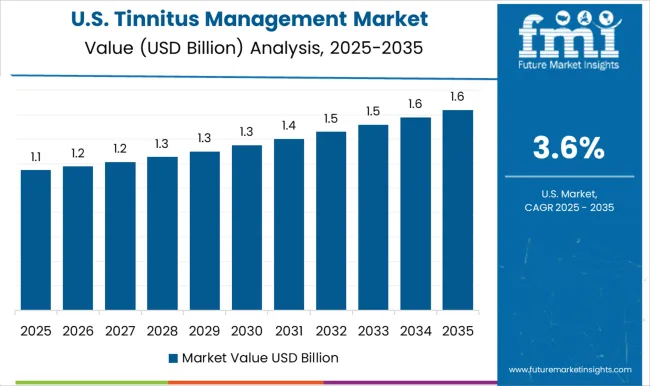
Sales of tinnitus management in the USA are expected to grow at a CAGR of 5.0% from 2025 to 2035, supported by early adoption of innovative devices, favorable reimbursement policies, and well-established ENT and audiology networks. Growth is driven by hearing aids, sound masking devices, and neuromodulation systems, alongside increased patient awareness and accessibility. Manufacturers are investing in digital, wearable, and telehealth-compatible solutions to enhance patient outcomes.
Key Statistics:
Revenue from tinnitus management in Italy is projected to grow at a CAGR of 4.9% from 2025 to 2035, driven by increasing patient awareness, mature healthcare infrastructure, and gradual adoption of advanced devices. Manufacturers are focusing on digital hearing aids, sound generators, and wearable neuromodulation devices to improve quality of life for patients. ENT clinics and audiology centers are primary adoption hubs.
Key Statistics:
The tinnitus management market in Spain is projected to expand at a CAGR of 4.6% from 2025 to 2035, supported by increasing awareness programs, clinical research initiatives, and growing adoption of advanced tinnitus devices. Manufacturers focus on AI-enabled, digital, and wearable devices to meet regulatory standards and patient expectations. Hospitals and audiology centers remain key adoption points.
Key Statistics:
Demand for tinnitus management in Russia is projected to grow at a CAGR of 4.5% from 2025 to 2035, fueled by rising prevalence, improving healthcare infrastructure, and gradual adoption of digital and wearable tinnitus management devices. Manufacturers are investing in cost-effective hearing aids, sound generators, and neuromodulation systems suitable for hospital and homecare applications.
Key Statistics:
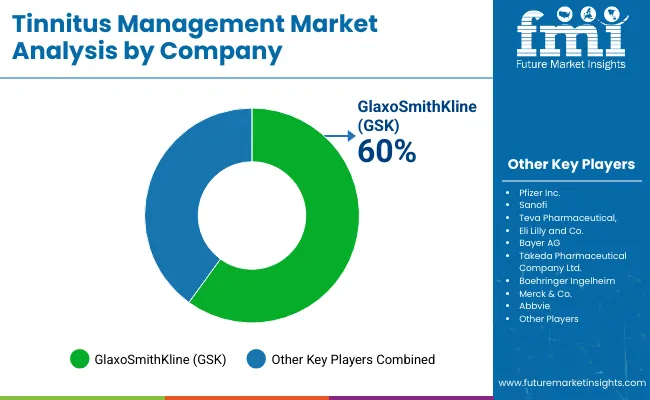
The market is moderately consolidated, comprising multinational pharmaceutical companies, specialized hearing device manufacturers, and regional producers. Key players include Pfizer Inc., Sanofi, Teva Pharmaceutical, GlaxoSmithKline, Eli Lilly and Co., Bayer AG, Takeda Pharmaceutical Company Ltd., Boehringer Ingelheim, Merck & Co., Abbvie, Starkey Laboratories, Inc., Oticon Inc., Neuromod Devices Ltd., Neuromonics, Inc., Puretone Ltd., Signia, and GN Hearing A/S. These companies leverage advanced production technologies, extensive R&D capabilities, and wide distribution networks to serve applications across audiology clinics, ENT centers, hospitals, and homecare solutions.
The market is characterized by a significant share of sound therapy devices, hearing aids, and neuromodulation systems, which accounted for over 90% of total product consumption in 2025. These products are preferred due to their effectiveness, ease of use, digital integration, and compatibility with various tinnitus management protocols. Traditional analog devices remain in use, whereas AI-enabled, wearable, and telehealth-integrated solutions are increasingly being adopted for personalized therapy.
Strategic initiatives such as mergers and acquisitions, joint ventures, regional expansions, and product innovation are common among market participants aiming to strengthen their global footprint. Additionally, companies are investing in clinically validated, AI-driven, and wearable solutions to meet evolving regulatory standards and patient expectations. Overall, the tinnitus management market continues to evolve as established and emerging players focus on technological innovation, digital integration, and expansion into high-growth healthcare and audiology segments, shaping the competitive landscape.
| Items | Values |
|---|---|
| Quantitative Units (2025) | USD 3 Billion |
| Product | Devices (Sound Masking Devices, Notched Music Devices, and Hearing Aids) and Drugs (Tricyclic Antidepressants, Antianxiety, and Anticonvulsants) |
| Indication | Subjective Tinnitus and Objective Tinnitus |
| Distribution Channel | Audiology Centers, ENT Clinics, Hospitals, and E-Commerce |
| Regions Covered | North America, Latin America, Western Europe, Eastern Europe, South Asia and Pacific, East Asia, and Middle East & Africa |
| Country Covered | United States, Canada, United Kingdom, Germany, France, China, Japan, South Korea, Brazil, Australia and 40+ countries |
| Key Companies Profiled | Pfizer Inc., Sanofi, Teva Pharmaceutical, GlaxoSmithKline, Eli Lilly and Co., Bayer AG, Takeda Pharmaceutical Company Ltd., Boehringer Ingelheim, Merck & Co., Abbvie, Starkey Laboratories, Inc., Oticon Inc., Neuromod Devices Ltd., Neuromonics, Inc., Puretone Ltd., Signia, and GN Hearing A/S |
| Additional Attributes | Dollar sales by product type and indication, regional demand trends, competitive landscape, adoption across hospitals, audiology clinics, and homecare applications, integration with digital, wearable, and AI-driven devices, innovations in neuromodulation and sound therapy devices, quality standardization across audiology centers, ENT clinics, and hospitals |
The global tinnitus management market is estimated to be valued at USD 3.0 billion in 2025.
The market size for the tinnitus management market is projected to reach USD 4.4 billion by 2035.
The tinnitus management market is expected to grow at a 3.8% CAGR between 2025 and 2035.
The key product types in tinnitus management market are devices, _sound masking devices, _notched music devices, _hearing aids, drugs, _tricyclic antidepressants, _antianxiety and _anticonvulsants.
In terms of indication, subjective tinnitus segment to command 67.5% share in the tinnitus management market in 2025.


Our Research Products

The "Full Research Suite" delivers actionable market intel, deep dives on markets or technologies, so clients act faster, cut risk, and unlock growth.

The Leaderboard benchmarks and ranks top vendors, classifying them as Established Leaders, Leading Challengers, or Disruptors & Challengers.

Locates where complements amplify value and substitutes erode it, forecasting net impact by horizon

We deliver granular, decision-grade intel: market sizing, 5-year forecasts, pricing, adoption, usage, revenue, and operational KPIs—plus competitor tracking, regulation, and value chains—across 60 countries broadly.

Spot the shifts before they hit your P&L. We track inflection points, adoption curves, pricing moves, and ecosystem plays to show where demand is heading, why it is changing, and what to do next across high-growth markets and disruptive tech

Real-time reads of user behavior. We track shifting priorities, perceptions of today’s and next-gen services, and provider experience, then pace how fast tech moves from trial to adoption, blending buyer, consumer, and channel inputs with social signals (#WhySwitch, #UX).

Partner with our analyst team to build a custom report designed around your business priorities. From analysing market trends to assessing competitors or crafting bespoke datasets, we tailor insights to your needs.
Supplier Intelligence
Discovery & Profiling
Capacity & Footprint
Performance & Risk
Compliance & Governance
Commercial Readiness
Who Supplies Whom
Scorecards & Shortlists
Playbooks & Docs
Category Intelligence
Definition & Scope
Demand & Use Cases
Cost Drivers
Market Structure
Supply Chain Map
Trade & Policy
Operating Norms
Deliverables
Buyer Intelligence
Account Basics
Spend & Scope
Procurement Model
Vendor Requirements
Terms & Policies
Entry Strategy
Pain Points & Triggers
Outputs
Pricing Analysis
Benchmarks
Trends
Should-Cost
Indexation
Landed Cost
Commercial Terms
Deliverables
Brand Analysis
Positioning & Value Prop
Share & Presence
Customer Evidence
Go-to-Market
Digital & Reputation
Compliance & Trust
KPIs & Gaps
Outputs
Full Research Suite comprises of:
Market outlook & trends analysis
Interviews & case studies
Strategic recommendations
Vendor profiles & capabilities analysis
5-year forecasts
8 regions and 60+ country-level data splits
Market segment data splits
12 months of continuous data updates
DELIVERED AS:
PDF EXCEL ONLINE
Tax Management Market Size and Share Forecast Outlook 2025 to 2035
Key Management as a Service Market
Cash Management Supplies Packaging Market Size and Share Forecast Outlook 2025 to 2035
Fuel Management Software Market Size and Share Forecast Outlook 2025 to 2035
Risk Management Market Size and Share Forecast Outlook 2025 to 2035
SBOM Management and Software Supply Chain Compliance Market Analysis - Size, Share, and Forecast Outlook 2025 to 2035
Case Management Software (CMS) Market Size and Share Forecast Outlook 2025 to 2035
Farm Management Software Market Size and Share Forecast Outlook 2025 to 2035
Lead Management Market Size and Share Forecast Outlook 2025 to 2035
Pain Management Devices Market Growth - Trends & Forecast 2025 to 2035
Data Management Platforms Market Analysis and Forecast 2025 to 2035, By Type, End User, and Region
Cash Management Services Market – Trends & Forecast 2025 to 2035
CAPA Management (Corrective Action / Preventive Action) Market
Exam Management Software Market
Asset Management Services Market Size and Share Forecast Outlook 2025 to 2035
Light Management System Market Size and Share Forecast Outlook 2025 to 2035
Labor Management System In Retail Market Size and Share Forecast Outlook 2025 to 2035
Waste Management Carbon Credit Market Size and Share Forecast Outlook 2025 to 2035
Waste Management Market Size and Share Forecast Outlook 2025 to 2035
Stool Management System Market Analysis - Size, Share, and Forecast Outlook 2025 to 2035

Thank you!
You will receive an email from our Business Development Manager. Please be sure to check your SPAM/JUNK folder too.
Chat With
MaRIA