Translation Management Systems Market Size, Share, and Forecast Outlook 2025 to 2035

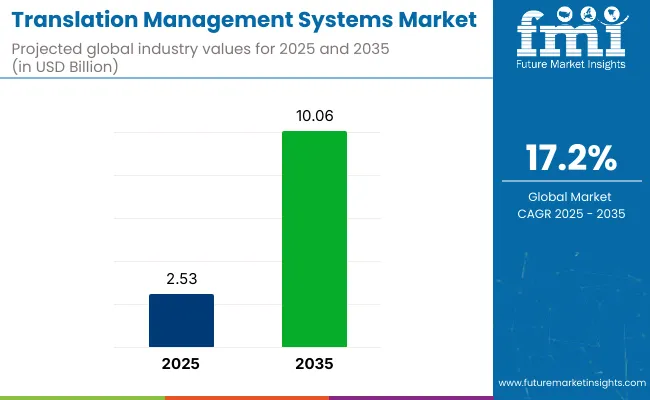
The translation management systems market is expected to grow from USD 2.53 billion in 2025 to USD 10.06 billion by 2035, representing a CAGR of 17.2% during this forecast period. Translation management systems (TMS) enable businesses to streamline and automate the translation and localization of content across multiple languages, ensuring consistency and efficiency in global communication. The growing need for businesses to reach a global audience and provide localized content is driving the demand for TMS solutions.
Quick Stats for the Translation Management Systems Market

  • Market Value (2025): USD 2.53 billion
  • Forecast Value (2035): USD 10.06 billion
  • Forecast CAGR (2025 to 2035): 17.2%
  • Leading Segment in 2035: Software (~54% share)
  • Key Growth Region: Asia Pacific (India)
  • Key Players: Acolad Group, Babylon Software, Centific, Google LLC, LanguageLine Solutions, Lionbridge,

Translation Management Systems Market

The translation management systems (TMS) market holds a growing yet focused share within its broader parent markets. In the global language services market, TMS accounts for approximately 5-7%, as it underpins the technology behind large-scale translation workflows. Within the localization services market, its share is higher at around 10-12%, since TMS platforms are core to managing multilingual content across digital platforms.

In the enterprise software market, TMS holds a niche share of about 0.5-1%, serving content-heavy industries like e-commerce, legal, and tech. In the content management market, it contributes roughly 1-2% by integrating with CMS platforms to automate global content delivery. Within the AI in language processing market, TMS comprises about 2-3%, driven by AI-powered translation and automation features.

Recent developments in this market include the integration of artificial intelligence (AI) and machine learning into TMS solutions, enhancing translation accuracy and speed. These innovations are improving the overall effectiveness of TMS, reducing human error and cost while providing faster turnaround times for translations.

In January 2025, Acolad was awarded two significant contracts by the Translation Centre for the Bodies of the European Union. These contracts involve delivering translations in 23 EU languages, supporting the Single Market Transparency Directive, and reinforcing Acolad’s leadership in regulatory translation excellence. This was officially announced in the company's press release.

Analysis of Translation Management Systems Market by Top Investment Segments

Software, finance & accounting, text-based content, translation applications, and IT & ITeS end users are projected to dominate the Market in 2025, driven by digital globalization trends.

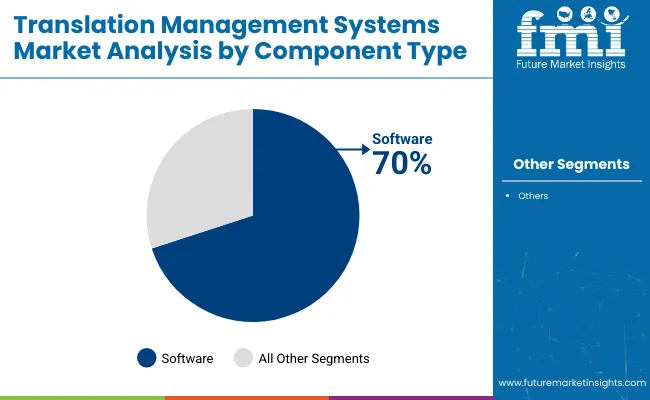
Software Dominates Component Type Segment with 70% Market Share in 2025

The software segment is forecasted to dominate the component type category with a 70% market share in 2025, driven by the growing reliance on SaaS-based translation platforms. These platforms offer integrated features such as translation memory, localization management, and real-time collaboration tools.
  • Leading providers are embedding AI-driven automation and machine learning algorithms to enhance translation speed and linguistic consistency.
  • Software-based solutions are favored for scalability, cost efficiency, and ease of integration with enterprise content systems.
  • Managed and professional services remain supplementary, supporting software tools but not replacing their central role in content localization.

Translation Management Systems Market Analysis By Component Type

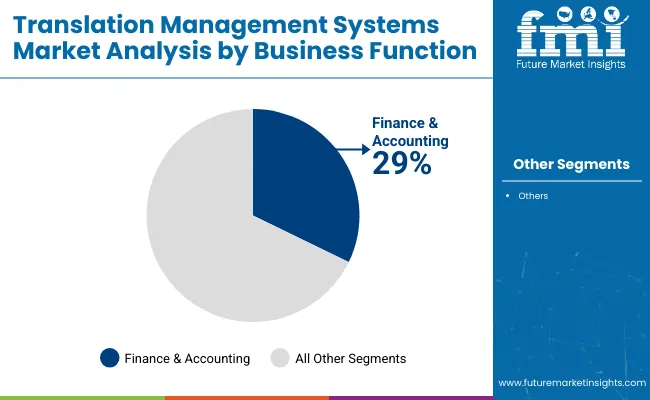
Finance & Accounting Leads Business Function Segment with 29% Market Share in 2025

The finance & accounting segment is projected to lead with a 29% market share in 2025, propelled by the need for precise translation of complex financial documents. Multinational corporations demand specialized TMS for translating reports, tax filings, audit documents, and contractual agreements.
  • Strict compliance requirements across regions increase reliance on secure, terminology-rich translation management platforms.
  • Confidentiality, accuracy, and legal adherence are critical drivers of TMS adoption in the financial sector.
  • Sales, marketing, and legal functions also utilize TMS solutions but handle lower translation volumes compared to finance & accounting.

Translation Management Systems Market Analysis By Business Function

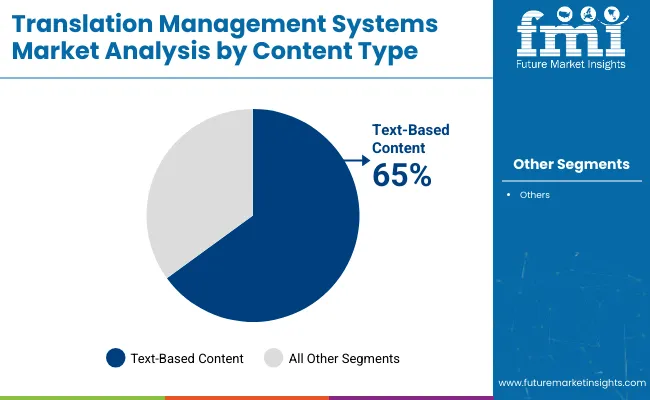
Text-Based Content Tops Content Type Segment with 65% Market Share in 2025

Text-based content is expected to dominate with a 65% market share in 2025, owing to continued high demand for website, document, and technical manual localization. Sectors like legal, technical, and regulatory services prioritize precise text translation over multimedia content.
  • Enterprises rely heavily on CAT tools and machine translation engines optimized for bulk text processing to reduce manual workload and cost.
  • Audio and video translation services are growing but remain secondary compared to the overwhelming need for textual data localization.
  • The importance of text-based content is reinforced by global compliance, product documentation, and operational communication needs.

Translation Management Systems Market Analysis By Content Type

Translation Emerges as Leading Application Segment with 35% Market Share in 2025

The translation application segment is set to lead with a 35% market share in 2025, as businesses prioritize multilingual content translation across industries. Core applications include document translation, software localization, and customer-facing content adaptation for global markets.
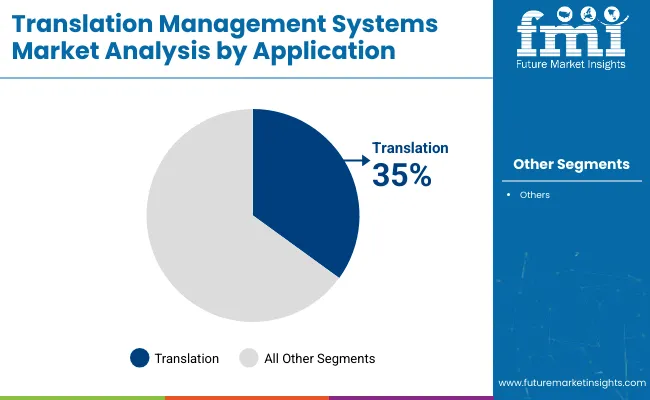
  • Translation remains the primary function, supported by ancillary applications such as project and terminology management.
  • Quality assurance modules play a role but are considered secondary to actual translation workflows in importance and usage.
  • The expansion of global e-commerce and international service delivery models further cements the translation segment’s leading position.

Translation Management Systems Market Analysis By Application

IT & ITeS Sector Leads End Use Segment in Digital Cytology Market by 2025

The IT & ITeS industry is expected to dominate with a 30% market share in 2025, driven by the sector’s expansive need for multilingual software and technical content localization. Global delivery models require translation of app interfaces, user manuals, helpdesk documentation, and source code comments for diverse markets.

  • Companies in this sector prioritize TMS solutions for scalability, technical accuracy, and reduced time-to-market in international launches.
  • Continuous global expansion of IT services ensures sustained high demand for enterprise-grade translation management platforms.

Top Translation Management Systems Market Dynamics

The market is advancing due to rising multilingual content needs and automation benefits, while integration challenges and data confidentiality concerns are limiting broader enterprise adoption.

Automation and global content demands are accelerating platform adoption

As businesses expand across regions, the need to manage, localize, and deliver multilingual content efficiently is being met through translation management systems (TMS). These platforms are enabling real-time collaboration between linguists, AI-powered engines, and content managers, reducing manual workloads and speeding up time-to-market.

Automation features like translation memory, glossaries, and machine learning integrations are improving consistency and cost-efficiency in large-scale localization workflows. E-commerce, legal, life sciences, and media sectors are increasingly relying on TMS platforms to maintain brand voice across global markets.

Integration issues and data security risks are slowing enterprise-scale deployment

Despite clear efficiency benefits, many enterprises are encountering obstacles in integrating translation management systems with their existing CMS, CRM, and product information systems. Custom API development and workflow reconfiguration often require additional investment, which can delay deployment.

Moreover, the handling of sensitive and proprietary information during translation-particularly in legal, healthcare, and financial services-raises concerns about data privacy and regulatory compliance. Without clear security protocols or region-specific hosting options, businesses remain hesitant to adopt TMS platforms at scale.
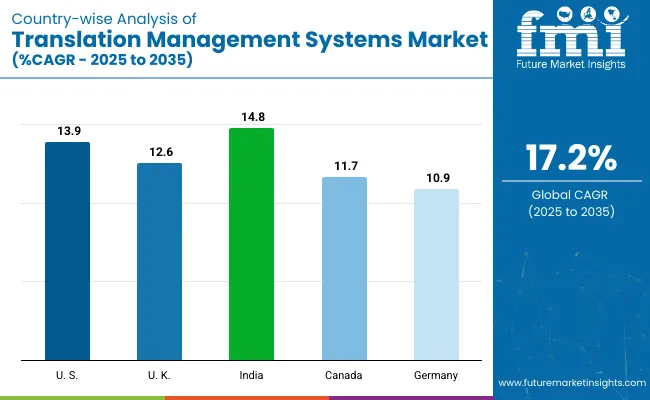
Top Countries Localizing Content, Automating Workflows, and Scaling Multilingual Communication in the Translation Management Systems Market

Country Wise Analysis Of Translation Management Systems Market Cagr 2025 To 2035

Countries CAGR (2025 to 2035)
USA 13.9%
UK 12.6%
India 14.8%
Canada 11.7%
Germany 10.9%

The TMS market is experiencing accelerated growth globally, driven by the surge in cross-border digital content, regulatory localization needs, and AI-based workflow optimization. India leads the growth among key players with a 14.8% CAGR, supported by digital transformation and multilingual tech enablement.

The USA (13.9%) and UK (12.6%) continue to shape the high-value enterprise TMS landscape through SaaS innovation and regulatory compliance demands. Canada (11.7%) and Germany (10.9%) reflect stable growth within mature markets with increasing use across government, healthcare, and e-commerce sectors.

Countries in the OECD bloc such as the USA, Germany, and Canada prioritize high-standard localization for legal, medical, and enterprise software domains. India, a BRICS and Emerging Market, is leveraging its linguistic diversity and outsourcing ecosystem to create scalable, cost-effective TMS solutions. The UK’s policy alignment post-Brexit further drives demand for independently governed translation frameworks.

The report covers extensive insights across 40+ countries. The five profiled below represent leading markets shaping the TMS ecosystem.

In-depth Analysis of the USA Translation Management Systems Market

The USA TMS market is growing at a 13.9% CAGR, anchored in SaaS leadership, enterprise globalization, and stringent localization standards across sectors. As an OECD member and Agri-food Tech Pioneer, the USA is adopting AI-driven TMS solutions in legal tech, life sciences, and cloud-based customer support. Major tech firms, media platforms, and government agencies are driving the adoption of integrated translation pipelines.

  • Strong enterprise SaaS ecosystem for AI-enabled translation
  • Regulatory compliance driving localization in healthcare, finance
  • Public-sector adoption for multilingual communication and accessibility

Opportunity Analysis of Translation Management Systems in the United Kingdom

The UK market is expanding at a 12.6% CAGR, with demand fueled by post-Brexit regulatory divergence, public-sector localization needs, and expanding media exports. The government and private sectors alike are investing in scalable, secure TMS platforms to meet multilingual service delivery and compliance. As a mature OECD economy, the UK combines advanced NLP research with pragmatic deployment across education, immigration, and broadcasting.

  • Post-Brexit localization complexity boosting platform demand
  • Growing role of TMS in public-facing government communication
  • Integration of AI and neural machine translation in large-scale use cases

Growth Outlook for Translation Management Systems in India

India is leading global growth with a 14.8% CAGR, driven by a massive multilingual population, expanding e-governance, and global outsourcing of content localization. As a BRICS country and Protein-Transition Market, India offers a cost-effective ecosystem for AI training datasets, language modeling, and outsourced TMS operations. Adoption is surging in fintech, edtech, and healthcare sectors, where inclusive language strategies are prioritized.

  • Multilingual digital public infrastructure driving demand
  • Global BPO sector leveraging Indian TMS hubs
  • Government focus on regional language enablement across services

Sales Outlook for Translation Management Systems in Canada

Canada’s TMS market is growing at 11.7% CAGR, shaped by federal bilingualism, growing immigrant population needs, and content localization in healthcare and education. As part of the OECD and NAFTA/USMCA, Canada’s market supports cross-border content harmonization with the USA and emphasizes quality control and compliance for public services.

  • Government mandates for bilingual service delivery
  • Growth in translation demand from immigration and healthcare
  • Increasing enterprise use of cloud-based TMS platforms

Demand Trends for Translation Management Systems in Germany

Germany is expanding at 10.9% CAGR, reflecting steady uptake of AI-based TMS in manufacturing, pharma, and regulatory sectors. A leader in the EU27 and among Sustainability-Focused Nations, Germany prioritizes data security, traceability, and compliance across multilingual software platforms. Enterprise digital transformation, combined with cross-border e-commerce, continues to drive market expansion.

  • Enterprise adoption for industrial, medical, and legal translation
  • Strong demand for secure, GDPR-compliant cloud TMS solutions
  • Localization key to EU product and labeling regulation adherence

Leading Translation Management Systems (TMS) Suppliers

The market is categorized into three tiers. Dominant players such as Google, Microsoft, Oracle, and SAP lead the market by offering enterprise-grade, AI-powered localization platforms with extensive API integration and global scalability. Key players like Lionbridge, TransPerfect, RWS Group, and LanguageLine Solutions focus on providing industry-specific TMS solutions by combining human translation expertise with advanced system capabilities.

Emerging players such as Smartcat, Transifex, Translate Plus, Localize Corporation, Acolad Group, Babylon Software, and Centific are recognized for their cloud-native architectures, collaborative features, and developer-friendly tools. While dominant players capture large-scale deployments, key and emerging vendors drive innovation through niche specialization and vertical-focused solutions.

Recent Translation Management Systems Industry News

  • In March 2025, TransPerfect launched GlobalLink for ServiceNow, combining ServiceNow's platform with GlobalLink’s AI-powered translation workflow to streamline content translation directly within ServiceNow.

Report Scope Table - Translation Management Systems Market

Report Attributes Details
Current Total Market Size (2025) USD 2.53 billion
Projected Market Size (2035) USD 10.06 billion
CAGR (2025 to 2035) 17.2%
Base Year for Estimation 2024
Historical Period 2020 to 2024
Projections Period 2025 to 2035
Quantitative Units USD billion for value and thousand units for volume
Component Types Analyzed (Segment 1) Software (translation software, localization software, terminology management software, quality assurance software, analytics and reporting, others) and services (professional services, managed services)
Business Function Analyzed (Segment 2) Finance & accounting, sales & marketing, legal, human resources, others
Content Type Analyzed (Segment 3) Audio-based content, text-based content, video-based content
Application Types Analyzed (Segment 4) Terminology management, translation, project management, quality assurance, billing & invoicing analysis, resource management, others
End-Use Types Analyzed (Segment 5) Retail & e-commerce, media & entertainment, IT & ITeS, healthcare & life sciences, BFSI, manufacturing, others
Regions Covered North America, Latin America, Europe, East Asia, South Asia & Pacific, Middle East & Africa
Countries Covered United States, Canada, Mexico, Brazil, Argentina, Germany, France, United Kingdom, Italy, Spain, Netherlands, China, India, Japan, South Korea, ANZ, GCC Countries, South Africa
Key Players influencing the Market Acolad Group, Babylon Software, Centific, Google LLC, LanguageLine Solutions, Lionbridge, Localize Corporation, Microsoft Corporation, Oracle Corporation, RWS Group, SAP SE, Smartcat, Transifex, Translate Plus, TransPerfect
Additional Attributes dollar sales, CAGR trends, market segmentation by function, content type, and end use, regional demand, competitive landscape, service and software differentiation

Key Players

  • Acolad Group
  • Babylon Software
  • Centific
  • Google LLC
  • LanguageLine Solutions
  • Lionbridge
  • Localize Corporation
  • Microsoft Corporation
  • Oracle Corporation
  • RWS Group
  • SAP SE
  • Smartcat
  • Transifex
  • Translate Plus
  • TransPerfect

Translation Management Systems Market Segmentation

By Component Type:

The segmentation is into software (translation software, localization software, terminology management software, quality assurance software, analytics and reporting, others) and services (professional services and managed services).

By Business Function:

The segmentation is into finance & accounting, sales & marketing, legal, human resources, and others.

By Content Type:

The segmentation is into audio-based content, text-based content, and video-based content.

By Application:

The segmentation is into terminology management, translation, project management, quality assurance, billing & invoicing analysis, resource management, and others.

By End Use:

The segmentation is into retail & e-commerce, media & entertainment, IT & ITeS, healthcare & life sciences, BFSI, manufacturing, and others.

Table of Content

  1. Executive Summary
    • Global Market Outlook
    • Demand-side Trends
    • Supply-side Trends
    • Technology Roadmap Analysis
    • Analysis and Recommendations
  2. Market Overview
    • Market Coverage / Taxonomy
    • Market Definition / Scope / Limitations
  3. Market Background
    • Market Dynamics
      • Drivers
      • Restraints
      • Opportunity
      • Trends
    • Scenario Forecast
      • Demand in Optimistic Scenario
      • Demand in Likely Scenario
      • Demand in Conservative Scenario
    • Opportunity Map Analysis
    • Product Life Cycle Analysis
    • Supply Chain Analysis
      • Supply Side Participants and their Roles
        • Producers
        • Mid-Level Participants (Traders/ Agents/ Brokers)
        • Wholesalers and Distributors
      • Value Added and Value Created at Node in the Supply Chain
      • List of Raw Material Suppliers
      • List of Existing and Potential Buyer’s
    • Investment Feasibility Matrix
    • Value Chain Analysis
      • Profit Margin Analysis
      • Wholesalers and Distributors
      • Retailers
    • PESTLE and Porter’s Analysis
    • Regulatory Landscape
      • By Key Regions
      • By Key Countries
    • Regional Parent Market Outlook
    • Production and Consumption Statistics
    • Import and Export Statistics
  4. Global Market Analysis 2020 to 2024 and Forecast, 2025 to 2035
    • Historical Market Size Value (USD Billion) & Volume (Thousand Units) Analysis, 2020 to 2024
    • Current and Future Market Size Value (USD Billion) & Volume (Thousand Units) Projections, 2025 to 2035
      • Y-o-Y Growth Trend Analysis
      • Absolute $ Opportunity Analysis
  5. Global Market Pricing Analysis 2020 to 2024 and Forecast 2025 to 2035
  6. Global Market Analysis 2020 to 2024 and Forecast 2025 to 2035, By Component Type
    • Introduction / Key Findings
    • Historical Market Size Value (USD Billion) & Volume (Thousand Units) Analysis By Component Type, 2020 to 2024
    • Current and Future Market Size Value (USD Billion) & Volume (Thousand Units) Analysis and Forecast By Component Type, 2025 to 2035
      • Software
        • Translation Software
        • Localization Software
        • Terminology Management Software
        • Quality Assurance Software
        • Analytics and Reporting
        • Others
      • Services
        • Professional Services
        • Managed Services
    • Y-o-Y Growth Trend Analysis By Component Type, 2020 to 2024
    • Absolute $ Opportunity Analysis By Component Type, 2025 to 2035
  7. Global Market Analysis 2020 to 2024 and Forecast 2025 to 2035, By Business Function
    • Introduction / Key Findings
    • Historical Market Size Value (USD Billion) & Volume (Thousand Units) Analysis By Business Function, 2020 to 2024
    • Current and Future Market Size Value (USD Billion) & Volume (Thousand Units) Analysis and Forecast By Business Function, 2025 to 2035
      • Finance & Accounting
      • Sales & Marketing
      • Legal
      • Human resources
      • Others
    • Y-o-Y Growth Trend Analysis By Business Function, 2020 to 2024
    • Absolute $ Opportunity Analysis By Business Function, 2025 to 2035
  8. Global Market Analysis 2020 to 2024 and Forecast 2025 to 2035, By Content Type
    • Introduction / Key Findings
    • Historical Market Size Value (USD Billion) & Volume (Thousand Units) Analysis By Content Type, 2020 to 2024
    • Current and Future Market Size Value (USD Billion) & Volume (Thousand Units) Analysis and Forecast By Content Type, 2025 to 2035
      • Audio-based Content
      • Text-based Content
      • Video-based Content
    • Y-o-Y Growth Trend Analysis By Content Type, 2020 to 2024
    • Absolute $ Opportunity Analysis By Content Type, 2025 to 2035
  9. Global Market Analysis 2020 to 2024 and Forecast 2025 to 2035, By Application
    • Introduction / Key Findings
    • Historical Market Size Value (USD Billion) & Volume (Thousand Units) Analysis By Application, 2020 to 2024
    • Current and Future Market Size Value (USD Billion) & Volume (Thousand Units) Analysis and Forecast By Application, 2025 to 2035
      • Terminology Management
      • Translation
      • Project Management
      • Quality Assurance
      • Billing & Invoicing Analysis
      • Resource Management
      • Others
    • Y-o-Y Growth Trend Analysis By Application, 2020 to 2024
    • Absolute $ Opportunity Analysis By Application, 2025 to 2035
  10. Global Market Analysis 2020 to 2024 and Forecast 2025 to 2035, By End Use
    • Introduction / Key Findings
    • Historical Market Size Value (USD Billion) & Volume (Thousand Units) Analysis By End Use, 2020 to 2024
    • Current and Future Market Size Value (USD Billion) & Volume (Thousand Units) Analysis and Forecast By End Use, 2025 to 2035
      • Retail & E-commerce
      • Media & Entertainment
      • IT & ITeS
      • Healthcare & Life Sciences
      • BFSI
      • Manufacturing
      • Others
    • Y-o-Y Growth Trend Analysis By End Use, 2020 to 2024
    • Absolute $ Opportunity Analysis By End Use, 2025 to 2035
  11. Global Market Analysis 2020 to 2024 and Forecast 2025 to 2035, By Region
    • Introduction
    • Historical Market Size Value (USD Billion) & Volume (Thousand Units) Analysis By Region, 2020 to 2024
    • Current Market Size Value (USD Billion) & Volume (Thousand Units) Analysis and Forecast By Region, 2025 to 2035
      • North America
      • Latin America
      • Western Europe
      • Eastern Europe
      • East Asia
      • South Asia & Pacific
      • Middle East and Africa
    • Market Attractiveness Analysis By Region
  12. North America Market Analysis 2020 to 2024 and Forecast 2025 to 2035, By Country
    • Historical Market Size Value (USD Billion) & Volume (Thousand Units) Trend Analysis By Market Taxonomy, 2020 to 2024
    • Market Size Value (USD Billion) & Volume (Thousand Units) Forecast By Market Taxonomy, 2025 to 2035
      • By Country
        • USA
        • Canada
        • Mexico
      • By Component Type
      • By Business Function
      • By Content Type
      • By Application
      • By End Use
    • Market Attractiveness Analysis
      • By Country
      • By Component Type
      • By Business Function
      • By Content Type
      • By Application
      • By End Use
    • Key Takeaways
  13. Latin America Market Analysis 2020 to 2024 and Forecast 2025 to 2035, By Country
    • Historical Market Size Value (USD Billion) & Volume (Thousand Units) Trend Analysis By Market Taxonomy, 2020 to 2024
    • Market Size Value (USD Billion) & Volume (Thousand Units) Forecast By Market Taxonomy, 2025 to 2035
      • By Country
        • Brazil
        • Argentina
        • Rest of LATAM
      • By Component Type
      • By Business Function
      • By Content Type
      • By Application
      • By End Use
    • Market Attractiveness Analysis
      • By Country
      • By Component Type
      • By Business Function
      • By Content Type
      • By Application
      • By End Use
    • Key Takeaways
  14. Western Europe Market Analysis 2020 to 2024 and Forecast 2025 to 2035, By Country
    • Historical Market Size Value (USD Billion) & Volume (Thousand Units) Trend Analysis By Market Taxonomy, 2020 to 2024
    • Market Size Value (USD Billion) & Volume (Thousand Units) Forecast By Market Taxonomy, 2025 to 2035
      • By Country
        • Germany
        • Italy
        • France
        • UK
        • Spain
        • BENELUX
        • Nordic
        • Rest of W.Europe
      • By Component Type
      • By Business Function
      • By Content Type
      • By Application
      • By End Use
    • Market Attractiveness Analysis
      • By Country
      • By Component Type
      • By Business Function
      • By Content Type
      • By Application
      • By End Use
    • Key Takeaways
  15. Eastern Europe Market Analysis 2020 to 2024 and Forecast 2025 to 2035, By Country
    • Historical Market Size Value (USD Billion) & Volume (Thousand Units) Trend Analysis By Market Taxonomy, 2020 to 2024
    • Market Size Value (USD Billion) & Volume (Thousand Units) Forecast By Market Taxonomy, 2025 to 2035
      • By Country
        • Russia
        • Hungary
        • Poland
        • Balkan & Baltics
        • Rest of E. Europe
      • By Component Type
      • By Business Function
      • By Content Type
      • By Application
      • By End Use
    • Market Attractiveness Analysis
      • By Country
      • By Component Type
      • By Business Function
      • By Content Type
      • By Application
      • By End Use
    • Key Takeaways
  16. East Asia Market Analysis 2020 to 2024 and Forecast 2025 to 2035, By Country
    • Historical Market Size Value (USD Billion) & Volume (Thousand Units) Trend Analysis By Market Taxonomy, 2020 to 2024
    • Market Size Value (USD Billion) & Volume (Thousand Units) Forecast By Market Taxonomy, 2025 to 2035
      • By Country
        • China
        • Japan
        • South Korea
      • By Component Type
      • By Business Function
      • By Content Type
      • By Application
      • By End Use
    • Market Attractiveness Analysis
      • By Country
      • By Component Type
      • By Business Function
      • By Content Type
      • By Application
      • By End Use
    • Key Takeaways
  17. South Asia & Pacific Market Analysis 2020 to 2024 and Forecast 2025 to 2035, By Country
    • Historical Market Size Value (USD Billion) & Volume (Thousand Units) Trend Analysis By Market Taxonomy, 2020 to 2024
    • Market Size Value (USD Billion) & Volume (Thousand Units) Forecast By Market Taxonomy, 2025 to 2035
      • By Country
        • India
        • Australia & New Zealand
        • ASEAN
        • Rest of SAP
      • By Component Type
      • By Business Function
      • By Content Type
      • By Application
      • By End Use
    • Market Attractiveness Analysis
      • By Country
      • By Component Type
      • By Business Function
      • By Content Type
      • By Application
      • By End Use
    • Key Takeaways
  18. Middle East and Africa Market Analysis 2020 to 2024 and Forecast 2025 to 2035, By Country
    • Historical Market Size Value (USD Billion) & Volume (Thousand Units) Trend Analysis By Market Taxonomy, 2020 to 2024
    • Market Size Value (USD Billion) & Volume (Thousand Units) Forecast By Market Taxonomy, 2025 to 2035
      • By Country
        • GCC Countries
        • Northern Africa
        • South Africa
        • Turkiye
        • Rest of MEA
      • By Component Type
      • By Business Function
      • By Content Type
      • By Application
      • By End Use
    • Market Attractiveness Analysis
      • By Country
      • By Component Type
      • By Business Function
      • By Content Type
      • By Application
      • By End Use
    • Key Takeaways
  19. Key Countries Market Analysis
    • USA
      • Pricing Analysis
      • Market Share Analysis, 2024
        • By Component Type
        • By Business Function
        • By Content Type
        • By Application
        • By End Use
    • Canada
      • Pricing Analysis
      • Market Share Analysis, 2024
        • By Component Type
        • By Business Function
        • By Content Type
        • By Application
        • By End Use
    • Brazil
      • Pricing Analysis
      • Market Share Analysis, 2024
        • By Component Type
        • By Business Function
        • By Content Type
        • By Application
        • By End Use
    • Mexico
      • Pricing Analysis
      • Market Share Analysis, 2024
        • By Component Type
        • By Business Function
        • By Content Type
        • By Application
        • By End Use
    • Argentina
      • Pricing Analysis
      • Market Share Analysis, 2024
        • By Component Type
        • By Business Function
        • By Content Type
        • By Application
        • By End Use
  20. Market Structure Analysis
    • Competition Dashboard
    • Competition Benchmarking
    • Market Share Analysis of Top Players
      • By Regional
      • By Component Type
      • By Business Function
      • By Content Type
      • By Application
      • By End Use
  21. Competition Analysis
    • Competition Deep Dive
      • Acolad Group
        • Overview
        • Product Portfolio
        • Profitability by Market Segments (Product/Age /Sales Channel/Region)
        • Sales Footprint
        • Strategy Overview
          • Marketing Strategy
          • Product Strategy
          • Channel Strategy
      • Babylon Software
        • Overview
        • Product Portfolio
        • Profitability by Market Segments (Product/Age /Sales Channel/Region)
        • Sales Footprint
        • Strategy Overview
          • Marketing Strategy
          • Product Strategy
          • Channel Strategy
      • Centific
        • Overview
        • Product Portfolio
        • Profitability by Market Segments (Product/Age /Sales Channel/Region)
        • Sales Footprint
        • Strategy Overview
          • Marketing Strategy
          • Product Strategy
          • Channel Strategy
      • Google LLC
        • Overview
        • Product Portfolio
        • Profitability by Market Segments (Product/Age /Sales Channel/Region)
        • Sales Footprint
        • Strategy Overview
          • Marketing Strategy
          • Product Strategy
          • Channel Strategy
      • LanguageLine Solutions
        • Overview
        • Product Portfolio
        • Profitability by Market Segments (Product/Age /Sales Channel/Region)
        • Sales Footprint
        • Strategy Overview
          • Marketing Strategy
          • Product Strategy
          • Channel Strategy
      • Lionbridge
        • Overview
        • Product Portfolio
        • Profitability by Market Segments (Product/Age /Sales Channel/Region)
        • Sales Footprint
        • Strategy Overview
          • Marketing Strategy
          • Product Strategy
          • Channel Strategy
      • Localize Corporation
        • Overview
        • Product Portfolio
        • Profitability by Market Segments (Product/Age /Sales Channel/Region)
        • Sales Footprint
        • Strategy Overview
          • Marketing Strategy
          • Product Strategy
          • Channel Strategy
      • Microsoft Corporation
        • Overview
        • Product Portfolio
        • Profitability by Market Segments (Product/Age /Sales Channel/Region)
        • Sales Footprint
        • Strategy Overview
          • Marketing Strategy
          • Product Strategy
          • Channel Strategy
      • Oracle Corporation
        • Overview
        • Product Portfolio
        • Profitability by Market Segments (Product/Age /Sales Channel/Region)
        • Sales Footprint
        • Strategy Overview
          • Marketing Strategy
          • Product Strategy
          • Channel Strategy
      • RWS Group
        • Overview
        • Product Portfolio
        • Profitability by Market Segments (Product/Age /Sales Channel/Region)
        • Sales Footprint
        • Strategy Overview
          • Marketing Strategy
          • Product Strategy
          • Channel Strategy
      • SAP SE
        • Overview
        • Product Portfolio
        • Profitability by Market Segments (Product/Age /Sales Channel/Region)
        • Sales Footprint
        • Strategy Overview
          • Marketing Strategy
          • Product Strategy
          • Channel Strategy
      • Smartcat
        • Overview
        • Product Portfolio
        • Profitability by Market Segments (Product/Age /Sales Channel/Region)
        • Sales Footprint
        • Strategy Overview
          • Marketing Strategy
          • Product Strategy
          • Channel Strategy
      • Transifex
        • Overview
        • Product Portfolio
        • Profitability by Market Segments (Product/Age /Sales Channel/Region)
        • Sales Footprint
        • Strategy Overview
          • Marketing Strategy
          • Product Strategy
          • Channel Strategy
      • Translate Plus
        • Overview
        • Product Portfolio
        • Profitability by Market Segments (Product/Age /Sales Channel/Region)
        • Sales Footprint
        • Strategy Overview
          • Marketing Strategy
          • Product Strategy
          • Channel Strategy
      • TransPerfect
        • Overview
        • Product Portfolio
        • Profitability by Market Segments (Product/Age /Sales Channel/Region)
        • Sales Footprint
        • Strategy Overview
          • Marketing Strategy
          • Product Strategy
          • Channel Strategy
  22. Assumptions & Acronyms Used
  23. Research Methodology

List of Tables

  • Table 1: Global Market Value (USD Billion) Forecast by Region, 2020 to 2035
  • Table 2: Global Market Volume (Thousand Units) Forecast by Region, 2020 to 2035
  • Table 3: Global Market Value (USD Billion) Forecast by Component Type, 2020 to 2035
  • Table 4: Global Market Volume (Thousand Units) Forecast by Component Type, 2020 to 2035
  • Table 5: Global Market Value (USD Billion) Forecast by Business Function, 2020 to 2035
  • Table 6: Global Market Volume (Thousand Units) Forecast by Business Function, 2020 to 2035
  • Table 7: Global Market Value (USD Billion) Forecast by Content Type, 2020 to 2035
  • Table 8: Global Market Volume (Thousand Units) Forecast by Content Type, 2020 to 2035
  • Table 9: Global Market Value (USD Billion) Forecast by Application, 2020 to 2035
  • Table 10: Global Market Volume (Thousand Units) Forecast by Application, 2020 to 2035
  • Table 11: Global Market Value (USD Billion) Forecast by End Use, 2020 to 2035
  • Table 12: Global Market Volume (Thousand Units) Forecast by End Use, 2020 to 2035
  • Table 13: North America Market Value (USD Billion) Forecast by Country, 2020 to 2035
  • Table 14: North America Market Volume (Thousand Units) Forecast by Country, 2020 to 2035
  • Table 15: North America Market Value (USD Billion) Forecast by Component Type, 2020 to 2035
  • Table 16: North America Market Volume (Thousand Units) Forecast by Component Type, 2020 to 2035
  • Table 17: North America Market Value (USD Billion) Forecast by Business Function, 2020 to 2035
  • Table 18: North America Market Volume (Thousand Units) Forecast by Business Function, 2020 to 2035
  • Table 19: North America Market Value (USD Billion) Forecast by Content Type, 2020 to 2035
  • Table 20: North America Market Volume (Thousand Units) Forecast by Content Type, 2020 to 2035
  • Table 21: North America Market Value (USD Billion) Forecast by Application, 2020 to 2035
  • Table 22: North America Market Volume (Thousand Units) Forecast by Application, 2020 to 2035
  • Table 23: North America Market Value (USD Billion) Forecast by End Use, 2020 to 2035
  • Table 24: North America Market Volume (Thousand Units) Forecast by End Use, 2020 to 2035
  • Table 25: Latin America Market Value (USD Billion) Forecast by Country, 2020 to 2035
  • Table 26: Latin America Market Volume (Thousand Units) Forecast by Country, 2020 to 2035
  • Table 27: Latin America Market Value (USD Billion) Forecast by Component Type, 2020 to 2035
  • Table 28: Latin America Market Volume (Thousand Units) Forecast by Component Type, 2020 to 2035
  • Table 29: Latin America Market Value (USD Billion) Forecast by Business Function, 2020 to 2035
  • Table 30: Latin America Market Volume (Thousand Units) Forecast by Business Function, 2020 to 2035
  • Table 31: Latin America Market Value (USD Billion) Forecast by Content Type, 2020 to 2035
  • Table 32: Latin America Market Volume (Thousand Units) Forecast by Content Type, 2020 to 2035
  • Table 33: Latin America Market Value (USD Billion) Forecast by Application, 2020 to 2035
  • Table 34: Latin America Market Volume (Thousand Units) Forecast by Application, 2020 to 2035
  • Table 35: Latin America Market Value (USD Billion) Forecast by End Use, 2020 to 2035
  • Table 36: Latin America Market Volume (Thousand Units) Forecast by End Use, 2020 to 2035
  • Table 37: Western Europe Market Value (USD Billion) Forecast by Country, 2020 to 2035
  • Table 38: Western Europe Market Volume (Thousand Units) Forecast by Country, 2020 to 2035
  • Table 39: Western Europe Market Value (USD Billion) Forecast by Component Type, 2020 to 2035
  • Table 40: Western Europe Market Volume (Thousand Units) Forecast by Component Type, 2020 to 2035
  • Table 41: Western Europe Market Value (USD Billion) Forecast by Business Function, 2020 to 2035
  • Table 42: Western Europe Market Volume (Thousand Units) Forecast by Business Function, 2020 to 2035
  • Table 43: Western Europe Market Value (USD Billion) Forecast by Content Type, 2020 to 2035
  • Table 44: Western Europe Market Volume (Thousand Units) Forecast by Content Type, 2020 to 2035
  • Table 45: Western Europe Market Value (USD Billion) Forecast by Application, 2020 to 2035
  • Table 46: Western Europe Market Volume (Thousand Units) Forecast by Application, 2020 to 2035
  • Table 47: Western Europe Market Value (USD Billion) Forecast by End Use, 2020 to 2035
  • Table 48: Western Europe Market Volume (Thousand Units) Forecast by End Use, 2020 to 2035
  • Table 49: Eastern Europe Market Value (USD Billion) Forecast by Country, 2020 to 2035
  • Table 50: Eastern Europe Market Volume (Thousand Units) Forecast by Country, 2020 to 2035
  • Table 51: Eastern Europe Market Value (USD Billion) Forecast by Component Type, 2020 to 2035
  • Table 52: Eastern Europe Market Volume (Thousand Units) Forecast by Component Type, 2020 to 2035
  • Table 53: Eastern Europe Market Value (USD Billion) Forecast by Business Function, 2020 to 2035
  • Table 54: Eastern Europe Market Volume (Thousand Units) Forecast by Business Function, 2020 to 2035
  • Table 55: Eastern Europe Market Value (USD Billion) Forecast by Content Type, 2020 to 2035
  • Table 56: Eastern Europe Market Volume (Thousand Units) Forecast by Content Type, 2020 to 2035
  • Table 57: Eastern Europe Market Value (USD Billion) Forecast by Application, 2020 to 2035
  • Table 58: Eastern Europe Market Volume (Thousand Units) Forecast by Application, 2020 to 2035
  • Table 59: Eastern Europe Market Value (USD Billion) Forecast by End Use, 2020 to 2035
  • Table 60: Eastern Europe Market Volume (Thousand Units) Forecast by End Use, 2020 to 2035
  • Table 61: East Asia Market Value (USD Billion) Forecast by Country, 2020 to 2035
  • Table 62: East Asia Market Volume (Thousand Units) Forecast by Country, 2020 to 2035
  • Table 63: East Asia Market Value (USD Billion) Forecast by Component Type, 2020 to 2035
  • Table 64: East Asia Market Volume (Thousand Units) Forecast by Component Type, 2020 to 2035
  • Table 65: East Asia Market Value (USD Billion) Forecast by Business Function, 2020 to 2035
  • Table 66: East Asia Market Volume (Thousand Units) Forecast by Business Function, 2020 to 2035
  • Table 67: East Asia Market Value (USD Billion) Forecast by Content Type, 2020 to 2035
  • Table 68: East Asia Market Volume (Thousand Units) Forecast by Content Type, 2020 to 2035
  • Table 69: East Asia Market Value (USD Billion) Forecast by Application, 2020 to 2035
  • Table 70: East Asia Market Volume (Thousand Units) Forecast by Application, 2020 to 2035
  • Table 71: East Asia Market Value (USD Billion) Forecast by End Use, 2020 to 2035
  • Table 72: East Asia Market Volume (Thousand Units) Forecast by End Use, 2020 to 2035
  • Table 73: South Asia & Pacific Market Value (USD Billion) Forecast by Country, 2020 to 2035
  • Table 74: South Asia & Pacific Market Volume (Thousand Units) Forecast by Country, 2020 to 2035
  • Table 75: South Asia & Pacific Market Value (USD Billion) Forecast by Component Type, 2020 to 2035
  • Table 76: South Asia & Pacific Market Volume (Thousand Units) Forecast by Component Type, 2020 to 2035
  • Table 77: South Asia & Pacific Market Value (USD Billion) Forecast by Business Function, 2020 to 2035
  • Table 78: South Asia & Pacific Market Volume (Thousand Units) Forecast by Business Function, 2020 to 2035
  • Table 79: South Asia & Pacific Market Value (USD Billion) Forecast by Content Type, 2020 to 2035
  • Table 80: South Asia & Pacific Market Volume (Thousand Units) Forecast by Content Type, 2020 to 2035
  • Table 81: South Asia & Pacific Market Value (USD Billion) Forecast by Application, 2020 to 2035
  • Table 82: South Asia & Pacific Market Volume (Thousand Units) Forecast by Application, 2020 to 2035
  • Table 83: South Asia & Pacific Market Value (USD Billion) Forecast by End Use, 2020 to 2035
  • Table 84: South Asia & Pacific Market Volume (Thousand Units) Forecast by End Use, 2020 to 2035
  • Table 85: Middle East and Africa Market Value (USD Billion) Forecast by Country, 2020 to 2035
  • Table 86: Middle East and Africa Market Volume (Thousand Units) Forecast by Country, 2020 to 2035
  • Table 87: Middle East and Africa Market Value (USD Billion) Forecast by Component Type, 2020 to 2035
  • Table 88: Middle East and Africa Market Volume (Thousand Units) Forecast by Component Type, 2020 to 2035
  • Table 89: Middle East and Africa Market Value (USD Billion) Forecast by Business Function, 2020 to 2035
  • Table 90: Middle East and Africa Market Volume (Thousand Units) Forecast by Business Function, 2020 to 2035
  • Table 91: Middle East and Africa Market Value (USD Billion) Forecast by Content Type, 2020 to 2035
  • Table 92: Middle East and Africa Market Volume (Thousand Units) Forecast by Content Type, 2020 to 2035
  • Table 93: Middle East and Africa Market Value (USD Billion) Forecast by Application, 2020 to 2035
  • Table 94: Middle East and Africa Market Volume (Thousand Units) Forecast by Application, 2020 to 2035
  • Table 95: Middle East and Africa Market Value (USD Billion) Forecast by End Use, 2020 to 2035
  • Table 96: Middle East and Africa Market Volume (Thousand Units) Forecast by End Use, 2020 to 2035

List of Figures

  • Figure 1: Global Market Volume (Thousand Units) Forecast 2020 to 2035
  • Figure 2: Global Market Pricing Analysis
  • Figure 3: Global Market Value (USD Billion) Forecast 2020 to 2035
  • Figure 4: Global Market Value Share and BPS Analysis by Component Type, 2025 and 2035
  • Figure 5: Global Market Y-o-Y Growth Comparison by Component Type, 2025 to 2035
  • Figure 6: Global Market Attractiveness Analysis by Component Type
  • Figure 7: Global Market Value Share and BPS Analysis by Business Function, 2025 and 2035
  • Figure 8: Global Market Y-o-Y Growth Comparison by Business Function, 2025 to 2035
  • Figure 9: Global Market Attractiveness Analysis by Business Function
  • Figure 10: Global Market Value Share and BPS Analysis by Content Type, 2025 and 2035
  • Figure 11: Global Market Y-o-Y Growth Comparison by Content Type, 2025 to 2035
  • Figure 12: Global Market Attractiveness Analysis by Content Type
  • Figure 13: Global Market Value Share and BPS Analysis by Application, 2025 and 2035
  • Figure 14: Global Market Y-o-Y Growth Comparison by Application, 2025 to 2035
  • Figure 15: Global Market Attractiveness Analysis by Application
  • Figure 16: Global Market Value Share and BPS Analysis by End Use, 2025 and 2035
  • Figure 17: Global Market Y-o-Y Growth Comparison by End Use, 2025 to 2035
  • Figure 18: Global Market Attractiveness Analysis by End Use
  • Figure 19: Global Market Value (USD Billion) Share and BPS Analysis by Region, 2025 and 2035
  • Figure 20: Global Market Y-o-Y Growth Comparison by Region, 2025 to 2035
  • Figure 21: Global Market Attractiveness Analysis by Region
  • Figure 22: North America Market Incremental $ Opportunity, 2025 to 2035
  • Figure 23: Latin America Market Incremental $ Opportunity, 2025 to 2035
  • Figure 24: Western Europe Market Incremental $ Opportunity, 2025 to 2035
  • Figure 25: Eastern Europe Market Incremental $ Opportunity, 2025 to 2035
  • Figure 26: East Asia Market Incremental $ Opportunity, 2025 to 2035
  • Figure 27: South Asia & Pacific Market Incremental $ Opportunity, 2025 to 2035
  • Figure 28: Middle East and Africa Market Incremental $ Opportunity, 2025 to 2035
  • Figure 29: North America Market Value Share and BPS Analysis by Country, 2025 and 2035
  • Figure 30: North America Market Value Share and BPS Analysis by Component Type, 2025 and 2035
  • Figure 31: North America Market Y-o-Y Growth Comparison by Component Type, 2025 to 2035
  • Figure 32: North America Market Attractiveness Analysis by Component Type
  • Figure 33: North America Market Value Share and BPS Analysis by Business Function, 2025 and 2035
  • Figure 34: North America Market Y-o-Y Growth Comparison by Business Function, 2025 to 2035
  • Figure 35: North America Market Attractiveness Analysis by Business Function
  • Figure 36: North America Market Value Share and BPS Analysis by Content Type, 2025 and 2035
  • Figure 37: North America Market Y-o-Y Growth Comparison by Content Type, 2025 to 2035
  • Figure 38: North America Market Attractiveness Analysis by Content Type
  • Figure 39: North America Market Value Share and BPS Analysis by Application, 2025 and 2035
  • Figure 40: North America Market Y-o-Y Growth Comparison by Application, 2025 to 2035
  • Figure 41: North America Market Attractiveness Analysis by Application
  • Figure 42: North America Market Value Share and BPS Analysis by End Use, 2025 and 2035
  • Figure 43: North America Market Y-o-Y Growth Comparison by End Use, 2025 to 2035
  • Figure 44: North America Market Attractiveness Analysis by End Use
  • Figure 45: Latin America Market Value Share and BPS Analysis by Country, 2025 and 2035
  • Figure 46: Latin America Market Value Share and BPS Analysis by Component Type, 2025 and 2035
  • Figure 47: Latin America Market Y-o-Y Growth Comparison by Component Type, 2025 to 2035
  • Figure 48: Latin America Market Attractiveness Analysis by Component Type
  • Figure 49: Latin America Market Value Share and BPS Analysis by Business Function, 2025 and 2035
  • Figure 50: Latin America Market Y-o-Y Growth Comparison by Business Function, 2025 to 2035
  • Figure 51: Latin America Market Attractiveness Analysis by Business Function
  • Figure 52: Latin America Market Value Share and BPS Analysis by Content Type, 2025 and 2035
  • Figure 53: Latin America Market Y-o-Y Growth Comparison by Content Type, 2025 to 2035
  • Figure 54: Latin America Market Attractiveness Analysis by Content Type
  • Figure 55: Latin America Market Value Share and BPS Analysis by Application, 2025 and 2035
  • Figure 56: Latin America Market Y-o-Y Growth Comparison by Application, 2025 to 2035
  • Figure 57: Latin America Market Attractiveness Analysis by Application
  • Figure 58: Latin America Market Value Share and BPS Analysis by End Use, 2025 and 2035
  • Figure 59: Latin America Market Y-o-Y Growth Comparison by End Use, 2025 to 2035
  • Figure 60: Latin America Market Attractiveness Analysis by End Use
  • Figure 61: Western Europe Market Value Share and BPS Analysis by Country, 2025 and 2035
  • Figure 62: Western Europe Market Value Share and BPS Analysis by Component Type, 2025 and 2035
  • Figure 63: Western Europe Market Y-o-Y Growth Comparison by Component Type, 2025 to 2035
  • Figure 64: Western Europe Market Attractiveness Analysis by Component Type
  • Figure 65: Western Europe Market Value Share and BPS Analysis by Business Function, 2025 and 2035
  • Figure 66: Western Europe Market Y-o-Y Growth Comparison by Business Function, 2025 to 2035
  • Figure 67: Western Europe Market Attractiveness Analysis by Business Function
  • Figure 68: Western Europe Market Value Share and BPS Analysis by Content Type, 2025 and 2035
  • Figure 69: Western Europe Market Y-o-Y Growth Comparison by Content Type, 2025 to 2035
  • Figure 70: Western Europe Market Attractiveness Analysis by Content Type
  • Figure 71: Western Europe Market Value Share and BPS Analysis by Application, 2025 and 2035
  • Figure 72: Western Europe Market Y-o-Y Growth Comparison by Application, 2025 to 2035
  • Figure 73: Western Europe Market Attractiveness Analysis by Application
  • Figure 74: Western Europe Market Value Share and BPS Analysis by End Use, 2025 and 2035
  • Figure 75: Western Europe Market Y-o-Y Growth Comparison by End Use, 2025 to 2035
  • Figure 76: Western Europe Market Attractiveness Analysis by End Use
  • Figure 77: Eastern Europe Market Value Share and BPS Analysis by Country, 2025 and 2035
  • Figure 78: Eastern Europe Market Value Share and BPS Analysis by Component Type, 2025 and 2035
  • Figure 79: Eastern Europe Market Y-o-Y Growth Comparison by Component Type, 2025 to 2035
  • Figure 80: Eastern Europe Market Attractiveness Analysis by Component Type
  • Figure 81: Eastern Europe Market Value Share and BPS Analysis by Business Function, 2025 and 2035
  • Figure 82: Eastern Europe Market Y-o-Y Growth Comparison by Business Function, 2025 to 2035
  • Figure 83: Eastern Europe Market Attractiveness Analysis by Business Function
  • Figure 84: Eastern Europe Market Value Share and BPS Analysis by Content Type, 2025 and 2035
  • Figure 85: Eastern Europe Market Y-o-Y Growth Comparison by Content Type, 2025 to 2035
  • Figure 86: Eastern Europe Market Attractiveness Analysis by Content Type
  • Figure 87: Eastern Europe Market Value Share and BPS Analysis by Application, 2025 and 2035
  • Figure 88: Eastern Europe Market Y-o-Y Growth Comparison by Application, 2025 to 2035
  • Figure 89: Eastern Europe Market Attractiveness Analysis by Application
  • Figure 90: Eastern Europe Market Value Share and BPS Analysis by End Use, 2025 and 2035
  • Figure 91: Eastern Europe Market Y-o-Y Growth Comparison by End Use, 2025 to 2035
  • Figure 92: Eastern Europe Market Attractiveness Analysis by End Use
  • Figure 93: East Asia Market Value Share and BPS Analysis by Country, 2025 and 2035
  • Figure 94: East Asia Market Value Share and BPS Analysis by Component Type, 2025 and 2035
  • Figure 95: East Asia Market Y-o-Y Growth Comparison by Component Type, 2025 to 2035
  • Figure 96: East Asia Market Attractiveness Analysis by Component Type
  • Figure 97: East Asia Market Value Share and BPS Analysis by Business Function, 2025 and 2035
  • Figure 98: East Asia Market Y-o-Y Growth Comparison by Business Function, 2025 to 2035
  • Figure 99: East Asia Market Attractiveness Analysis by Business Function
  • Figure 100: East Asia Market Value Share and BPS Analysis by Content Type, 2025 and 2035
  • Figure 101: East Asia Market Y-o-Y Growth Comparison by Content Type, 2025 to 2035
  • Figure 102: East Asia Market Attractiveness Analysis by Content Type
  • Figure 103: East Asia Market Value Share and BPS Analysis by Application, 2025 and 2035
  • Figure 104: East Asia Market Y-o-Y Growth Comparison by Application, 2025 to 2035
  • Figure 105: East Asia Market Attractiveness Analysis by Application
  • Figure 106: East Asia Market Value Share and BPS Analysis by End Use, 2025 and 2035
  • Figure 107: East Asia Market Y-o-Y Growth Comparison by End Use, 2025 to 2035
  • Figure 108: East Asia Market Attractiveness Analysis by End Use
  • Figure 109: South Asia & Pacific Market Value Share and BPS Analysis by Country, 2025 and 2035
  • Figure 110: South Asia & Pacific Market Value Share and BPS Analysis by Component Type, 2025 and 2035
  • Figure 111: South Asia & Pacific Market Y-o-Y Growth Comparison by Component Type, 2025 to 2035
  • Figure 112: South Asia & Pacific Market Attractiveness Analysis by Component Type
  • Figure 113: South Asia & Pacific Market Value Share and BPS Analysis by Business Function, 2025 and 2035
  • Figure 114: South Asia & Pacific Market Y-o-Y Growth Comparison by Business Function, 2025 to 2035
  • Figure 115: South Asia & Pacific Market Attractiveness Analysis by Business Function
  • Figure 116: South Asia & Pacific Market Value Share and BPS Analysis by Content Type, 2025 and 2035
  • Figure 117: South Asia & Pacific Market Y-o-Y Growth Comparison by Content Type, 2025 to 2035
  • Figure 118: South Asia & Pacific Market Attractiveness Analysis by Content Type
  • Figure 119: South Asia & Pacific Market Value Share and BPS Analysis by Application, 2025 and 2035
  • Figure 120: South Asia & Pacific Market Y-o-Y Growth Comparison by Application, 2025 to 2035
  • Figure 121: South Asia & Pacific Market Attractiveness Analysis by Application
  • Figure 122: South Asia & Pacific Market Value Share and BPS Analysis by End Use, 2025 and 2035
  • Figure 123: South Asia & Pacific Market Y-o-Y Growth Comparison by End Use, 2025 to 2035
  • Figure 124: South Asia & Pacific Market Attractiveness Analysis by End Use
  • Figure 125: Middle East and Africa Market Value Share and BPS Analysis by Country, 2025 and 2035
  • Figure 126: Middle East and Africa Market Value Share and BPS Analysis by Component Type, 2025 and 2035
  • Figure 127: Middle East and Africa Market Y-o-Y Growth Comparison by Component Type, 2025 to 2035
  • Figure 128: Middle East and Africa Market Attractiveness Analysis by Component Type
  • Figure 129: Middle East and Africa Market Value Share and BPS Analysis by Business Function, 2025 and 2035
  • Figure 130: Middle East and Africa Market Y-o-Y Growth Comparison by Business Function, 2025 to 2035
  • Figure 131: Middle East and Africa Market Attractiveness Analysis by Business Function
  • Figure 132: Middle East and Africa Market Value Share and BPS Analysis by Content Type, 2025 and 2035
  • Figure 133: Middle East and Africa Market Y-o-Y Growth Comparison by Content Type, 2025 to 2035
  • Figure 134: Middle East and Africa Market Attractiveness Analysis by Content Type
  • Figure 135: Middle East and Africa Market Value Share and BPS Analysis by Application, 2025 and 2035
  • Figure 136: Middle East and Africa Market Y-o-Y Growth Comparison by Application, 2025 to 2035
  • Figure 137: Middle East and Africa Market Attractiveness Analysis by Application
  • Figure 138: Middle East and Africa Market Value Share and BPS Analysis by End Use, 2025 and 2035
  • Figure 139: Middle East and Africa Market Y-o-Y Growth Comparison by End Use, 2025 to 2035
  • Figure 140: Middle East and Africa Market Attractiveness Analysis by End Use
  • Figure 141: Global Market - Tier Structure Analysis
  • Figure 142: Global Market - Company Share Analysis

Frequently Asked Questions

How big is the translation management systems market?

The market is expected to reach USD 2.53 billion in 2025.

What is the outlook for the translation management systems market?

Sales in the market are projected to grow steadily, reaching approximately USD 10.06 billion by 2035.

Which country is expected to see the fastest growth in this market?

India is anticipated to lead with a CAGR of 14.8% during the forecast period.

Which sub-segment dominates the industry?

The software segment dominates the industry by component type with 54% market share.

Who is the leading key player in the translation management systems industry?

TransPerfect is the leading key player with 20% market share.

Explore Similar Insights

Future Market Insights

Translation Management Systems Market