

- Market Size (2026)
- USD 620.6 Mn
- Forecast (2036)
- USD 1001.3 Mn
- CAGR (2026 to 2036)
- 4.9%
How big is the Transmission Linkage Bushings Market in 2026?
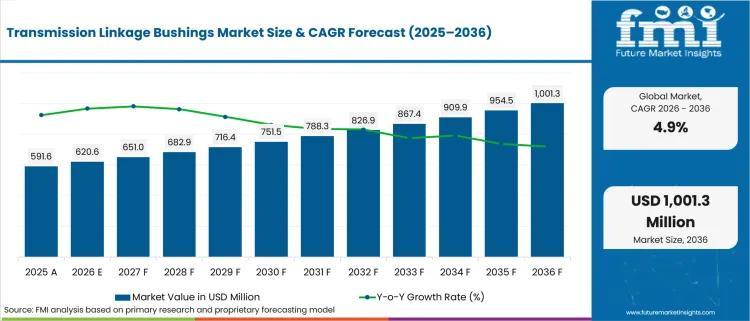
USD 620.6 million in 2026 and USD 1,001.3 million by 2036 at a 4.9% CAGR.
Aging vehicle fleets and repair-ticket economics are moving linkage service toward small bushing replacements instead of full cable assemblies. The International Organization of Motor Vehicle Manufacturers reported in April 2026 that global vehicle production reached 96.4 million units in 2025. That production base keeps OEM sourcing active and widens the future repair pool for small drivetrain interface parts. The adjacent transmission components market gives buyers a broader frame for gearbox-related service exposure.
OEM procurement teams and aftermarket distributors are the main buyers for transmission linkage bushings. Garage networks and fleet maintenance teams complete the buyer base. Their adoption is driven by fit accuracy, low repair cost and fewer repeat visits after a gear-selection complaint. The part creates value by restoring shift feel and cable-end retention at a lower ticket size than assembly replacement. Service baskets can include coolant and driveline checks across the automotive coolant aftermarket.
Regional adoption differs between production-oriented countries and service-oriented repair markets. China and India retain stronger OEM relevance. Japan and South Korea follow due to vehicle output. The United States and Western Europe lean more toward catalog depth and workshop availability. The related suspension bushings market shows why small polymer components can influence vehicle feel and service bills. The strategic buyer question is whether a supplier can combine material life, exact fitment and channel reach.
| Metric | Value |
|---|---|
| 2025 Market Size | USD 591.6 million |
| 2026 Market Size | USD 620.6 million |
| 2036 Market Size | USD 1,001.3 million |
| Forecast CAGR (2026-2036) | 4.9% |
| Leading Material | Rubber Bushings |
| Rubber Bushings Share (2026) | 57.6% |
| Leading Transmission Type | Automatic Transmission |
| Automatic Transmission Share (2026) | 52.4% |
| Leading Vehicle Type | Passenger Cars |
| Passenger Cars Share (2026) | 68.2% |
| Fastest-growing Country | India |
| India CAGR by 2036 | 5.8% |
Summary of the Transmission Linkage Bushings Market
| Market Signal | Commercial Impact |
|---|---|
| Demand and Growth Drivers | Demand for transmission linkage bushings is increasing as OEMs, aftermarket distributors, and repair workshops seek cost-effective solutions that restore shift quality without replacing complete cable assemblies.
|
| Product and Segment View | Rubber bushings, automatic transmission applications, and passenger cars continue to represent the leading commercial opportunities across the market.
|
| Geography and Growth Outlook | Asia and North America continue to support market growth through expanding vehicle production, aftermarket demand, and ongoing repair activity.
|
| Competitive Landscape | Competition increasingly focuses on material quality, vehicle fitment accuracy, aftermarket catalog coverage, and application-specific engineering.
|
| Analyst Perspective | Transmission linkage bushings are evolving from inexpensive molded components into critical service parts that improve shift performance, repair efficiency, and long-term drivetrain reliability.
- Nikhil Kaitwade, Principal Consultant at Future Market Insights |
How is the transmission linkage bushings market segmented?
The Transmission Linkage Bushings industry is segmented by material, transmission type, vehicle type, sales channel, application, and region.
The transmission linkage bushings market is segmented by material, transmission type, vehicle type, sales channel, application, and region. By material, the market covers rubber bushings, polyurethane bushings, nylon / engineering plastic and metal-reinforced bushings. By transmission type, it includes manual transmission, automatic transmission, DCT / AMT and commercial vehicle transmission. By vehicle type, demand covers passenger cars, light commercial vehicles, heavy commercial vehicles and off-highway / other vehicles. By sales channel, the market spans OEM and aftermarket. By application, coverage includes shift linkage, selector linkage and cable end / pivot joint. Regional coverage extends across North America, Europe, East Asia, South Asia and Pacific and other markets.
Why do Rubber Bushings matter within the material category?
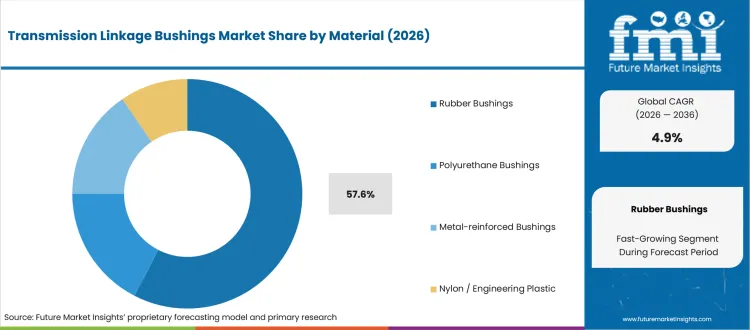
Passenger-car service teams need a bushing that restores shift feel without adding harshness. Rubber remains relevant due to its balance of compliance, damping and familiar OEM behavior. The material is also easier for distributors to explain to repair shops that want a direct replacement. This makes the segment more practical for routine failures than stiffer performance options. Material decisions also sit near the industrial rubber products market in buyer discussions.
- In 2026, Rubber Bushings are anticipated to hold 57.6% share of material demand, driven by buyer preference for factory-like movement and lower cabin vibration. Freudenberg reported EUR 579.5 million in 2025 research and development spending. That material-investment context supports supplier focus on validated polymer behavior.
- The workshop’s value is predictable repair quality: buyers gain a familiar feel and lower complaint risk after installation. Rubber parts also give distributors a simpler catalog story for older vehicles. The executive case is reduced return risk in small-ticket but high-volume service categories.
What supports demand for Automatic Transmission bushings?
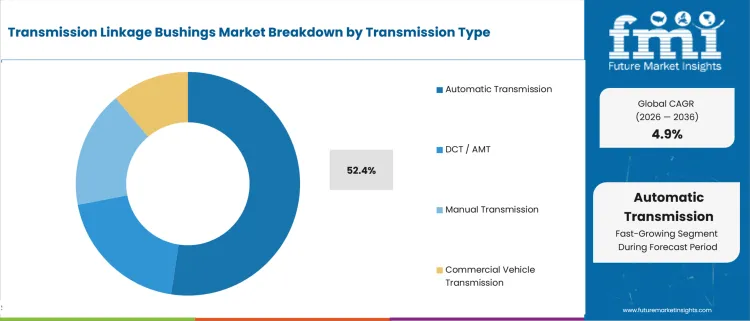
Automatic selector systems create a visible service problem after cable-end play reaches the driver. The issue is not only comfort but also the reliability of park selection and gear engagement. Buyers need replacement parts that fit the original linkage geometry. That need keeps automatic transmission bushings more visible in repair channels.
- Automatic Transmission is expected to account for 52.4% share in 2026, supported by selector cable repair exposure across passenger cars and light trucks. NHTSA recorded 44 incident complaints in its June 2025 recall query. That evidence shows why selector bushing condition can enter safety diagnostics.
- Fleet and retail buyers using automatic-selector bushing kits can reduce full cable replacement work. The value is clearest in vehicles showing loose shifter feel or park-position uncertainty. A correctly matched bushing restores the interface at a lower ticket value than assembly replacement.
How are Passenger Cars positioned within the vehicle type category?
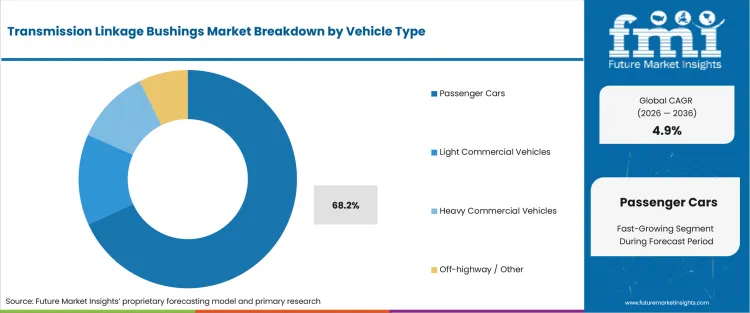
Passenger cars create wide exposure due to a large flow of vehicles from warranty service into independent repair channels. Small components become relevant after age, heat and repeated shift cycles affect linkage play. The segment is also broad enough to support vehicle-specific kits. This favors suppliers that map applications accurately across common car and SUV platforms.
- Passenger Cars are expected to hold 68.2% share in 2026, attributable to high repair exposure across older cars and SUVs. ACEA reported that battery-electric vehicles reached 17.4% of EU new car registrations in 2025. The mix change reinforces near-term service demand in combustion and hybrid fleets.
- The owner-value case is lower repair friction for a common drivability complaint. Passenger-car workshops benefit from parts that match model-year geometry and reduce trial-and-error fitting. Suppliers that support registration lookup and clear compatibility notes can improve installer confidence at the counter.
Why does Aftermarket demand hold a notable sales-channel position?
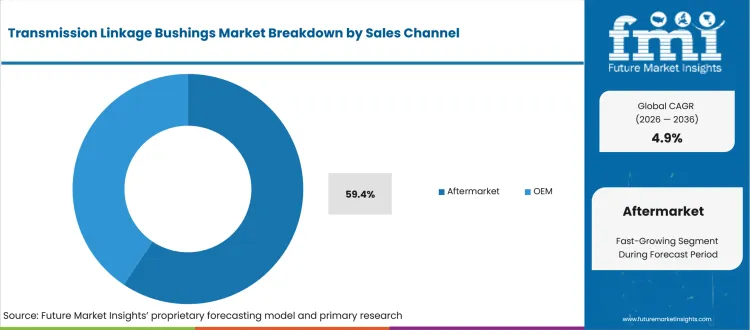
A failed linkage bushing often appears after the vehicle has left the original warranty cycle. Owners and independent garages then weigh a low-cost component against a larger cable replacement. The sales channel rewards catalog depth, price clarity and fast local availability. This is why the aftermarket remains central to the commercial case.
- Aftermarket is estimated to account for 59.4% share in 2026, driven by workshop preference for part-level repairs. Dorman annual reporting showed more than 20 new parts daily at year-end 2025. That product cadence supports a catalog model for small and application-specific repair components.
- For distributors, aftermarket bushings reduce missed sales caused by full-assembly reluctance. The channel value is practical: garages can complete a smaller repair and owners can avoid a larger bill. This makes packaging, application lookup and same-day availability central to supplier performance.
What makes Shift Linkage a meaningful application area?
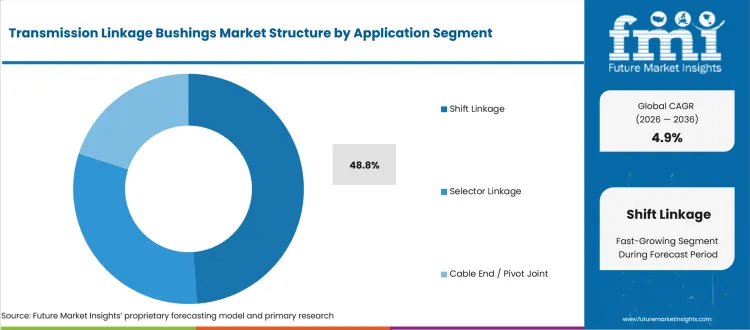
Shift linkage wear is noticed quickly due to direct changes in the way a driver feels gear selection. A loose lever or imprecise movement pushes workshops to inspect the cable end, pivot joint and selector path. The buyer need is a small part that solves a noticeable complaint. That makes the application a visible repair point.
- Shift Linkage holds 48.8% of application demand in 2026, reinforced by direct exposure to shifter looseness and gear engagement complaints. Dorman product literature for an OE FIX kit describes a retainer clip and three shift cable linkage bushings. This illustrates why application-specific repair kits are needed.
- The service value is first-time fit at the complaint location. Buyers in independent garages benefit from kits that identify the failed interface and avoid unnecessary cable replacement. Suppliers gain relevance by pairing molded-part quality and installation guidance that reduces repeat bay time.
What are the drivers, restraints, and opportunities in the transmission linkage bushings market?
Near-term purchases are being shaped by part-level repair economics, electric-platform content risk, and catalog-led aftermarket access outlined below.
- Driver: Part-level repair spending is driven by workshops that need lower-cost fixes for shifter looseness and selector cable play.
- Restraint: Long-term platform content risk is shaped by electric single-speed architectures that reduce conventional linkage complexity.
- Opportunity: Cataloged repair kits gain traction from e-commerce fitment tools and installer education in fragmented repair channels.
Workshop repair economics are expected to push more buyers toward bushing-level service during the forecast period. Dorman reported fiscal 2025 net sales of USD 2.13 billion in February 2026. The result reflects scale in aftermarket repair categories that depend on catalog reach and product availability. For linkage bushings, the supplier opportunity is to convert a small failed interface into a clearly packaged repair kit.
Platform transition creates a restraint for suppliers tied only to conventional transmission architecture. IEA data showed that the electric car share of global new car sales reached 25% in 2025. That mix shift reduces some future multi-gear linkage content. Better-positioned suppliers can offset the restraint by serving hybrid platforms, combustion-vehicle repair demand and specialty selector assemblies that remain in use. This creates a different comparison point for the EV transmission system market.
Aftermarket access is expected to widen for suppliers that combine fitment data and simple installer guidance. Dorman reported that China sourcing fell below 40% in 2025. The figure shows why supply diversification and application coverage can shape availability for small parts. Online parts lookup also connects linkage bushings to the automotive e-tailing market. Exact fitment can decide the order after a garage searches by vehicle application.
Which country CAGRs are profiled in the transmission linkage bushings market?
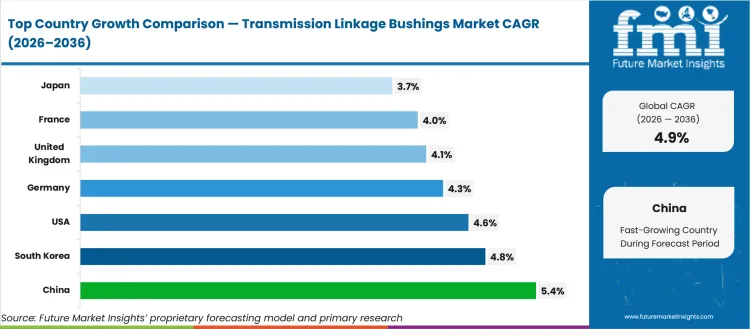
| Country | CAGR |
|---|---|
| United States | 4.6% |
| United Kingdom | 4.1% |
| Germany | 4.3% |
| France | 4.0% |
| Japan | 3.7% |
| China | 5.4% |
| South Korea | 4.8% |
| India | 5.8% |
How do country-level CAGRs compare in the transmission linkage bushings market?
Country CAGR variation should be read by examining production exposure, repair-channel maturity and transmission architecture. In production-oriented markets, the case is tied to OEM sourcing and future service pools. In service-oriented markets, demand is tied to vehicle age and catalog availability plus workshop behavior. The related chassis bushing and mount replacement parts market shows a similar dependence on repair access and exact fitment. For buyers, the country comparison helps decide whether supplier priority should center on production programs and aftermarket coverage or regional distribution partnerships.
- By 2036, the United States is projected to record 4.6% CAGR, driven by branded repair-kit availability and an older service pool. Dorman stated in its 2025 annual report that the average age of used vehicles was nearly 13 years. That age profile supports recurring small-part replacement and explains why the country leans toward aftermarket catalog coverage.
- The United Kingdom is expected to grow at 4.1% CAGR during the forecast period, supported by a large licensed vehicle base and independent garage reliance. The Department for Transport reported 42.3 million licensed vehicles at the end of 2025. This supports replacement demand even though local OEM production has a narrower role than in Germany or China.
- Over the assessment period, Germany is forecast to advance at 4.3% CAGR, attributable to precision OEM sourcing and exact-fit aftermarket expectations. OICA production statistics list Germany at 4.15 million vehicles in 2025. The figure supports a local component base that values validation, dimensional control and supplier documentation for selector-interface parts.
- Through 2036, France is anticipated to post 4.0% CAGR, shaped by compact-car repair demand and pricing discipline in independent garages. ACEA reported in February 2026 that petrol registrations in France fell 48.9% in January 2026. That powertrain shift places more pressure on suppliers to serve the existing combustion parc efficiently.
- Japan is likely to expand at 3.7% CAGR by 2036, influenced by quality expectations and lower early failure frequency. The USA International Trade Administration reported in November 2025 that Japan automotive-related activity employed 5.58 million people. That service and production ecosystem supports OE-style replacement parts and stricter validation expectations.
- China is estimated to rise at 5.4% CAGR between 2026 and 2036, propelled by scale in vehicle output and large service networks. IEA reported that more than 35% of China car exports were electric in 2025. The mix change creates long-term content risk but also leaves a large conventional and hybrid fleet for service demand.
- Demand in South Korea is projected to grow at 4.8% CAGR by 2036, supported by export-oriented production and concentrated OEM supply chains. OICA production data list South Korea at 4.1 million vehicles in 2025. This creates disciplined sourcing demand and makes supplier qualification more important than simple price competition.
- India is expected to expand at 5.8% CAGR during the forecast period, reinforced by production scale and economical repair behavior. SIAM reported passenger vehicle sales of 4.3 million units during April 2024 to March 2025. This profile supports bushing-only repairs in independent workshops and explains why India stands above other selected countries in CAGR terms.
Who are the notable companies in the transmission linkage bushings market?
Dorman Products, Freudenberg / Vibracoustic, Trelleborg, Sumitomo Riko, Hutchinson, febi Bilstein, MEYLE, URO Parts, Vaico / VIEROL and Febest are the notable companies shaping this market.
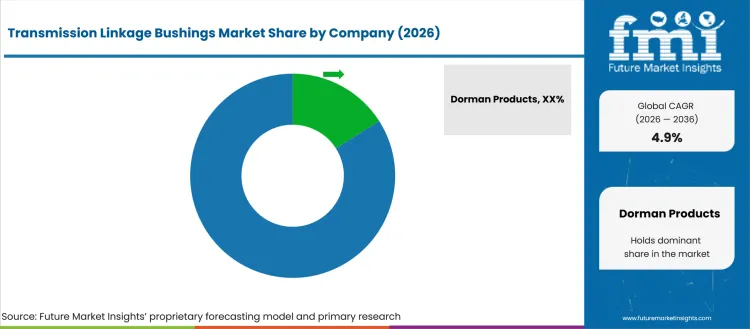
Supplier positioning is split between catalog-led aftermarket brands and polymer-focused component groups. Aftermarket brands are more relevant for repair kits, exact vehicle lookup and counter availability. Elastomer suppliers become more relevant for material validation, damping behavior and OEM-style durability. Adjacent service categories including the transmission filter market also shape buyer expectations for precise fitment and routine service bundling. The buyer decision is therefore less about a generic bushing and more about who can solve the failed interface at the right channel layer.
- Dorman Products and aftermarket specialists address buyers that need vehicle-specific kits and repair-counter availability. Their relevance is driven by catalog depth, installer familiarity and part-level repair economics. This group fits independent garages that need a low-cost option before recommending full cable replacement.
- Freudenberg / Vibracoustic and Sumitomo Riko fit OEM-oriented buyers that need polymer knowledge and vibration-control experience. Their role is supported by material validation and adjacent elastomer systems. These suppliers matter more for programs that require predictable shift feel and long service life.
- Trelleborg and Hutchinson are relevant for buyers evaluating engineered rubber, coated materials and adjacent automotive polymer capability. Their competitive role is shaped by technical familiarity instead of direct aftermarket kit breadth. This group fits sourcing teams that assess heat, fluid and durability exposure.
- European and import-vehicle brands serve distributor-led repair demand across many vehicle applications. Their value is tied to replacement-part coverage and channel access. Buyers use these brands for model-specific availability that outweighs deeper material engineering support.
Competitive Benchmarking: Transmission Linkage Bushings Market
| Company | Fitment Coverage | Material Depth | Channel Access | Service Reach |
|---|---|---|---|---|
| Dorman Products | High | Medium | High | North America |
| Freudenberg / Vibracoustic | Medium | Strong | Medium | Global |
| Trelleborg | Medium | Strong | Medium | Global |
| Sumitomo Riko | Medium | Strong | Medium | Japan / Global |
| Hutchinson | Medium | Strong | Medium | Europe / Global |
| febi Bilstein | High | Medium | High | Europe / Global |
| MEYLE | High | Medium | High | Europe / Global |
| URO Parts | Medium | Medium | Medium | North America |
| Vaico / VIEROL | Medium | Medium | High | Europe |
| Febest | Medium | Medium | Medium | Regional |
Source: Future Market Insights competitive analysis, 2026. Ratings reflect relative portfolio relevance, workflow or project fit, service capability, and geographic reach.
Key Developments in the Transmission Linkage Bushings Market
- In February 2026, Dorman Products reported fiscal 2025 results and listed more than 144K products at year-end. The action matters to linkage bushing buyers due to broad catalog coverage that supports exact application lookup. The market implication is deeper aftermarket access for small repair parts.
- In May 2026, Sumitomo Riko announced Automotive Engineering Exposition 2026 exhibits that include automotive anti-vibration rubber and eAxle mounts. The development matters due to its polymer and mobility component focus. The market implication is continued relevance for suppliers that connect rubber expertise to evolving vehicle architectures.
- In February 2026, Trelleborg introduced extrusion coating capability for polymer solutions and planned a dedicated North Carolina facility in Q2 2026. The action matters to automotive buyers evaluating protective polymer layers. The market implication is faster prototyping and broader material options for adjacent small component applications.
Key Players in the Transmission Linkage Bushings Market
Aftermarket Repair-Kit Specialists
- Dorman Products
- febi Bilstein
- MEYLE
- URO Parts
- Vaico / VIEROL
- Febest
Elastomer and Vibration-Control Suppliers
- Freudenberg / Vibracoustic
- Trelleborg
- Sumitomo Riko
- Hutchinson
Transmission Linkage Bushings Market - Report Scope
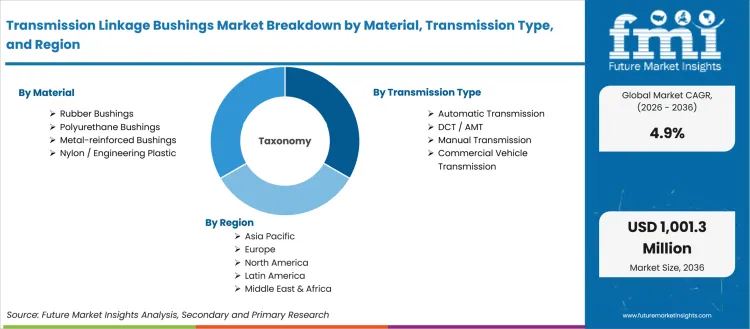
| Coverage field | Report scope |
|---|---|
| Market breakdown | Transmission Linkage Bushings Market Breakdown By Material, Transmission Type, Vehicle Type, Sales Channel, Application and Region |
| Market Definition | Transmission linkage bushings are molded or reinforced components that reduce play at shift levers, selector arms, cable ends and pivot joints. |
| Regions Covered | North America, Europe, East Asia, South Asia and Pacific, Latin America, Middle East and Africa |
| Countries Covered | United States, United Kingdom, Germany, France, Japan, China, South Korea, India and broader regional coverage |
| Key Companies Profiled | Dorman Products, Freudenberg / Vibracoustic, Trelleborg, Sumitomo Riko, Hutchinson, febi Bilstein, MEYLE, URO Parts, Vaico / VIEROL, Febest |
| Forecast Period | 2026 to 2036 |
| Approach | Hybrid bottom-up and top-down methodology using vehicle parc exposure, repair incidence, fitment coverage, channel structure and transmission mix |
Transmission Linkage Bushings Market - Research Methodology
| Method | Approach |
|---|---|
| Primary Research | FMI analysts reviewed inputs from aftermarket distributors, garage networks, tier suppliers, polymer compounders and drivetrain service specialists. Discussions focused on bushing failure triggers, kit-level buying behavior, fitment coverage and sales-channel margins. |
| Desk Research | Desk research covered vehicle production data, safety recall documents, official company pages, annual reports, trade association releases and technical product references. Evidence was used to define the addressable pool across linkage assemblies and adjacent service parts. |
| Market Sizing and Forecasting | The model combined vehicle parc exposure, transmission mix, repair incidence, unit pricing, OEM fitment rates and aftermarket replacement behavior. Country-level adjustments reflected production scale, fleet age, workshop structure and transmission preferences. |
| Data Validation | Forecasts were checked against automotive component demand, replacement-part catalog depth, recall behavior and supplier product coverage. Duplicate external statistics were removed so each evidence point supported one section only. |
Transmission Linkage Bushings Market by Segments
Transmission Linkage Bushings Market segmented by Material:
- Rubber Bushings
- Polyurethane Bushings
- Nylon / Engineering Plastic
- Metal-reinforced Bushings
Transmission Linkage Bushings Market segmented by Transmission Type:
- Manual Transmission
- Automatic Transmission
- DCT / AMT
- Commercial Vehicle Transmission
Transmission Linkage Bushings Market segmented by Vehicle Type:
- Passenger Cars
- Light Commercial Vehicles
- Heavy Commercial Vehicles
- Off-highway / Other
Transmission Linkage Bushings Market segmented by Sales Channel:
- OEM
- Aftermarket
Transmission Linkage Bushings Market segmented by Application:
- Shift Linkage
- Selector Linkage
- Cable End / Pivot Joint
Transmission Linkage Bushings Market by Region:
- North America
- United States
- Canada
- Europe
- United Kingdom
- Germany
- France
- Italy
- Spain
- Rest of Europe
- East Asia
- China
- Japan
- South Korea
- South Asia and Pacific
- India
- ASEAN
- Australia and New Zealand
- Rest of South Asia and Pacific
- Latin America
- Brazil
- Mexico
- Rest of Latin America
- Middle East and Africa
- GCC Countries
- South Africa
- Rest of Middle East and Africa
Research Sources and Bibliography
- International Organization of Motor Vehicle Manufacturers. (2026, April 23). Auto industry growth shifted east in 2025 amid global repositioning. OICA.
- International Organization of Motor Vehicle Manufacturers. (2026). Production statistics. OICA.
- National Highway Traffic Safety Administration. (2025, June 30). ODI resume: RQ25-002. NHTSA.
- International Energy Agency. (2026, May). Trends in electric cars: Global EV Outlook 2026. IEA.
- Department for Transport. (2026, April 29). Vehicle licensing statistics, United Kingdom: 2025. UK Department for Transport.
- Society of Indian Automobile Manufacturers. (2025, April 15). Auto industry performance of March 2025. SIAM.
- European Automobile Manufacturers’ Association. (2026, January 27). New car registrations: +1.8% in 2025; battery-electric 17.4% market share. ACEA.
- European Automobile Manufacturers’ Association. (2026, February 24). New car registrations: -3.9% in January 2026; battery-electric 19.3% market share. ACEA.
- U.S. International Trade Administration. (2025, November 20). Japan - Automotive.
- China Daily. (2026, January 19). Automotive industry in China holds No 1 spot.
- Dorman Products, Inc. (2026, February 25). Dorman Products, Inc. reports fourth quarter and full year 2025 results; issues 2026 guidance.
- Dorman Products, Inc. (2026, February 27). 2025 annual report.
- Dorman Products, Inc. (2025, accessed from official product catalog). Auto Transmission Shift Linkage Bushing | 14110.
- Freudenberg Group. (2026, March 30). Freudenberg presents financials for 2025.
- Sumitomo Riko Company Limited. (2026, May). Sumitomo Riko exhibits at the Automotive Engineering Exposition 2026.
This bibliography is provided for reader reference and uses primary government sources plus standards-body, official trade body and company sources.
This Report Answers
- What is the market value of transmission linkage bushings in 2026 and by 2036?
- What CAGR is expected for the Transmission Linkage Bushings Market from 2026 to 2036?
- Which material segment has a notable share in 2026?
- Which transmission type is meaningfully positioned in 2026 demand?
- Why does aftermarket demand account for a notable sales-channel share in 2026?
- How do electric and hybrid platforms affect long-term linkage bushing demand?
- Which countries are profiled for CAGR comparison in this market?
- Which companies compete across aftermarket kits and elastomer supply?
- What products are included in this transmission linkage bushing scope?
- How does FMI size this small automotive component category?
Frequently Asked Questions
Why should executives track the Transmission Linkage Bushings Market?
Executives should track this market because small linkage bushings directly affect shift feel repair cost and customer satisfaction across large passenger car fleets.
What business problem does the Transmission Linkage Bushings Market address?
It restores precise gear selection by reducing play and wear at linkage interfaces without requiring full cable or assembly replacement.
What should procurement leaders evaluate before selecting suppliers?
Procurement leaders should evaluate material durability exact fitment coverage aging performance catalog accuracy and channel availability.
What can limit return on investment for buyers?
Return on investment can be limited by poor fitment inconsistent material quality and repeat workshop visits caused by premature wear.
How can suppliers build executive confidence?
Suppliers build confidence by delivering OEM like shift feel validated rubber compounds clear application data and reliable aftermarket availability.
Preview the report firsthand - request a free sample
Get SampleGet the brochure for pricing and purchase details.
Get PDFTable of Content
- Key Takeaways
- Market Size and CAGR
- Top Growth Driver
- Fastest Growing Segment
- Leading Region
- Key Companies
- Emerging Opportunities
- Executive Summary
- Global Market Outlook
- Demand-side Trends
- Supply-side Trends
- Technology Roadmap Analysis
- Analysis and Recommendations
- Analyst Perspective (What is happening? Why now? What should investors know?)
- Key Questions Answered
- How large is the market?
- What is the CAGR?
- What are key trends?
- Which region dominates?
- Who are the leaders?
- Market Overview
- Market Coverage / Taxonomy
- Market Definition / Scope / Limitations
- Research Methodology
- Chapter Orientation
- Analytical Lens and Working Hypotheses
- Market Structure, Signals, and Trend Drivers
- Benchmarking and Cross-market Comparability
- Market Sizing, Forecasting, and Opportunity Mapping
- Research Design and Evidence Framework
- Desk Research Programme (Secondary Evidence)
- Expert Input and Fieldwork (Primary Evidence)
- Tooling, Models, and Reference Databases
- Data Engineering and Model Build
- Quality Assurance and Audit Trail
- Market Background
- Market Dynamics (Drivers, Restraints, Opportunity, Trends)
- Scenario Forecast (Optimistic, Likely, Conservative)
- Impact Analysis
- AI Impact
- Sustainability Impact
- Regulatory Impact
- Technology Impact
- Consumer / Buyer Analysis
- Purchase Drivers
- Adoption Barriers
- Buyer Journey
- Opportunity Map Analysis
- Product Life Cycle Analysis
- Supply Chain Analysis
- Investment Feasibility Matrix
- Value Chain Analysis
- PESTLE and Porter's Analysis
- Regulatory Landscape
- Regional Parent Market Outlook
- Production and Consumption Statistics
- Import and Export Statistics
- Global Market Analysis and Forecast, 2021 to 2036
- Historical Market Size Value (USD Million) & Volume (Unit) Analysis, 2021 to 2025
- Current and Future Market Size Value (USD Million) & Volume (Unit) Projections, 2026 to 2036
- Y-o-Y Growth Trend Analysis
- Absolute $ Opportunity Analysis
- Global Market Pricing Analysis, 2021 to 2036
- Global Market Analysis and Forecast, By Material, 2021 to 2036
- Introduction / Key Findings
- Historical Market Size Value (USD Million) & Volume (Unit) Analysis By Material, 2021 to 2025
- Current and Future Market Size Value (USD Million) & Volume (Unit) Analysis and Forecast By Material, 2026 to 2036
- Rubber Bushings
- Polyurethane Bushings
- Metal-reinforced Bushings
- Nylon / Engineering Plastic
- Rubber Bushings
- Y-o-Y Growth Trend Analysis By Material, 2021 to 2025
- Absolute $ Opportunity Analysis By Material, 2026 to 2036
- Global Market Analysis and Forecast, By Transmission Type, 2021 to 2036
- Introduction / Key Findings
- Historical Market Size Value (USD Million) & Volume (Unit) Analysis By Transmission Type, 2021 to 2025
- Current and Future Market Size Value (USD Million) & Volume (Unit) Analysis and Forecast By Transmission Type, 2026 to 2036
- Automatic Transmission
- DCT / AMT
- Manual Transmission
- Commercial Vehicle Transmission
- Automatic Transmission
- Y-o-Y Growth Trend Analysis By Transmission Type, 2021 to 2025
- Absolute $ Opportunity Analysis By Transmission Type, 2026 to 2036
- Global Market Analysis and Forecast, By Vehicle Type, 2021 to 2036
- Introduction / Key Findings
- Historical Market Size Value (USD Million) & Volume (Unit) Analysis By Vehicle Type, 2021 to 2025
- Current and Future Market Size Value (USD Million) & Volume (Unit) Analysis and Forecast By Vehicle Type, 2026 to 2036
- Passenger Cars
- Light Commercial Vehicles
- Heavy Commercial Vehicles
- Off-highway / Other
- Passenger Cars
- Y-o-Y Growth Trend Analysis By Vehicle Type, 2021 to 2025
- Absolute $ Opportunity Analysis By Vehicle Type, 2026 to 2036
- Global Market Analysis and Forecast, By Sales Channel, 2021 to 2036
- Introduction / Key Findings
- Historical Market Size Value (USD Million) & Volume (Unit) Analysis By Sales Channel, 2021 to 2025
- Current and Future Market Size Value (USD Million) & Volume (Unit) Analysis and Forecast By Sales Channel, 2026 to 2036
- Aftermarket
- OEM
- Aftermarket
- Y-o-Y Growth Trend Analysis By Sales Channel, 2021 to 2025
- Absolute $ Opportunity Analysis By Sales Channel, 2026 to 2036
- Global Market Analysis and Forecast, By Application, 2021 to 2036
- Introduction / Key Findings
- Historical Market Size Value (USD Million) & Volume (Unit) Analysis By Application, 2021 to 2025
- Current and Future Market Size Value (USD Million) & Volume (Unit) Analysis and Forecast By Application, 2026 to 2036
- Shift Linkage
- Selector Linkage
- Cable End / Pivot Joint
- Shift Linkage
- Y-o-Y Growth Trend Analysis By Application, 2021 to 2025
- Absolute $ Opportunity Analysis By Application, 2026 to 2036
- Global Market Analysis and Forecast, By Region, 2021 to 2036
- Introduction
- Historical Market Size Value (USD Million) & Volume (Unit) Analysis By Region, 2021 to 2025
- Current Market Size Value (USD Million) & Volume (Unit) Analysis and Forecast By Region, 2026 to 2036
- North America
- Latin America
- Western Europe
- Eastern Europe
- East Asia
- South Asia and Pacific
- Middle East & Africa
- Market Attractiveness Analysis By Region
- North America Market Analysis and Forecast, By Country, 2021 to 2036
- Historical Market Size Value (USD Million) & Volume (Unit) Trend Analysis By Market Taxonomy, 2021 to 2025
- Market Size Value (USD Million) & Volume (Unit) Forecast By Market Taxonomy, 2026 to 2036
- By Country
- USA
- Canada
- Mexico
- By Material
- By Transmission Type
- By Vehicle Type
- By Sales Channel
- By Application
- By Country
- Market Attractiveness Analysis
- By Country
- By Material
- By Transmission Type
- By Vehicle Type
- By Sales Channel
- By Application
- Key Takeaways
- Latin America Market Analysis and Forecast, By Country
- Historical Market Size Value (USD Million) & Volume (Unit) Trend Analysis By Market Taxonomy, 2021 to 2025
- Market Size Value (USD Million) & Volume (Unit) Forecast By Market Taxonomy, 2026 to 2036
- By Country
- Brazil
- Chile
- Rest of Latin America
- By Material
- By Transmission Type
- By Vehicle Type
- By Sales Channel
- By Application
- By Country
- Market Attractiveness Analysis
- By Country
- By Material
- By Transmission Type
- By Vehicle Type
- By Sales Channel
- By Application
- Key Takeaways
- Western Europe Market Analysis and Forecast, By Country
- Historical Market Size Value (USD Million) & Volume (Unit) Trend Analysis By Market Taxonomy, 2021 to 2025
- Market Size Value (USD Million) & Volume (Unit) Forecast By Market Taxonomy, 2026 to 2036
- By Country
- Germany
- UK
- Italy
- Spain
- France
- Nordic
- BENELUX
- Rest of Western Europe
- By Material
- By Transmission Type
- By Vehicle Type
- By Sales Channel
- By Application
- By Country
- Market Attractiveness Analysis
- By Country
- By Material
- By Transmission Type
- By Vehicle Type
- By Sales Channel
- By Application
- Key Takeaways
- Eastern Europe Market Analysis and Forecast, By Country
- Historical Market Size Value (USD Million) & Volume (Unit) Trend Analysis By Market Taxonomy, 2021 to 2025
- Market Size Value (USD Million) & Volume (Unit) Forecast By Market Taxonomy, 2026 to 2036
- By Country
- Russia
- Poland
- Hungary
- Balkan & Baltic
- Rest of Eastern Europe
- By Material
- By Transmission Type
- By Vehicle Type
- By Sales Channel
- By Application
- By Country
- Market Attractiveness Analysis
- By Country
- By Material
- By Transmission Type
- By Vehicle Type
- By Sales Channel
- By Application
- Key Takeaways
- East Asia Market Analysis and Forecast, By Country
- Historical Market Size Value (USD Million) & Volume (Unit) Trend Analysis By Market Taxonomy, 2021 to 2025
- Market Size Value (USD Million) & Volume (Unit) Forecast By Market Taxonomy, 2026 to 2036
- By Country
- China
- Japan
- South Korea
- By Material
- By Transmission Type
- By Vehicle Type
- By Sales Channel
- By Application
- By Country
- Market Attractiveness Analysis
- By Country
- By Material
- By Transmission Type
- By Vehicle Type
- By Sales Channel
- By Application
- Key Takeaways
- South Asia and Pacific Market Analysis and Forecast, By Country
- Historical Market Size Value (USD Million) & Volume (Unit) Trend Analysis By Market Taxonomy, 2021 to 2025
- Market Size Value (USD Million) & Volume (Unit) Forecast By Market Taxonomy, 2026 to 2036
- By Country
- India
- ASEAN
- Australia & New Zealand
- Rest of South Asia and Pacific
- By Material
- By Transmission Type
- By Vehicle Type
- By Sales Channel
- By Application
- By Country
- Market Attractiveness Analysis
- By Country
- By Material
- By Transmission Type
- By Vehicle Type
- By Sales Channel
- By Application
- Key Takeaways
- Middle East & Africa Market Analysis and Forecast, By Country
- Historical Market Size Value (USD Million) & Volume (Unit) Trend Analysis By Market Taxonomy, 2021 to 2025
- Market Size Value (USD Million) & Volume (Unit) Forecast By Market Taxonomy, 2026 to 2036
- By Country
- Kingdom of Saudi Arabia
- Other GCC Countries
- Türkiye
- South Africa
- Other African Union
- Rest of Middle East & Africa
- By Material
- By Transmission Type
- By Vehicle Type
- By Sales Channel
- By Application
- By Country
- Market Attractiveness Analysis
- By Country
- By Material
- By Transmission Type
- By Vehicle Type
- By Sales Channel
- By Application
- Key Takeaways
- Key Countries Market Analysis
- USA
- Pricing Analysis
- Market Share Analysis, 2025
- By Material
- By Transmission Type
- By Vehicle Type
- By Sales Channel
- By Application
- Canada
- Pricing Analysis
- Market Share Analysis, 2025
- By Material
- By Transmission Type
- By Vehicle Type
- By Sales Channel
- By Application
- Mexico
- Pricing Analysis
- Market Share Analysis, 2025
- By Material
- By Transmission Type
- By Vehicle Type
- By Sales Channel
- By Application
- Brazil
- Pricing Analysis
- Market Share Analysis, 2025
- By Material
- By Transmission Type
- By Vehicle Type
- By Sales Channel
- By Application
- Chile
- Pricing Analysis
- Market Share Analysis, 2025
- By Material
- By Transmission Type
- By Vehicle Type
- By Sales Channel
- By Application
- Germany
- Pricing Analysis
- Market Share Analysis, 2025
- By Material
- By Transmission Type
- By Vehicle Type
- By Sales Channel
- By Application
- UK
- Pricing Analysis
- Market Share Analysis, 2025
- By Material
- By Transmission Type
- By Vehicle Type
- By Sales Channel
- By Application
- Italy
- Pricing Analysis
- Market Share Analysis, 2025
- By Material
- By Transmission Type
- By Vehicle Type
- By Sales Channel
- By Application
- Spain
- Pricing Analysis
- Market Share Analysis, 2025
- By Material
- By Transmission Type
- By Vehicle Type
- By Sales Channel
- By Application
- France
- Pricing Analysis
- Market Share Analysis, 2025
- By Material
- By Transmission Type
- By Vehicle Type
- By Sales Channel
- By Application
- India
- Pricing Analysis
- Market Share Analysis, 2025
- By Material
- By Transmission Type
- By Vehicle Type
- By Sales Channel
- By Application
- ASEAN
- Pricing Analysis
- Market Share Analysis, 2025
- By Material
- By Transmission Type
- By Vehicle Type
- By Sales Channel
- By Application
- Australia & New Zealand
- Pricing Analysis
- Market Share Analysis, 2025
- By Material
- By Transmission Type
- By Vehicle Type
- By Sales Channel
- By Application
- China
- Pricing Analysis
- Market Share Analysis, 2025
- By Material
- By Transmission Type
- By Vehicle Type
- By Sales Channel
- By Application
- Japan
- Pricing Analysis
- Market Share Analysis, 2025
- By Material
- By Transmission Type
- By Vehicle Type
- By Sales Channel
- By Application
- South Korea
- Pricing Analysis
- Market Share Analysis, 2025
- By Material
- By Transmission Type
- By Vehicle Type
- By Sales Channel
- By Application
- Russia
- Pricing Analysis
- Market Share Analysis, 2025
- By Material
- By Transmission Type
- By Vehicle Type
- By Sales Channel
- By Application
- Poland
- Pricing Analysis
- Market Share Analysis, 2025
- By Material
- By Transmission Type
- By Vehicle Type
- By Sales Channel
- By Application
- Hungary
- Pricing Analysis
- Market Share Analysis, 2025
- By Material
- By Transmission Type
- By Vehicle Type
- By Sales Channel
- By Application
- Kingdom of Saudi Arabia
- Pricing Analysis
- Market Share Analysis, 2025
- By Material
- By Transmission Type
- By Vehicle Type
- By Sales Channel
- By Application
- Türkiye
- Pricing Analysis
- Market Share Analysis, 2025
- By Material
- By Transmission Type
- By Vehicle Type
- By Sales Channel
- By Application
- South Africa
- Pricing Analysis
- Market Share Analysis, 2025
- By Material
- By Transmission Type
- By Vehicle Type
- By Sales Channel
- By Application
- USA
- Market Structure Analysis
- Competition Dashboard
- Competition Benchmarking
- Market Share Analysis of Top Players
- By Regional
- By Material
- By Transmission Type
- By Vehicle Type
- By Sales Channel
- By Application
- Emerging Startups
- Innovation Benchmarking
- Competition Analysis
- Competition Deep Dive
- Dorman Products
- Overview
- Product Portfolio
- Profitability by Market Segments (Product/Region/Sales Channel)
- Sales Footprint
- Strategy Overview
- Marketing Strategy
- Product Strategy
- Channel Strategy
- febi Bilstein
- MEYLE
- URO Parts
- Vaico / VIEROL
- Febest
- Dorman Products
- Case Studies
- Success Stories
- Recent Developments
- Competition Deep Dive
- Assumptions & Acronyms Used


