

- Market Size (2026)
- USD 1240.7 Mn
- Forecast (2036)
- USD 2139.5 Mn
- CAGR (2026 to 2036)
- 5.6%
How big is the Transmission Range Sensors Market in 2026?
USD 1,240.7 million in 2026 and USD 2,139.5 million by 2036 at a 5.6% CAGR.
Automatic selector confirmation is shifting from a small switch function to a control signal that affects start authorization and shift readiness. Vehicle makers need the selected state to be read accurately before the drivetrain can accept torque. OICA reported global vehicle production at 96.4 million units in 2025, which keeps the addressable build base broad for range sensing. This supports demand for sealed contactless designs and diagnostic-ready outputs. Suppliers therefore compete on signal repeatability, connector fit and validation history instead of unit price alone. This pattern sits within broader automotive sensors sourcing.
OEM buyers remain the main revenue source due to range sensors being engineered into transmission modules and electronic shifter assemblies. Tier-one transmission suppliers evaluate thermal resistance and oil exposure before platform release. They also check vibration tolerance and software compatibility. Repair networks buy the same function differently. They need exact vehicle coverage and parts that solve no-start faults or wrong gear recognition quickly. The market creates value by reducing warranty risk for OEMs and by shortening diagnosis time for service channels. Adjacent transmission shift actuator procurement follows the same control-signal discipline.
Established vehicle markets show replacement pull from aging automatic fleets. High-growth countries show wider new fitment from automatic, hybrid and EV platforms. The product gains strategic value once it connects selector hardware to transmission control logic. It also links diagnostic software and service catalog data. Buyers should therefore evaluate the sensor as part of the drivetrain control chain. This framing also explains why adjacent electric vehicle sensor demand and steering position sensor sourcing matter to control-unit decisions.
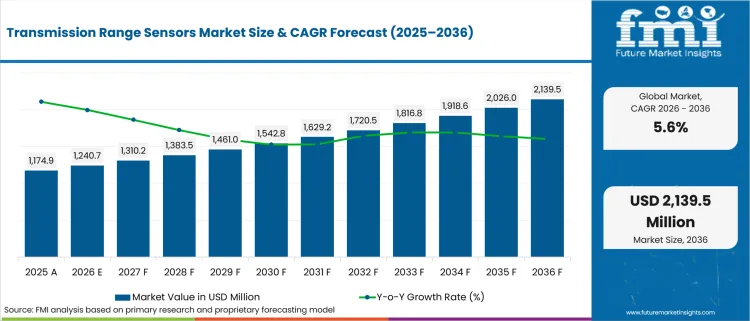
| Metric | Value |
|---|---|
| 2025 Market Size | USD 1,174.9 million |
| 2026 Market Size | USD 1,240.7 million |
| 2036 Market Size | USD 2,139.5 million |
| Forecast CAGR (2026-2036) | 5.6% |
| Leading Sensor Type | Hall-effect Range Sensors |
| Hall-effect Range Sensors Share (2026) | 46.0% |
| Leading Transmission Type | Automatic Transmission |
| Automatic Transmission Share (2026) | 57.0% |
| Leading Vehicle Type | Passenger Cars |
| Passenger Cars Share (2026) | 68.0% |
| Fastest-growing Country | China |
| China CAGR by 2036 | 6.8% |
Summary of the Transmission Range Sensors Market
| Market Signal | Commercial Impact |
|---|---|
| Demand and Growth Drivers | Demand for transmission range sensors is increasing as OEMs and aftermarket suppliers prioritize accurate gear-position sensing, drivetrain safety, and reliable shift-by-wire operation.
|
| Product and Segment View | Hall-effect range sensors, automatic transmissions, and passenger cars continue to represent the leading commercial opportunities across the market.
|
| Geography and Growth Outlook | Asia and North America continue to support market growth through expanding vehicle production, drivetrain electrification, and increasing automatic transmission adoption.
|
| Competitive Landscape | Competition increasingly focuses on sensing accuracy, environmental durability, OEM validation, application coverage, and aftermarket support.
|
| Analyst Perspective | Transmission range sensors are evolving from basic transmission components into critical drivetrain sensing technologies that improve vehicle safety, shift accuracy, and transmission reliability.
- Nikhil Kaitwade, Principal Consultant at Future Market Insights |
How is the transmission range sensors market segmented?
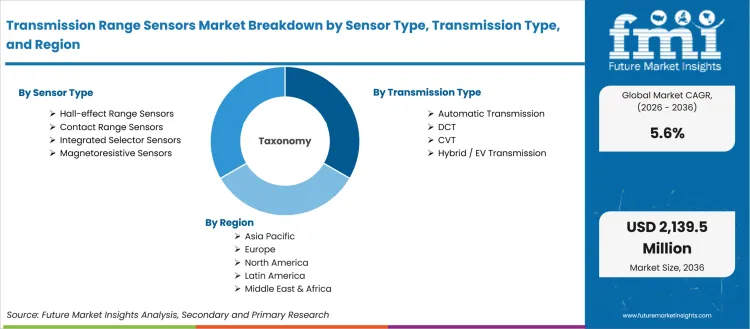
The Transmission Range Sensors industry is segmented by sensor type, transmission type, vehicle type, sales channel, output type, and region.
The transmission range sensors market is segmented by sensor type, transmission type, vehicle type, sales channel, output type and region. Sensor type covers contact range sensors, Hall-effect range sensors, magnetoresistive sensors and integrated selector sensors. Transmission type includes automatic transmission, DCT, CVT and hybrid or EV transmission. Vehicle type spans passenger cars, light commercial vehicles, commercial vehicles and EVs or hybrids. Sales channel includes OEM and aftermarket routes. Output type covers analog, digital and CAN or LIN signals. Regional coverage extends across North America, Latin America, Europe, East Asia, South Asia and Pacific and the Middle East and Africa.
Why do Hall-effect Range Sensors matter within the sensor type category?
OEM engineers need selector feedback that survives oil, heat and vibration without physical contact wear. Contactless magnetic sensing fits this problem because the sensing element can sit inside sealed housings. The buyer issue is not only detecting the selector position. The signal also needs to remain stable after repeated movement and long temperature exposure.
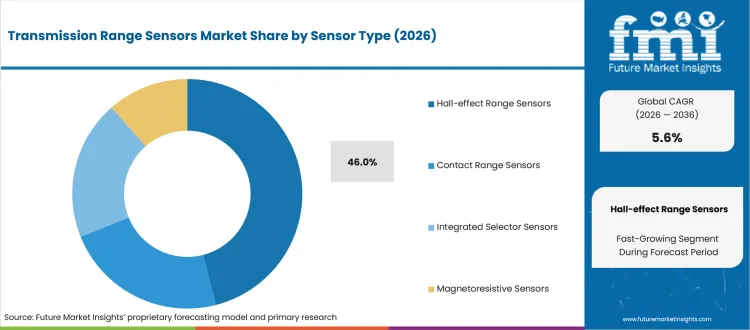
- Hall-effect Range Sensors are anticipated to hold 46.0% of sensor type demand in 2026, supported by non-contact measurement in sealed transmission spaces. TE Connectivity states that its 3D Hall position sensor monitors movement in ICE and xEV platforms. This supports buyer preference for magnetic designs in compact drivetrain packages.
- Engineering value comes from lower wear risk and cleaner signal behavior. OEMs using Hall-effect designs can reduce dependence on exposed mechanical contacts. This helps platform teams protect range confirmation performance once sensor assemblies sit near oil, heat and moving transmission parts.
What supports demand for Automatic Transmission applications?
Automatic platforms keep range sensors close to the safety chain. PRNDL states affect starter logic and reverse lamp operation. They also influence rollaway prevention. The specification issue is therefore tied to system behavior rather than a simple dashboard indication. That makes validated range sensing necessary for both new platforms and service replacement.
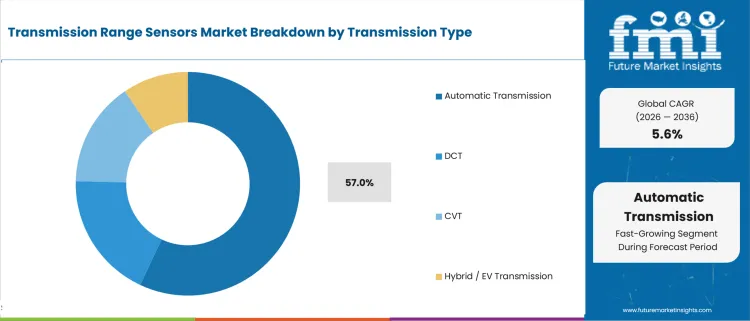
- Automatic Transmission is expected to account for 57.0% share in 2026, driven by continued PRNDL feedback requirements across passenger and light commercial vehicles. The eCFR standard for FMVSS No. 102 specifies starter interlock requirements for automatic transmissions. This keeps range confirmation tied to regulated control logic.
- The buyer value is fewer ambiguous shift states. OEMs and repair networks both benefit once the selected range is reported clearly to the control unit. This reduces no-start complaints, wrong gear display issues and repeated diagnostic visits for intermittent selector signals.
How are Passenger Cars positioned within the vehicle type category?
Passenger car platforms provide a significant fitment pool inside the target scope. Automatic and electrified variants rely on clear selector confirmation before propulsion or park release. The segment is commercially important because platform volume lets a small sensor become meaningful revenue. It also creates a broad replacement base after vehicles age.
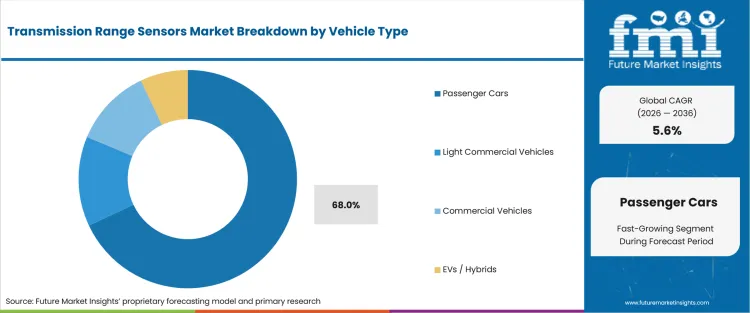
- Passenger Cars represent 68.0% of vehicle type demand in 2026, attributable to model volume and broad use of automatic selector logic. OICA reported global vehicle sales of 99.8 million units in 2025. That market scale keeps passenger vehicle fitment central to sensor revenue models.
- For vehicle program managers, passenger car demand reduces sourcing tolerance for unstable output. A sensor defect can affect thousands of units across shared platforms. This makes validation records and consistent connector geometry more valuable than low quoted part cost. Adjacent automotive position sensors procurement shows the same need for stable signal geometry.
What makes OEM the central sales channel?
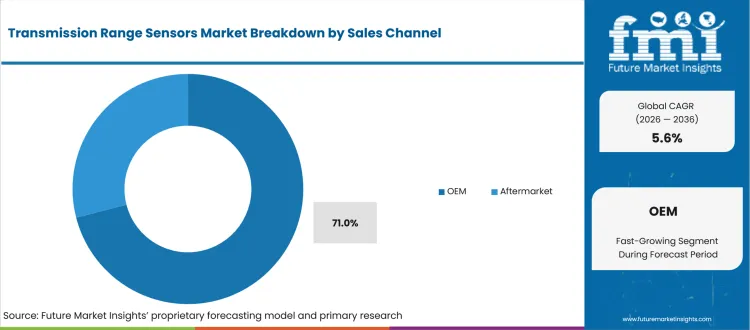
Range sensors are usually chosen before vehicle launch and validated alongside the transmission control unit. OEM sourcing teams need documentation, test evidence and clear integration support. Aftermarket demand is visible but follows the installed base. This channel split makes early design-in access the main route for suppliers seeking high-volume programs.
- OEM is projected to represent 71.0% of sales channel demand in 2026, led by factory-installed validation needs. Bosch stated in September 2025 that it made its VASI bus interface available for automotive sensor use. The development points to more structured sensor integration around vehicle electronics.
- The commercial value for suppliers is platform lock-in after validation. OEM approval can support years of production and service demand. The same approval also raises entry barriers for replacement brands that lack original fitment data and connector-specific coverage. Broader connected sensors planning depends on interface discipline across vehicle electronics.
How do buyers evaluate Digital output products?
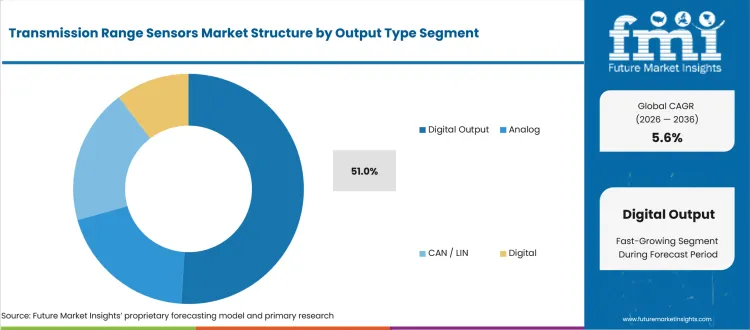
Control units increasingly need discrete and diagnosable range states rather than a basic analog reading. Digital output supports clearer fault recognition, calibration checks and signal consistency across vehicle software. The buyer need is practical: reduce intermittent faults and support repair teams with signals that diagnostic tools can interpret more easily.
- Digital output is predicted to hold around 51.0% of output type demand in 2026, reinforced by control-unit demand for stable diagnostic states. CTS lists transmission position sensors covering park-neutral gear, PRNDL and clutch fork uses. That application range shows why output clarity matters across several drivetrain sensing points.
- The executive case for digital output is warranty control. Clearer states help service teams separate a sensor fault from connector damage or control module issues. This reduces unnecessary part replacement and supports more defensible warranty decisions during intermittent shift complaints. Adjacent vehicle sensors market demand reinforces the same warranty-control concern.
What are the drivers, restraints, and opportunities in the transmission range sensors market?
Near-term purchases are being shaped by selector safety needs, platform fit complexity, and replacement-channel coverage outlined below.
- Driver: Spending is driven by electronic selector programs that need verified park, neutral and drive signals before propulsion is enabled.
- Restraint: Adoption is restrained by connector variation and mounting differences that make cross-platform replacement coverage difficult.
- Opportunity: Supplier access gains traction from contactless sensing and better catalog data for aging automatic vehicle fleets.
Electronic selector programs place range sensors inside the control chain that confirms safe vehicle movement. FMVSS No. 102 makes the market relevance clear by specifying transmission shift position sequence and starter interlock requirements. Buyers therefore evaluate range sensors as safety-related signal sources. Suppliers able to prove stable outputs under heat, vibration and repeated selector movement gain more credible access to OEM sourcing lists.
Replacement complexity can slow adoption in the aftermarket, yet it creates a route for brands that manage vehicle coverage precisely. Dorman lists transmission range sensors designed to match original fit and function on specified vehicles. That wording shows why one generic part cannot serve many platforms. Better catalog accuracy turns the restraint into a commercial advantage for distributors and repair chains.
Contactless and digital designs create an opportunity for suppliers serving compact powertrain electronics. DENSO stated in March 2026 that its automotive semiconductor focus covers sensors detecting vehicle external environment and internal condition. That signal supports the movement toward sensor-rich control architectures. Range sensor suppliers can benefit by aligning output stability and packaging to these electronics programs. Adjacent automotive pressure sensor programs show similar packaging and electronics constraints.
Which country CAGRs are profiled in the transmission range sensors market?
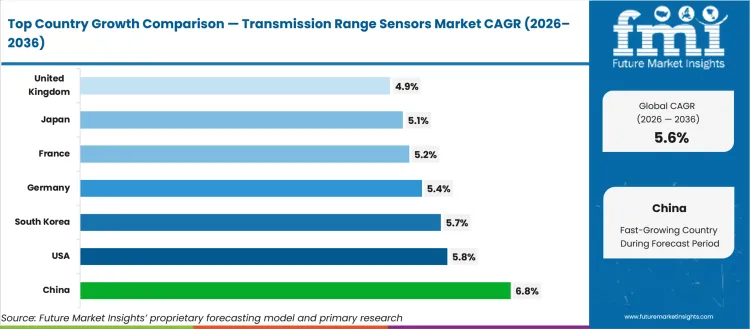
| Country | CAGR |
|---|---|
| United States | 5.8% |
| United Kingdom | 4.9% |
| Germany | 5.4% |
| France | 5.2% |
| Japan | 5.1% |
| China | 6.8% |
| South Korea | 5.7% |
| India | 6.5% |
How do country-level CAGRs compare in the transmission range sensors market?
Country CAGR differences should be read as a mix of vehicle production and automatic transmission fitment. Electrified platform change and repair-channel depth shape the remaining variation. Established markets lean more heavily on replacement demand and platform validation. The United States and Western Europe also show service-coverage pull. China and India sit closer to new vehicle fitment and model refresh. South Korea reflects export-oriented platform decisions. For purchasing teams, the comparison shows where suppliers need OEM engineering support and where they need aftermarket catalog depth.
- The United States is projected to record 5.8% CAGR by 2036, supported by high automatic transmission use and deep repair channels. OICA reported USA vehicle sales of about 16.7 million units in 2025. That installed base keeps replacement sensors relevant even under modest new-vehicle growth.
- The United Kingdom is expected to grow at 4.9% CAGR during the forecast period, owing to service-led demand and premium vehicle repair needs. SMMT reported 764,715 cars and commercial vehicles produced in 2025. Lower production tempers OEM call-offs but repair networks sustain fitment demand.
- Germany is forecast to advance at 5.4% CAGR over the assessment period, shaped by OEM engineering depth and dual-clutch platform use. ACEA reported Germany battery-electric registrations increased 43.2% in 2025. This shows platform electrification pressure that keeps selector electronics relevant in new programs.
- France is anticipated to post 5.2% CAGR by 2036, reinforced by compact platforms and hybrid model demand. ACEA reported France battery-electric registrations increased 12.5% in 2025. The country profile is more moderate than China or India due to cost discipline in compact vehicle programs.
- Japan is likely to expand at 5.1% CAGR by 2036, attributable to hybrid and CVT system depth. JAMA reported motor vehicle production of 8.23 million units in 2024. Supplier qualification remains strict, which favors companies able to prove precision and low warranty risk.
- China is estimated to rise at 6.8% CAGR between 2026 and 2036, propelled by large output and fast local platform change. OICA reported China vehicle production of 34.53 million units in 2025. This creates large fitment volume but keeps suppliers exposed to price discipline.
- South Korea is projected to record 5.7% CAGR by 2036, driven by export-platform demand from domestic OEM groups. Invest Korea reported automobile production of 4.1 million units in 2025. The market differs from Japan due to concentrated OEM buying and export scheduling risk.
- Demand in India is projected to grow at 6.5% CAGR by 2036, supported by automatic variants entering mid-market passenger vehicles. SIAM reported passenger vehicle sales of 46.43 lakh units in FY2025-26. The country profile stands above established markets due to wider new fitment potential.
Who are the notable companies in the transmission range sensors market?
Bosch, TE Connectivity, CTS, Methode Electronics, Standard Motor Products, Dorman, Denso, Aptiv, FORVIA HELLA, and Sensata Technologies are the notable companies shaping this market.
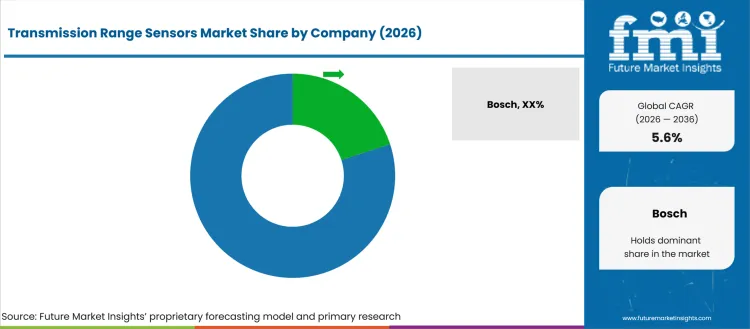
Competition is structured by whether the buyer needs OEM design-in support, aftermarket replacement coverage or adjacent electronics capability. Bosch, TE Connectivity, CTS and Methode Electronics are more relevant for platform engineering and contactless sensing work. Standard Motor Products and Dorman gain preference in repair channels that depend on direct-fit coverage. Denso, Aptiv, FORVIA HELLA and Sensata Technologies matter once range sensing connects to broader control, connector and vehicle electronics architectures. Adjacent automotive crash sensor sourcing shows why signal reliability matters for safety-related electronics.
- Bosch and TE Connectivity focus on vehicle electronics and sensor integration needs. Buyers choosing these suppliers usually need validated components for harsh drivetrain areas. TE Connectivity product evidence around 3D Hall sensing supports this fit for magnetic position measurement in ICE and xEV platforms.
- CTS and Methode Electronics are suited to programs requiring position and angle sensing knowledge. CTS lists transmission position sensors for PRNDL and clutch fork applications. Methode identifies gear position and shift-by-wire e-shifter applications within its automotive position and angle sensing scope.
- Aftermarket buyers using Standard Motor Products and Dorman are usually looking for catalog coverage and direct replacement availability. SMP reported more than 500 new part numbers in Q1 2026. Dorman product pages emphasize matching original fit and function on specified vehicles.
- Denso, Aptiv, FORVIA HELLA and Sensata Technologies gain relevance once range sensing is evaluated inside broader vehicle electronics. Sensata provides position and transmission pressure sensing products. Aptiv adds connector and electrical distribution relevance for harsh environments around drivetrain modules.
Competitive Benchmarking: Transmission Range Sensors Market
| Company | Sensing Portfolio Fit | Transmission Application Fit | Channel Access | Geographic Reach |
|---|---|---|---|---|
| Bosch | High | Strong | High | Global |
| TE Connectivity | High | Strong | High | Global |
| CTS | High | Strong | Medium | Global |
| Methode Electronics | Medium | Strong | Medium | Global |
| Standard Motor Products | Medium | Medium | High | North America |
| Dorman | Medium | Medium | High | North America |
| Denso | Medium | Strong | Medium | Global |
| Aptiv | Medium | Medium | Strong | Global |
| FORVIA HELLA | Medium | Medium | Medium | Europe and Americas |
| Sensata Technologies | Medium | Medium | Medium | Global |
Source: Future Market Insights competitive analysis, 2026. Ratings reflect relative portfolio relevance, workflow or project fit, service capability, and geographic reach.
Key Developments in the Transmission Range Sensors Market
- In September 2025, Bosch made its VASI bus interface available for automotive sensor use. The action matters to range sensing due to tighter sensor-to-control integration. It points to vehicle programs that value interface compatibility and lower supplier lock-in.
- In April 2026, Standard Motor Products released more than 500 new part numbers in Q1 2026. The action supports aftermarket coverage strategy. It also signals that replacement brands compete by adding late-model vehicle applications and broader distributor options.
- In May 2025, Dorman announced hundreds of new light-duty repair solutions. It reported more than 138,000 catalog SKUs. The action matters to transmission range sensors due to fitment-specific replacement demand. It points to catalog depth as a service-channel advantage.
- In September 2025, CTS said it would present a growing portfolio of precision position sensors at IAA Mobility 2025. The action matters because transmission range sensing relies on position measurement know-how. It reinforces supplier emphasis on safety and vehicle-control sensor applications.
Key Players in the Transmission Range Sensors Market
OEM Sensor Specialists
- Bosch
- TE Connectivity
- CTS
- Methode Electronics
- Denso
Aftermarket Coverage Players
- Standard Motor Products
- Dorman
Vehicle Electronics and Connector Specialists
- Aptiv
- FORVIA HELLA
- Sensata Technologies
Transmission Range Sensors Market - Report Scope
| Coverage field | Report scope |
|---|---|
| Market breakdown | Transmission Range Sensors Market Breakdown By Sensor Type, Transmission Type, Vehicle Type, Sales Channel, Output Type and Region |
| Market Definition | Transmission range sensors identify vehicle transmission selector position and send that signal to the control unit for start, park, reverse, neutral and drive functions. |
| Regions Covered | North America, Latin America, Europe, East Asia, South Asia and Pacific, Middle East and Africa |
| Countries Covered | United States, United Kingdom, Germany, France, Japan, China, South Korea, India and wider country coverage |
| Key Companies Profiled | Bosch, TE Connectivity, CTS, Methode Electronics, Standard Motor Products, Dorman, Denso, Aptiv, FORVIA HELLA, Sensata Technologies |
| Forecast Period | 2026 to 2036 |
| Approach | Hybrid bottom-up and top-down methodology using vehicle build data, drivetrain mix, replacement behavior and segment adoption rates |
Transmission Range Sensors Market - Research Methodology
| Method | Approach |
|---|---|
| Primary Research | FMI analysts reviewed inputs from OEM sourcing teams, transmission module suppliers, electronics suppliers, aftermarket distributors and diagnostic service specialists. Discussions focused on sensor failure modes, heat validation, connector fit, replacement routes and channel coverage. |
| Desk Research | Desk research covered vehicle safety rules, official auto production data, trade association releases, supplier product pages and official company updates. Product boundaries were checked against transmission position sensing, selector sensing and direct replacement catalogs. |
| Market Sizing and Forecasting | The model combined vehicle production, transmission mix, sensor fitment rate, replacement frequency, average selling price and country-level drivetrain shifts. Segment values were adjusted for OEM validation cycles, vehicle age and aftermarket failure behavior. |
| Data Validation | Forecasts were checked against vehicle output, electrified vehicle sales, supplier product portfolios and replacement catalog coverage. Duplicate external statistics were removed and company relevance was checked before names were retained in the final article. |
Transmission Range Sensors Market by Segments
Transmission Range Sensors Market segmented by Sensor Type:
- Contact Range Sensors
- Hall-effect Range Sensors
- Magnetoresistive Sensors
- Integrated Selector Sensors
Transmission Range Sensors Market segmented by Transmission Type:
- Automatic Transmission
- DCT
- CVT
- Hybrid / EV Transmission
Transmission Range Sensors Market segmented by Vehicle Type:
- Passenger Cars
- Light Commercial Vehicles
- Commercial Vehicles
- EVs / Hybrids
Transmission Range Sensors Market segmented by Sales Channel:
- OEM
- Aftermarket
Transmission Range Sensors Market segmented by Output Type:
- Analog
- Digital
- CAN / LIN
Transmission Range Sensors Market by Region:
- North America
- United States
- Canada
- Mexico
- Latin America
- Brazil
- Chile
- Rest of Latin America
- Western Europe
- Germany
- UK
- Italy
- Spain
- France
- Nordic
- BENELUX
- Rest of Western Europe
- Eastern Europe
- Russia
- Poland
- Hungary
- Balkan & Baltic
- Rest of Eastern Europe
- East Asia
- China
- Japan
- South Korea
- South Asia and Pacific
- India
- ASEAN
- Australia & New Zealand
- Rest of South Asia and Pacific
- Middle East & Africa
- Kingdom of Saudi Arabia
- Other GCC Countries
- Turkiye
- South Africa
- Other African Union
- Rest of Middle East & Africa
Research Sources and Bibliography
- International Organization of Motor Vehicle Manufacturers. (2026, April). Auto industry growth shifted east in 2025 amid global repositioning. OICA.
- International Energy Agency. (2026, May). Global EV Outlook 2026: Trends in electric cars. IEA.
- Electronic Code of Federal Regulations. (2026). 49 CFR 571.102 - Standard No. 102; transmission shift position sequence, starter interlock, and transmission braking effect. eCFR.
- Society of Indian Automobile Manufacturers. (2026, April). Auto Industry Performance of Q4 (Jan-March 2026) & FY 2025-26. SIAM.
- European Automobile Manufacturers Association. (2026, January 27). New car registrations: +1.8% in 2025; battery-electric 17.4% market share. ACEA.
- Society of Motor Manufacturers and Traders. (2026, January 29). Tough year for Auto but new models and Industrial Strategy can deliver growth. SMMT.
- Japan Automobile Manufacturers Association. (2025, September 26). The Motor Industry of Japan 2025. JAMA.
- Invest Korea. (2026, January 15). S. Korea's auto exports hit record USD 72 bn in 2025. Invest Korea.
- TE Connectivity. (2026). Through-Hole Position Sensor. TE Connectivity.
- CTS Corporation. (2026). Transmission Position Sensors. CTS Corporation.
- Dorman Products. (2026). Transmission Range Sensor 511-100. Dorman Products.
- Standard Motor Products. (2026, April 1). Standard Motor Products releases 505 new numbers in first quarter. Standard Motor Products.
- Bosch Media Service. (2025, September 3). Comprehensive Bosch portfolio for software-driven mobility is a crowd-puller. Bosch.
- Dorman Products. (2025, May 29). Dorman's Light Duty automotive segment announces more first-to-aftermarket repair solutions. Dorman Products.
- CTS Corporation. (2025, September). CTS will attend IAA Mobility 2025 in Munich. CTS Corporation.
- DENSO Corporation. (2026, March 16). Driving new advances in mobility and social infrastructure with next-generation automotive semiconductors. DENSO.
This bibliography is provided for reader reference and uses primary government, standards-body, official trade body, and company sources.
This Report Answers
- What is the expected value of the Transmission Range Sensors Market in 2026 and 2036?
- What CAGR is forecast for transmission range sensors during the 2026 to 2036 period?
- Which sensor type has a notable share in the 2026 demand outlook?
- Which transmission type creates meaningful demand for range sensors?
- How do OEM and aftermarket channels differ in buying transmission range sensors?
- Which countries are compared in the transmission range sensors forecast?
- Which companies compete across OEM sensing and aftermarket replacement coverage?
- What products are included within the Transmission Range Sensors Market definition?
- How does FMI size and forecast transmission range sensor demand across segments and countries?
- What supplier-selection factors should buyers assess before sourcing range sensors?
Frequently Asked Questions
Why should executives track the Transmission Range Sensors Market?
Executives should track this market because accurate gear selection sensing is critical for vehicle start authorization safety compliance and drivetrain reliability.
What business problem does the Transmission Range Sensors Market address?
It ensures the transmission control unit correctly identifies park neutral reverse and drive states before torque is enabled.
What should procurement leaders evaluate before selecting suppliers?
Procurement leaders should evaluate sealing performance output stability connector compatibility validation history and vehicle platform coverage.
What can limit return on investment for buyers?
Return on investment can be limited by sensor drift heat exposure fitment mismatch and limited aftermarket coverage.
How can suppliers build executive confidence?
Suppliers build confidence by delivering contactless sensing proven durability clear diagnostic output and strong OEM and service channel support.
Preview the report firsthand - request a free sample
Get SampleGet the brochure for pricing and purchase details.
Get PDFTable of Content
- Key Takeaways
- Market Size and CAGR
- Top Growth Driver
- Fastest Growing Segment
- Leading Region
- Key Companies
- Emerging Opportunities
- Executive Summary
- Global Market Outlook
- Demand-side Trends
- Supply-side Trends
- Technology Roadmap Analysis
- Analysis and Recommendations
- Analyst Perspective (What is happening? Why now? What should investors know?)
- Key Questions Answered
- How large is the market?
- What is the CAGR?
- What are key trends?
- Which region dominates?
- Who are the leaders?
- Market Overview
- Market Coverage / Taxonomy
- Market Definition / Scope / Limitations
- Research Methodology
- Chapter Orientation
- Analytical Lens and Working Hypotheses
- Market Structure, Signals, and Trend Drivers
- Benchmarking and Cross-market Comparability
- Market Sizing, Forecasting, and Opportunity Mapping
- Research Design and Evidence Framework
- Desk Research Programme (Secondary Evidence)
- Expert Input and Fieldwork (Primary Evidence)
- Tooling, Models, and Reference Databases
- Data Engineering and Model Build
- Quality Assurance and Audit Trail
- Market Background
- Market Dynamics (Drivers, Restraints, Opportunity, Trends)
- Scenario Forecast (Optimistic, Likely, Conservative)
- Impact Analysis
- AI Impact
- Sustainability Impact
- Regulatory Impact
- Technology Impact
- Consumer / Buyer Analysis
- Purchase Drivers
- Adoption Barriers
- Buyer Journey
- Opportunity Map Analysis
- Product Life Cycle Analysis
- Supply Chain Analysis
- Investment Feasibility Matrix
- Value Chain Analysis
- PESTLE and Porter's Analysis
- Regulatory Landscape
- Regional Parent Market Outlook
- Production and Consumption Statistics
- Import and Export Statistics
- Global Market Analysis and Forecast, 2021 to 2036
- Historical Market Size Value (USD Million) & Volume (Unit) Analysis, 2021 to 2025
- Current and Future Market Size Value (USD Million) & Volume (Unit) Projections, 2026 to 2036
- Y-o-Y Growth Trend Analysis
- Absolute $ Opportunity Analysis
- Global Market Pricing Analysis, 2021 to 2036
- Global Market Analysis and Forecast, By Sensor Type, 2021 to 2036
- Introduction / Key Findings
- Historical Market Size Value (USD Million) & Volume (Unit) Analysis By Sensor Type, 2021 to 2025
- Current and Future Market Size Value (USD Million) & Volume (Unit) Analysis and Forecast By Sensor Type, 2026 to 2036
- Hall-effect Range Sensors
- Contact Range Sensors
- Integrated Selector Sensors
- Magnetoresistive Sensors
- Hall-effect Range Sensors
- Y-o-Y Growth Trend Analysis By Sensor Type, 2021 to 2025
- Absolute $ Opportunity Analysis By Sensor Type, 2026 to 2036
- Global Market Analysis and Forecast, By Transmission Type, 2021 to 2036
- Introduction / Key Findings
- Historical Market Size Value (USD Million) & Volume (Unit) Analysis By Transmission Type, 2021 to 2025
- Current and Future Market Size Value (USD Million) & Volume (Unit) Analysis and Forecast By Transmission Type, 2026 to 2036
- Automatic Transmission
- DCT
- CVT
- Hybrid / EV Transmission
- Automatic Transmission
- Y-o-Y Growth Trend Analysis By Transmission Type, 2021 to 2025
- Absolute $ Opportunity Analysis By Transmission Type, 2026 to 2036
- Global Market Analysis and Forecast, By Vehicle Type, 2021 to 2036
- Introduction / Key Findings
- Historical Market Size Value (USD Million) & Volume (Unit) Analysis By Vehicle Type, 2021 to 2025
- Current and Future Market Size Value (USD Million) & Volume (Unit) Analysis and Forecast By Vehicle Type, 2026 to 2036
- Passenger Cars
- Light Commercial Vehicles
- Commercial Vehicles
- EVs / Hybrids
- Passenger Cars
- Y-o-Y Growth Trend Analysis By Vehicle Type, 2021 to 2025
- Absolute $ Opportunity Analysis By Vehicle Type, 2026 to 2036
- Global Market Analysis and Forecast, By Sales Channel, 2021 to 2036
- Introduction / Key Findings
- Historical Market Size Value (USD Million) & Volume (Unit) Analysis By Sales Channel, 2021 to 2025
- Current and Future Market Size Value (USD Million) & Volume (Unit) Analysis and Forecast By Sales Channel, 2026 to 2036
- OEM
- Aftermarket
- OEM
- Y-o-Y Growth Trend Analysis By Sales Channel, 2021 to 2025
- Absolute $ Opportunity Analysis By Sales Channel, 2026 to 2036
- Global Market Analysis and Forecast, By Output Type, 2021 to 2036
- Introduction / Key Findings
- Historical Market Size Value (USD Million) & Volume (Unit) Analysis By Output Type, 2021 to 2025
- Current and Future Market Size Value (USD Million) & Volume (Unit) Analysis and Forecast By Output Type, 2026 to 2036
- Digital Output
- Analog
- CAN / LIN
- Digital
- Digital Output
- Y-o-Y Growth Trend Analysis By Output Type, 2021 to 2025
- Absolute $ Opportunity Analysis By Output Type, 2026 to 2036
- Global Market Analysis and Forecast, By Region, 2021 to 2036
- Introduction
- Historical Market Size Value (USD Million) & Volume (Unit) Analysis By Region, 2021 to 2025
- Current Market Size Value (USD Million) & Volume (Unit) Analysis and Forecast By Region, 2026 to 2036
- North America
- Latin America
- Western Europe
- Eastern Europe
- East Asia
- South Asia and Pacific
- Middle East & Africa
- Market Attractiveness Analysis By Region
- North America Market Analysis and Forecast, By Country, 2021 to 2036
- Historical Market Size Value (USD Million) & Volume (Unit) Trend Analysis By Market Taxonomy, 2021 to 2025
- Market Size Value (USD Million) & Volume (Unit) Forecast By Market Taxonomy, 2026 to 2036
- By Country
- USA
- Canada
- Mexico
- By Sensor Type
- By Transmission Type
- By Vehicle Type
- By Sales Channel
- By Output Type
- By Country
- Market Attractiveness Analysis
- By Country
- By Sensor Type
- By Transmission Type
- By Vehicle Type
- By Sales Channel
- By Output Type
- Key Takeaways
- Latin America Market Analysis and Forecast, By Country
- Historical Market Size Value (USD Million) & Volume (Unit) Trend Analysis By Market Taxonomy, 2021 to 2025
- Market Size Value (USD Million) & Volume (Unit) Forecast By Market Taxonomy, 2026 to 2036
- By Country
- Brazil
- Chile
- Rest of Latin America
- By Sensor Type
- By Transmission Type
- By Vehicle Type
- By Sales Channel
- By Output Type
- By Country
- Market Attractiveness Analysis
- By Country
- By Sensor Type
- By Transmission Type
- By Vehicle Type
- By Sales Channel
- By Output Type
- Key Takeaways
- Western Europe Market Analysis and Forecast, By Country
- Historical Market Size Value (USD Million) & Volume (Unit) Trend Analysis By Market Taxonomy, 2021 to 2025
- Market Size Value (USD Million) & Volume (Unit) Forecast By Market Taxonomy, 2026 to 2036
- By Country
- Germany
- UK
- Italy
- Spain
- France
- Nordic
- BENELUX
- Rest of Western Europe
- By Sensor Type
- By Transmission Type
- By Vehicle Type
- By Sales Channel
- By Output Type
- By Country
- Market Attractiveness Analysis
- By Country
- By Sensor Type
- By Transmission Type
- By Vehicle Type
- By Sales Channel
- By Output Type
- Key Takeaways
- Eastern Europe Market Analysis and Forecast, By Country
- Historical Market Size Value (USD Million) & Volume (Unit) Trend Analysis By Market Taxonomy, 2021 to 2025
- Market Size Value (USD Million) & Volume (Unit) Forecast By Market Taxonomy, 2026 to 2036
- By Country
- Russia
- Poland
- Hungary
- Balkan & Baltic
- Rest of Eastern Europe
- By Sensor Type
- By Transmission Type
- By Vehicle Type
- By Sales Channel
- By Output Type
- By Country
- Market Attractiveness Analysis
- By Country
- By Sensor Type
- By Transmission Type
- By Vehicle Type
- By Sales Channel
- By Output Type
- Key Takeaways
- East Asia Market Analysis and Forecast, By Country
- Historical Market Size Value (USD Million) & Volume (Unit) Trend Analysis By Market Taxonomy, 2021 to 2025
- Market Size Value (USD Million) & Volume (Unit) Forecast By Market Taxonomy, 2026 to 2036
- By Country
- China
- Japan
- South Korea
- By Sensor Type
- By Transmission Type
- By Vehicle Type
- By Sales Channel
- By Output Type
- By Country
- Market Attractiveness Analysis
- By Country
- By Sensor Type
- By Transmission Type
- By Vehicle Type
- By Sales Channel
- By Output Type
- Key Takeaways
- South Asia and Pacific Market Analysis and Forecast, By Country
- Historical Market Size Value (USD Million) & Volume (Unit) Trend Analysis By Market Taxonomy, 2021 to 2025
- Market Size Value (USD Million) & Volume (Unit) Forecast By Market Taxonomy, 2026 to 2036
- By Country
- India
- ASEAN
- Australia & New Zealand
- Rest of South Asia and Pacific
- By Sensor Type
- By Transmission Type
- By Vehicle Type
- By Sales Channel
- By Output Type
- By Country
- Market Attractiveness Analysis
- By Country
- By Sensor Type
- By Transmission Type
- By Vehicle Type
- By Sales Channel
- By Output Type
- Key Takeaways
- Middle East & Africa Market Analysis and Forecast, By Country
- Historical Market Size Value (USD Million) & Volume (Unit) Trend Analysis By Market Taxonomy, 2021 to 2025
- Market Size Value (USD Million) & Volume (Unit) Forecast By Market Taxonomy, 2026 to 2036
- By Country
- Kingdom of Saudi Arabia
- Other GCC Countries
- Türkiye
- South Africa
- Other African Union
- Rest of Middle East & Africa
- By Sensor Type
- By Transmission Type
- By Vehicle Type
- By Sales Channel
- By Output Type
- By Country
- Market Attractiveness Analysis
- By Country
- By Sensor Type
- By Transmission Type
- By Vehicle Type
- By Sales Channel
- By Output Type
- Key Takeaways
- Key Countries Market Analysis
- USA
- Pricing Analysis
- Market Share Analysis, 2025
- By Sensor Type
- By Transmission Type
- By Vehicle Type
- By Sales Channel
- By Output Type
- Canada
- Pricing Analysis
- Market Share Analysis, 2025
- By Sensor Type
- By Transmission Type
- By Vehicle Type
- By Sales Channel
- By Output Type
- Mexico
- Pricing Analysis
- Market Share Analysis, 2025
- By Sensor Type
- By Transmission Type
- By Vehicle Type
- By Sales Channel
- By Output Type
- Brazil
- Pricing Analysis
- Market Share Analysis, 2025
- By Sensor Type
- By Transmission Type
- By Vehicle Type
- By Sales Channel
- By Output Type
- Chile
- Pricing Analysis
- Market Share Analysis, 2025
- By Sensor Type
- By Transmission Type
- By Vehicle Type
- By Sales Channel
- By Output Type
- Germany
- Pricing Analysis
- Market Share Analysis, 2025
- By Sensor Type
- By Transmission Type
- By Vehicle Type
- By Sales Channel
- By Output Type
- UK
- Pricing Analysis
- Market Share Analysis, 2025
- By Sensor Type
- By Transmission Type
- By Vehicle Type
- By Sales Channel
- By Output Type
- Italy
- Pricing Analysis
- Market Share Analysis, 2025
- By Sensor Type
- By Transmission Type
- By Vehicle Type
- By Sales Channel
- By Output Type
- Spain
- Pricing Analysis
- Market Share Analysis, 2025
- By Sensor Type
- By Transmission Type
- By Vehicle Type
- By Sales Channel
- By Output Type
- France
- Pricing Analysis
- Market Share Analysis, 2025
- By Sensor Type
- By Transmission Type
- By Vehicle Type
- By Sales Channel
- By Output Type
- India
- Pricing Analysis
- Market Share Analysis, 2025
- By Sensor Type
- By Transmission Type
- By Vehicle Type
- By Sales Channel
- By Output Type
- ASEAN
- Pricing Analysis
- Market Share Analysis, 2025
- By Sensor Type
- By Transmission Type
- By Vehicle Type
- By Sales Channel
- By Output Type
- Australia & New Zealand
- Pricing Analysis
- Market Share Analysis, 2025
- By Sensor Type
- By Transmission Type
- By Vehicle Type
- By Sales Channel
- By Output Type
- China
- Pricing Analysis
- Market Share Analysis, 2025
- By Sensor Type
- By Transmission Type
- By Vehicle Type
- By Sales Channel
- By Output Type
- Japan
- Pricing Analysis
- Market Share Analysis, 2025
- By Sensor Type
- By Transmission Type
- By Vehicle Type
- By Sales Channel
- By Output Type
- South Korea
- Pricing Analysis
- Market Share Analysis, 2025
- By Sensor Type
- By Transmission Type
- By Vehicle Type
- By Sales Channel
- By Output Type
- Russia
- Pricing Analysis
- Market Share Analysis, 2025
- By Sensor Type
- By Transmission Type
- By Vehicle Type
- By Sales Channel
- By Output Type
- Poland
- Pricing Analysis
- Market Share Analysis, 2025
- By Sensor Type
- By Transmission Type
- By Vehicle Type
- By Sales Channel
- By Output Type
- Hungary
- Pricing Analysis
- Market Share Analysis, 2025
- By Sensor Type
- By Transmission Type
- By Vehicle Type
- By Sales Channel
- By Output Type
- Kingdom of Saudi Arabia
- Pricing Analysis
- Market Share Analysis, 2025
- By Sensor Type
- By Transmission Type
- By Vehicle Type
- By Sales Channel
- By Output Type
- Türkiye
- Pricing Analysis
- Market Share Analysis, 2025
- By Sensor Type
- By Transmission Type
- By Vehicle Type
- By Sales Channel
- By Output Type
- South Africa
- Pricing Analysis
- Market Share Analysis, 2025
- By Sensor Type
- By Transmission Type
- By Vehicle Type
- By Sales Channel
- By Output Type
- USA
- Market Structure Analysis
- Competition Dashboard
- Competition Benchmarking
- Market Share Analysis of Top Players
- By Regional
- By Sensor Type
- By Transmission Type
- By Vehicle Type
- By Sales Channel
- By Output Type
- Emerging Startups
- Innovation Benchmarking
- Competition Analysis
- Competition Deep Dive
- Bosch
- Overview
- Product Portfolio
- Profitability by Market Segments (Product/Region/Sales Channel)
- Sales Footprint
- Strategy Overview
- Marketing Strategy
- Product Strategy
- Channel Strategy
- TE Connectivity
- CTS
- Methode Electronics
- Denso
- Bosch
- Case Studies
- Success Stories
- Recent Developments
- Competition Deep Dive
- Assumptions & Acronyms Used


