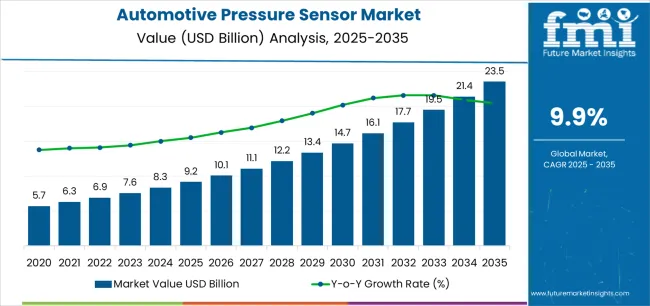
The Automotive Pressure Sensor Market was valued at USD 7.4 billion in 2023, and it is anticipated to reach a global market valuation of USD 22.6 billion by 2034, growing at a steady CAGR of 10.4% from 2024 to 2034.
One distinct factor propelling the automotive pressure sensor market is the growing incorporation of sensors in innovative vehicle categories, such connected and autonomous vehicles.
These vehicles need comprehensive sensor networks, including pressure sensors, to allow advanced functions such as autonomous driving as well as vehicle-to-vehicle communication, which increases demand for pressure sensor solutions in these markets.
Sales Analysis of Automotive Pressure Sensors
Report Attribute | Details |
---|---|
Estimated Market Value in 2023 | USD 7.4 billion |
Expected Market Value in 2024 | USD 8.3 billion |
Projected Forecast Value in 2034 | USD 22.6 billion |
Anticipated Growth Rate from 2024 to 2034 | 10.4% CAGR |
The global demand for the automotive pressure sensor market was estimated to reach a valuation of USD 4.4 billion in 2019, according to a report from Future Market Insights (FMI). From 2019 to 2023, sales witnessed significant growth in the automotive pressure sensor market, registering a CAGR of 14.2%.
Historical CAGR from 2019 to 2023 | 14.2% |
---|---|
Forecast CAGR from 2024 to 2034 | 10.4% |
Innovation and demand come together to propel impressive growth in a thriving market such as the automotive pressure sensor market.
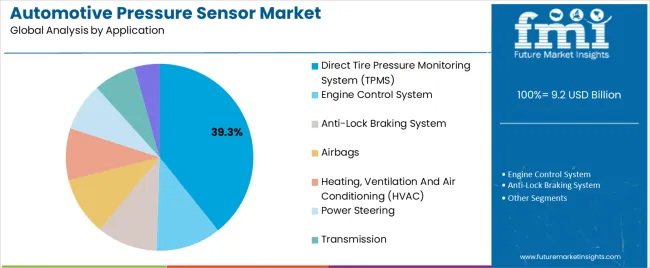
The need for pressure sensor solutions in the automotive sector is driven by the critical role pressure sensors play in ADAS applications such as tire pressure monitoring systems (TPMS) as well as brake pressure sensing, which improve vehicle safety.
Some important factors that will boost the market growth through 2034 are:
Rapid Expansion of Electric Vehicles to Enhance Demand
The rapidly growing electric vehicle (EV) industry is another factor propelling the automotive pressure sensor market. Pressure sensors are becoming more and more necessary to keep an eye on electric vehicle cooling systems, battery systems, and other vital parts as demand for EVs rises worldwide.
The need for advanced pressure sensor solutions is being driven by the spike in EV usage, which is propelling market expansion in the automotive industry.
Increased Focus on Vehicle Safety to bolster demand globally
The growing emphasis on driving safety and legal compliance is one of the key factors propelling the automotive pressure sensor market. The integration of innovative safety technologies into vehicles is a top priority for manufacturers due to the severe safety standards in place globally and the rising concern over road accidents.
Pressure sensors are essential for maintaining compliance with safety regulations and improving overall vehicle safety, which propels market growth. Examples of these key systems to monitor include tire pressure, engine performance, and brake systems.
Economic Uncertainties and Fluctuating Raw Material Prices to Impede the Market Growth
Market expansion is constrained by manufacturing costs that are impacted by economic concerns and volatile raw material prices. Manufacturers face difficulties in integrating sensors into current automotive systems due to their complexity, which delays acceptance.
Since manufacturers emphasize choosing sensors that fulfill strict quality standards and regulatory criteria to assure vehicle safety and performance, concerns about sensor accuracy, durability, and dependability impede market growth.
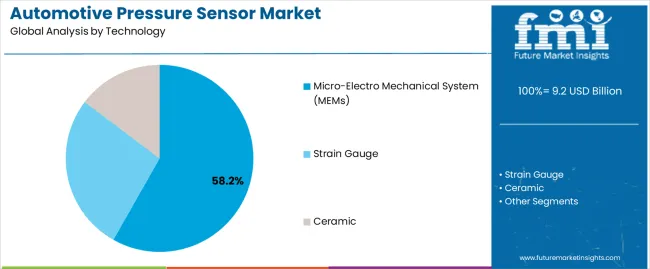
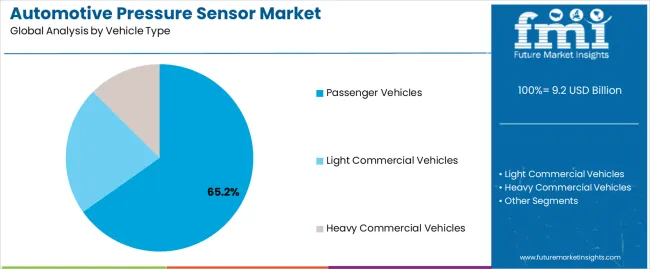
This section focuses on providing detailed analysis of two particular market segments for automotive pressure sensors, the dominant technology type and the significant vehicle type. The two main segments discussed below are micro-electro mechanical systems and passenger vehicles.
Technology | Micro-Electro Mechanical System (MEMS) |
---|---|
CAGR from 2024 to 2034 | 10.3% |
During the forecast period, the micro-electro mechanical system segment is likely to garner a 10.3% CAGR. Micro-Electro Mechanical System (MEMS) pressure sensors are gaining popularity in the automotive pressure sensor market owing to its small size, low power consumption, and excellent accuracy.
MEMS sensors provide a space-saving option without sacrificing performance as automakers look to fit more sensors into ever smaller places. Their market acceptance is further fueled by their resilience to challenging operating environments and capacity to deliver real-time data, which makes them perfect for automotive applications.
Vehicle Type | Passenger Vehicles |
---|---|
Market Share in 2024 | 51% |
In 2024, the passenger vehicles segment is likely to acquire a 51% global market share. Several reasons are driving the growth of the passenger vehicle segment in the global automotive pressure sensor market.
Pressure sensors are being incorporated into passenger vehicles to improve safety and lower accident rates in response to growing customer demand for safety features like tire pressure monitoring systems (TPMS).
The need for pressure sensors in passenger vehicles is further driven by the growing electrification of vehicles and the deployment of advanced driver assistance systems (ADAS), which boosts market growth.
This section will go into detail on the automotive pressure sensor markets in a few key countries, including the United States, the United Kingdom, China, Japan, and South Korea. This part will focus on the primary factors that are driving up demand in these countries for automotive pressure sensors.
Countries | Forecast CAGRs from 2024 to 2034 |
---|---|
The United States | 10.8% |
The United Kingdom | 29% |
China | 28% |
Japan | 28.2% |
South Korea | 29.2% |
The United States automotive pressure sensor is anticipated to gain a CAGR of 10.8% through 2034. The United States is a powerhouse for technological advancement in the automotive industry, with corporations investing extensively in research and development.
This dedication propels sensor technology forward, resulting in the creation of high-performance pressure sensors for a range of automotive applications.
The performance and emissions of vehicles are subject to strict safety rules in the United States. The automotive sector is experiencing a surge in demand for sophisticated pressure sensor solutions considering the significant role pressure sensors play in guaranteeing adherence to these requirements. These sensors monitor vital systems like tire pressure and brake function.
The market in the United Kingdom is expected to expand with an 11.7% CAGR through 2034. The United Kingdom's commitment to lowering carbon emissions and promoting sustainable transportation boosts the need for pressure sensors for electric and hybrid vehicles.
This emphasis on environmental sustainability encourages sensor technology innovation to improve performance and efficiency.
The United Kingdom possesses a strong automotive research and development industry that propels breakthroughs in sensor technology and pressure sensor systems for automobiles.
Collaborations between industry and researchers help to create innovative sensor technology, establishing the United Kingdom as a major participant in the automotive pressure sensor market.
The automotive pressure sensor ecosystem in China is anticipated to develop with a 10.9% CAGR from 2024 to 2034. The automotive market in China has grown at an exponential rate, taking the lead in the world economy.
This growth increases the need for pressure sensors, which are used in both conventional and electric vehicles to monitor various vehicle systems.
The Chinese government proactively encourages the use of electric vehicles as a means of mitigating pollution and lowering emissions.
The automotive pressure sensor market is growing as a result of this strategy, which encourages investment in innovative sensor technologies to assist electric vehicle systems, such as battery monitoring as well as thermal management.
The automotive pressure sensor industry in Japan is anticipated to reach an 11.9% CAGR from 2024 to 2034. Japan is well known for its technological innovations in the production of automotive.
Japanese companies consistently allocate resources to research and development in order to develop state-of-the-art sensor technologies that improve accuracy and dependability.
The regional dedication to innovation makes it a prominent player in the development of automotive pressure sensor technology.
Japan has strict vehicle security laws, which is why there is a need for premium pressure sensors to keep an eye on vital functions like brakes and tire pressure.
Following these requirements is a top priority for Japanese automakers, which has resulted in a steady need for sophisticated pressure sensor systems to guarantee both regulatory compliance and vehicle safety.
The automotive pressure sensor ecosystem in South Korea is likely to evolve with a 12.2% CAGR during the forecast period. The government of South Korea aggressively encourages technical innovation in the automotive sector by providing financial incentives and assistance for research and development.
This creates a favorable atmosphere for market expansion and incentivizes local businesses to invest in cutting-edge sensor technology. The automotive manufacturing sector in South Korea is strong, with market leaders Hyundai and Kia.
The regional automotive pressure sensor market is expanding as a result of the growing use of advanced sensors in vehicles for efficiency and safety.
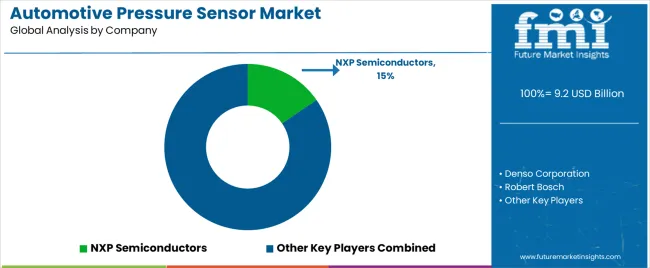
Leading companies within the global automotive pressure sensor market are developing new products to satisfy the growing need for advanced sensing technologies.
Their main goal is to provide high-performance pressure sensors that can precisely measure a range of characteristics, including fuel system pressure, tire pressure, and engine oil pressure.
To improve the longevity, dependability, and efficiency of sensors, major firms are spending money on research and development. To take advantage of the increasing prospects in the automotive pressure sensor industry, they are diversifying their product lines to provide integrated sensor solutions that meet the changing demands of manufacturers. The key players in this market include:
Significant advancements in the automotive pressure sensor market are being made by key market participants, and these include:
Report Attribute | Details |
---|---|
Growth Rate | CAGR of 10.4% from 2024 to 2034 |
Market Value in 2024 | USD 8.3 billion |
Market Value in 2034 | USD 22.6 billion |
Base Year for Estimation | 2023 |
Historical Data | 2019 to 2023 |
Forecast Period | 2024 to 2034 |
Quantitative Units | USD billion for value |
Report Coverage | Revenue Forecast, Company Ranking, Competitive Landscape, Growth Factors, Trends, and Pricing Analysis |
Segments Covered | Technology, Vehicle, Application, Transduction Type, Region |
Regions Covered | North America; Latin America; Western Europe; Eastern Europe; South Asia and Pacific; East Asia; Middle East & Africa |
Countries Profiled | United States, Canada, Brazil, Mexico, Germany, United Kingdom, France, Spain, Italy, Poland, Russia, Czech Republic, Romania, India, Bangladesh, Australia, New Zealand, China, Japan, South Korea, GCC Countries, South Africa, Israel |
Key Companies Profiled | NXP Semiconductors; Denso Corporation; Robert Bosch; Honeywell International Inc.; Analog Devices; Continental AG; Delphi; Sensata Technologies; Infineon; STMicroelectronics |
Customization Scope | Available on Request |
Table 1: Global Market Value (US$ Million) Forecast by Region, 2019 to 2034
Table 2: Global Market Volume (Units) Forecast by Region, 2019 to 2034
Table 3: Global Market Value (US$ Million) Forecast by Technology, 2019 to 2034
Table 4: Global Market Volume (Units) Forecast by Technology, 2019 to 2034
Table 5: Global Market Value (US$ Million) Forecast by Vehicle Type, 2019 to 2034
Table 6: Global Market Volume (Units) Forecast by Vehicle Type, 2019 to 2034
Table 7: Global Market Value (US$ Million) Forecast by Application, 2019 to 2034
Table 8: Global Market Volume (Units) Forecast by Application, 2019 to 2034
Table 9: Global Market Value (US$ Million) Forecast by Transduction Type, 2019 to 2034
Table 10: Global Market Volume (Units) Forecast by Transduction Type, 2019 to 2034
Table 11: North America Market Value (US$ Million) Forecast by Country, 2019 to 2034
Table 12: North America Market Volume (Units) Forecast by Country, 2019 to 2034
Table 13: North America Market Value (US$ Million) Forecast by Technology, 2019 to 2034
Table 14: North America Market Volume (Units) Forecast by Technology, 2019 to 2034
Table 15: North America Market Value (US$ Million) Forecast by Vehicle Type, 2019 to 2034
Table 16: North America Market Volume (Units) Forecast by Vehicle Type, 2019 to 2034
Table 17: North America Market Value (US$ Million) Forecast by Application, 2019 to 2034
Table 18: North America Market Volume (Units) Forecast by Application, 2019 to 2034
Table 19: North America Market Value (US$ Million) Forecast by Transduction Type, 2019 to 2034
Table 20: North America Market Volume (Units) Forecast by Transduction Type, 2019 to 2034
Table 21: Latin America Market Value (US$ Million) Forecast by Country, 2019 to 2034
Table 22: Latin America Market Volume (Units) Forecast by Country, 2019 to 2034
Table 23: Latin America Market Value (US$ Million) Forecast by Technology, 2019 to 2034
Table 24: Latin America Market Volume (Units) Forecast by Technology, 2019 to 2034
Table 25: Latin America Market Value (US$ Million) Forecast by Vehicle Type, 2019 to 2034
Table 26: Latin America Market Volume (Units) Forecast by Vehicle Type, 2019 to 2034
Table 27: Latin America Market Value (US$ Million) Forecast by Application, 2019 to 2034
Table 28: Latin America Market Volume (Units) Forecast by Application, 2019 to 2034
Table 29: Latin America Market Value (US$ Million) Forecast by Transduction Type, 2019 to 2034
Table 30: Latin America Market Volume (Units) Forecast by Transduction Type, 2019 to 2034
Table 31: Western Europe Market Value (US$ Million) Forecast by Country, 2019 to 2034
Table 32: Western Europe Market Volume (Units) Forecast by Country, 2019 to 2034
Table 33: Western Europe Market Value (US$ Million) Forecast by Technology, 2019 to 2034
Table 34: Western Europe Market Volume (Units) Forecast by Technology, 2019 to 2034
Table 35: Western Europe Market Value (US$ Million) Forecast by Vehicle Type, 2019 to 2034
Table 36: Western Europe Market Volume (Units) Forecast by Vehicle Type, 2019 to 2034
Table 37: Western Europe Market Value (US$ Million) Forecast by Application, 2019 to 2034
Table 38: Western Europe Market Volume (Units) Forecast by Application, 2019 to 2034
Table 39: Western Europe Market Value (US$ Million) Forecast by Transduction Type, 2019 to 2034
Table 40: Western Europe Market Volume (Units) Forecast by Transduction Type, 2019 to 2034
Table 41: Eastern Europe Market Value (US$ Million) Forecast by Country, 2019 to 2034
Table 42: Eastern Europe Market Volume (Units) Forecast by Country, 2019 to 2034
Table 43: Eastern Europe Market Value (US$ Million) Forecast by Technology, 2019 to 2034
Table 44: Eastern Europe Market Volume (Units) Forecast by Technology, 2019 to 2034
Table 45: Eastern Europe Market Value (US$ Million) Forecast by Vehicle Type, 2019 to 2034
Table 46: Eastern Europe Market Volume (Units) Forecast by Vehicle Type, 2019 to 2034
Table 47: Eastern Europe Market Value (US$ Million) Forecast by Application, 2019 to 2034
Table 48: Eastern Europe Market Volume (Units) Forecast by Application, 2019 to 2034
Table 49: Eastern Europe Market Value (US$ Million) Forecast by Transduction Type, 2019 to 2034
Table 50: Eastern Europe Market Volume (Units) Forecast by Transduction Type, 2019 to 2034
Table 51: South Asia and Pacific Market Value (US$ Million) Forecast by Country, 2019 to 2034
Table 52: South Asia and Pacific Market Volume (Units) Forecast by Country, 2019 to 2034
Table 53: South Asia and Pacific Market Value (US$ Million) Forecast by Technology, 2019 to 2034
Table 54: South Asia and Pacific Market Volume (Units) Forecast by Technology, 2019 to 2034
Table 55: South Asia and Pacific Market Value (US$ Million) Forecast by Vehicle Type, 2019 to 2034
Table 56: South Asia and Pacific Market Volume (Units) Forecast by Vehicle Type, 2019 to 2034
Table 57: South Asia and Pacific Market Value (US$ Million) Forecast by Application, 2019 to 2034
Table 58: South Asia and Pacific Market Volume (Units) Forecast by Application, 2019 to 2034
Table 59: South Asia and Pacific Market Value (US$ Million) Forecast by Transduction Type, 2019 to 2034
Table 60: South Asia and Pacific Market Volume (Units) Forecast by Transduction Type, 2019 to 2034
Table 61: East Asia Market Value (US$ Million) Forecast by Country, 2019 to 2034
Table 62: East Asia Market Volume (Units) Forecast by Country, 2019 to 2034
Table 63: East Asia Market Value (US$ Million) Forecast by Technology, 2019 to 2034
Table 64: East Asia Market Volume (Units) Forecast by Technology, 2019 to 2034
Table 65: East Asia Market Value (US$ Million) Forecast by Vehicle Type, 2019 to 2034
Table 66: East Asia Market Volume (Units) Forecast by Vehicle Type, 2019 to 2034
Table 67: East Asia Market Value (US$ Million) Forecast by Application, 2019 to 2034
Table 68: East Asia Market Volume (Units) Forecast by Application, 2019 to 2034
Table 69: East Asia Market Value (US$ Million) Forecast by Transduction Type, 2019 to 2034
Table 70: East Asia Market Volume (Units) Forecast by Transduction Type, 2019 to 2034
Table 71: Middle East and Africa Market Value (US$ Million) Forecast by Country, 2019 to 2034
Table 72: Middle East and Africa Market Volume (Units) Forecast by Country, 2019 to 2034
Table 73: Middle East and Africa Market Value (US$ Million) Forecast by Technology, 2019 to 2034
Table 74: Middle East and Africa Market Volume (Units) Forecast by Technology, 2019 to 2034
Table 75: Middle East and Africa Market Value (US$ Million) Forecast by Vehicle Type, 2019 to 2034
Table 76: Middle East and Africa Market Volume (Units) Forecast by Vehicle Type, 2019 to 2034
Table 77: Middle East and Africa Market Value (US$ Million) Forecast by Application, 2019 to 2034
Table 78: Middle East and Africa Market Volume (Units) Forecast by Application, 2019 to 2034
Table 79: Middle East and Africa Market Value (US$ Million) Forecast by Transduction Type, 2019 to 2034
Table 80: Middle East and Africa Market Volume (Units) Forecast by Transduction Type, 2019 to 2034
Figure 1: Global Market Value (US$ Million) by Technology, 2024 to 2034
Figure 2: Global Market Value (US$ Million) by Vehicle Type, 2024 to 2034
Figure 3: Global Market Value (US$ Million) by Application, 2024 to 2034
Figure 4: Global Market Value (US$ Million) by Transduction Type, 2024 to 2034
Figure 5: Global Market Value (US$ Million) by Region, 2024 to 2034
Figure 6: Global Market Value (US$ Million) Analysis by Region, 2019 to 2034
Figure 7: Global Market Volume (Units) Analysis by Region, 2019 to 2034
Figure 8: Global Market Value Share (%) and BPS Analysis by Region, 2024 to 2034
Figure 9: Global Market Y-o-Y Growth (%) Projections by Region, 2024 to 2034
Figure 10: Global Market Value (US$ Million) Analysis by Technology, 2019 to 2034
Figure 11: Global Market Volume (Units) Analysis by Technology, 2019 to 2034
Figure 12: Global Market Value Share (%) and BPS Analysis by Technology, 2024 to 2034
Figure 13: Global Market Y-o-Y Growth (%) Projections by Technology, 2024 to 2034
Figure 14: Global Market Value (US$ Million) Analysis by Vehicle Type, 2019 to 2034
Figure 15: Global Market Volume (Units) Analysis by Vehicle Type, 2019 to 2034
Figure 16: Global Market Value Share (%) and BPS Analysis by Vehicle Type, 2024 to 2034
Figure 17: Global Market Y-o-Y Growth (%) Projections by Vehicle Type, 2024 to 2034
Figure 18: Global Market Value (US$ Million) Analysis by Application, 2019 to 2034
Figure 19: Global Market Volume (Units) Analysis by Application, 2019 to 2034
Figure 20: Global Market Value Share (%) and BPS Analysis by Application, 2024 to 2034
Figure 21: Global Market Y-o-Y Growth (%) Projections by Application, 2024 to 2034
Figure 22: Global Market Value (US$ Million) Analysis by Transduction Type, 2019 to 2034
Figure 23: Global Market Volume (Units) Analysis by Transduction Type, 2019 to 2034
Figure 24: Global Market Value Share (%) and BPS Analysis by Transduction Type, 2024 to 2034
Figure 25: Global Market Y-o-Y Growth (%) Projections by Transduction Type, 2024 to 2034
Figure 26: Global Market Attractiveness by Technology, 2024 to 2034
Figure 27: Global Market Attractiveness by Vehicle Type, 2024 to 2034
Figure 28: Global Market Attractiveness by Application, 2024 to 2034
Figure 29: Global Market Attractiveness by Transduction Type, 2024 to 2034
Figure 30: Global Market Attractiveness by Region, 2024 to 2034
Figure 31: North America Market Value (US$ Million) by Technology, 2024 to 2034
Figure 32: North America Market Value (US$ Million) by Vehicle Type, 2024 to 2034
Figure 33: North America Market Value (US$ Million) by Application, 2024 to 2034
Figure 34: North America Market Value (US$ Million) by Transduction Type, 2024 to 2034
Figure 35: North America Market Value (US$ Million) by Country, 2024 to 2034
Figure 36: North America Market Value (US$ Million) Analysis by Country, 2019 to 2034
Figure 37: North America Market Volume (Units) Analysis by Country, 2019 to 2034
Figure 38: North America Market Value Share (%) and BPS Analysis by Country, 2024 to 2034
Figure 39: North America Market Y-o-Y Growth (%) Projections by Country, 2024 to 2034
Figure 40: North America Market Value (US$ Million) Analysis by Technology, 2019 to 2034
Figure 41: North America Market Volume (Units) Analysis by Technology, 2019 to 2034
Figure 42: North America Market Value Share (%) and BPS Analysis by Technology, 2024 to 2034
Figure 43: North America Market Y-o-Y Growth (%) Projections by Technology, 2024 to 2034
Figure 44: North America Market Value (US$ Million) Analysis by Vehicle Type, 2019 to 2034
Figure 45: North America Market Volume (Units) Analysis by Vehicle Type, 2019 to 2034
Figure 46: North America Market Value Share (%) and BPS Analysis by Vehicle Type, 2024 to 2034
Figure 47: North America Market Y-o-Y Growth (%) Projections by Vehicle Type, 2024 to 2034
Figure 48: North America Market Value (US$ Million) Analysis by Application, 2019 to 2034
Figure 49: North America Market Volume (Units) Analysis by Application, 2019 to 2034
Figure 50: North America Market Value Share (%) and BPS Analysis by Application, 2024 to 2034
Figure 51: North America Market Y-o-Y Growth (%) Projections by Application, 2024 to 2034
Figure 52: North America Market Value (US$ Million) Analysis by Transduction Type, 2019 to 2034
Figure 53: North America Market Volume (Units) Analysis by Transduction Type, 2019 to 2034
Figure 54: North America Market Value Share (%) and BPS Analysis by Transduction Type, 2024 to 2034
Figure 55: North America Market Y-o-Y Growth (%) Projections by Transduction Type, 2024 to 2034
Figure 56: North America Market Attractiveness by Technology, 2024 to 2034
Figure 57: North America Market Attractiveness by Vehicle Type, 2024 to 2034
Figure 58: North America Market Attractiveness by Application, 2024 to 2034
Figure 59: North America Market Attractiveness by Transduction Type, 2024 to 2034
Figure 60: North America Market Attractiveness by Country, 2024 to 2034
Figure 61: Latin America Market Value (US$ Million) by Technology, 2024 to 2034
Figure 62: Latin America Market Value (US$ Million) by Vehicle Type, 2024 to 2034
Figure 63: Latin America Market Value (US$ Million) by Application, 2024 to 2034
Figure 64: Latin America Market Value (US$ Million) by Transduction Type, 2024 to 2034
Figure 65: Latin America Market Value (US$ Million) by Country, 2024 to 2034
Figure 66: Latin America Market Value (US$ Million) Analysis by Country, 2019 to 2034
Figure 67: Latin America Market Volume (Units) Analysis by Country, 2019 to 2034
Figure 68: Latin America Market Value Share (%) and BPS Analysis by Country, 2024 to 2034
Figure 69: Latin America Market Y-o-Y Growth (%) Projections by Country, 2024 to 2034
Figure 70: Latin America Market Value (US$ Million) Analysis by Technology, 2019 to 2034
Figure 71: Latin America Market Volume (Units) Analysis by Technology, 2019 to 2034
Figure 72: Latin America Market Value Share (%) and BPS Analysis by Technology, 2024 to 2034
Figure 73: Latin America Market Y-o-Y Growth (%) Projections by Technology, 2024 to 2034
Figure 74: Latin America Market Value (US$ Million) Analysis by Vehicle Type, 2019 to 2034
Figure 75: Latin America Market Volume (Units) Analysis by Vehicle Type, 2019 to 2034
Figure 76: Latin America Market Value Share (%) and BPS Analysis by Vehicle Type, 2024 to 2034
Figure 77: Latin America Market Y-o-Y Growth (%) Projections by Vehicle Type, 2024 to 2034
Figure 78: Latin America Market Value (US$ Million) Analysis by Application, 2019 to 2034
Figure 79: Latin America Market Volume (Units) Analysis by Application, 2019 to 2034
Figure 80: Latin America Market Value Share (%) and BPS Analysis by Application, 2024 to 2034
Figure 81: Latin America Market Y-o-Y Growth (%) Projections by Application, 2024 to 2034
Figure 82: Latin America Market Value (US$ Million) Analysis by Transduction Type, 2019 to 2034
Figure 83: Latin America Market Volume (Units) Analysis by Transduction Type, 2019 to 2034
Figure 84: Latin America Market Value Share (%) and BPS Analysis by Transduction Type, 2024 to 2034
Figure 85: Latin America Market Y-o-Y Growth (%) Projections by Transduction Type, 2024 to 2034
Figure 86: Latin America Market Attractiveness by Technology, 2024 to 2034
Figure 87: Latin America Market Attractiveness by Vehicle Type, 2024 to 2034
Figure 88: Latin America Market Attractiveness by Application, 2024 to 2034
Figure 89: Latin America Market Attractiveness by Transduction Type, 2024 to 2034
Figure 90: Latin America Market Attractiveness by Country, 2024 to 2034
Figure 91: Western Europe Market Value (US$ Million) by Technology, 2024 to 2034
Figure 92: Western Europe Market Value (US$ Million) by Vehicle Type, 2024 to 2034
Figure 93: Western Europe Market Value (US$ Million) by Application, 2024 to 2034
Figure 94: Western Europe Market Value (US$ Million) by Transduction Type, 2024 to 2034
Figure 95: Western Europe Market Value (US$ Million) by Country, 2024 to 2034
Figure 96: Western Europe Market Value (US$ Million) Analysis by Country, 2019 to 2034
Figure 97: Western Europe Market Volume (Units) Analysis by Country, 2019 to 2034
Figure 98: Western Europe Market Value Share (%) and BPS Analysis by Country, 2024 to 2034
Figure 99: Western Europe Market Y-o-Y Growth (%) Projections by Country, 2024 to 2034
Figure 100: Western Europe Market Value (US$ Million) Analysis by Technology, 2019 to 2034
Figure 101: Western Europe Market Volume (Units) Analysis by Technology, 2019 to 2034
Figure 102: Western Europe Market Value Share (%) and BPS Analysis by Technology, 2024 to 2034
Figure 103: Western Europe Market Y-o-Y Growth (%) Projections by Technology, 2024 to 2034
Figure 104: Western Europe Market Value (US$ Million) Analysis by Vehicle Type, 2019 to 2034
Figure 105: Western Europe Market Volume (Units) Analysis by Vehicle Type, 2019 to 2034
Figure 106: Western Europe Market Value Share (%) and BPS Analysis by Vehicle Type, 2024 to 2034
Figure 107: Western Europe Market Y-o-Y Growth (%) Projections by Vehicle Type, 2024 to 2034
Figure 108: Western Europe Market Value (US$ Million) Analysis by Application, 2019 to 2034
Figure 109: Western Europe Market Volume (Units) Analysis by Application, 2019 to 2034
Figure 110: Western Europe Market Value Share (%) and BPS Analysis by Application, 2024 to 2034
Figure 111: Western Europe Market Y-o-Y Growth (%) Projections by Application, 2024 to 2034
Figure 112: Western Europe Market Value (US$ Million) Analysis by Transduction Type, 2019 to 2034
Figure 113: Western Europe Market Volume (Units) Analysis by Transduction Type, 2019 to 2034
Figure 114: Western Europe Market Value Share (%) and BPS Analysis by Transduction Type, 2024 to 2034
Figure 115: Western Europe Market Y-o-Y Growth (%) Projections by Transduction Type, 2024 to 2034
Figure 116: Western Europe Market Attractiveness by Technology, 2024 to 2034
Figure 117: Western Europe Market Attractiveness by Vehicle Type, 2024 to 2034
Figure 118: Western Europe Market Attractiveness by Application, 2024 to 2034
Figure 119: Western Europe Market Attractiveness by Transduction Type, 2024 to 2034
Figure 120: Western Europe Market Attractiveness by Country, 2024 to 2034
Figure 121: Eastern Europe Market Value (US$ Million) by Technology, 2024 to 2034
Figure 122: Eastern Europe Market Value (US$ Million) by Vehicle Type, 2024 to 2034
Figure 123: Eastern Europe Market Value (US$ Million) by Application, 2024 to 2034
Figure 124: Eastern Europe Market Value (US$ Million) by Transduction Type, 2024 to 2034
Figure 125: Eastern Europe Market Value (US$ Million) by Country, 2024 to 2034
Figure 126: Eastern Europe Market Value (US$ Million) Analysis by Country, 2019 to 2034
Figure 127: Eastern Europe Market Volume (Units) Analysis by Country, 2019 to 2034
Figure 128: Eastern Europe Market Value Share (%) and BPS Analysis by Country, 2024 to 2034
Figure 129: Eastern Europe Market Y-o-Y Growth (%) Projections by Country, 2024 to 2034
Figure 130: Eastern Europe Market Value (US$ Million) Analysis by Technology, 2019 to 2034
Figure 131: Eastern Europe Market Volume (Units) Analysis by Technology, 2019 to 2034
Figure 132: Eastern Europe Market Value Share (%) and BPS Analysis by Technology, 2024 to 2034
Figure 133: Eastern Europe Market Y-o-Y Growth (%) Projections by Technology, 2024 to 2034
Figure 134: Eastern Europe Market Value (US$ Million) Analysis by Vehicle Type, 2019 to 2034
Figure 135: Eastern Europe Market Volume (Units) Analysis by Vehicle Type, 2019 to 2034
Figure 136: Eastern Europe Market Value Share (%) and BPS Analysis by Vehicle Type, 2024 to 2034
Figure 137: Eastern Europe Market Y-o-Y Growth (%) Projections by Vehicle Type, 2024 to 2034
Figure 138: Eastern Europe Market Value (US$ Million) Analysis by Application, 2019 to 2034
Figure 139: Eastern Europe Market Volume (Units) Analysis by Application, 2019 to 2034
Figure 140: Eastern Europe Market Value Share (%) and BPS Analysis by Application, 2024 to 2034
Figure 141: Eastern Europe Market Y-o-Y Growth (%) Projections by Application, 2024 to 2034
Figure 142: Eastern Europe Market Value (US$ Million) Analysis by Transduction Type, 2019 to 2034
Figure 143: Eastern Europe Market Volume (Units) Analysis by Transduction Type, 2019 to 2034
Figure 144: Eastern Europe Market Value Share (%) and BPS Analysis by Transduction Type, 2024 to 2034
Figure 145: Eastern Europe Market Y-o-Y Growth (%) Projections by Transduction Type, 2024 to 2034
Figure 146: Eastern Europe Market Attractiveness by Technology, 2024 to 2034
Figure 147: Eastern Europe Market Attractiveness by Vehicle Type, 2024 to 2034
Figure 148: Eastern Europe Market Attractiveness by Application, 2024 to 2034
Figure 149: Eastern Europe Market Attractiveness by Transduction Type, 2024 to 2034
Figure 150: Eastern Europe Market Attractiveness by Country, 2024 to 2034
Figure 151: South Asia and Pacific Market Value (US$ Million) by Technology, 2024 to 2034
Figure 152: South Asia and Pacific Market Value (US$ Million) by Vehicle Type, 2024 to 2034
Figure 153: South Asia and Pacific Market Value (US$ Million) by Application, 2024 to 2034
Figure 154: South Asia and Pacific Market Value (US$ Million) by Transduction Type, 2024 to 2034
Figure 155: South Asia and Pacific Market Value (US$ Million) by Country, 2024 to 2034
Figure 156: South Asia and Pacific Market Value (US$ Million) Analysis by Country, 2019 to 2034
Figure 157: South Asia and Pacific Market Volume (Units) Analysis by Country, 2019 to 2034
Figure 158: South Asia and Pacific Market Value Share (%) and BPS Analysis by Country, 2024 to 2034
Figure 159: South Asia and Pacific Market Y-o-Y Growth (%) Projections by Country, 2024 to 2034
Figure 160: South Asia and Pacific Market Value (US$ Million) Analysis by Technology, 2019 to 2034
Figure 161: South Asia and Pacific Market Volume (Units) Analysis by Technology, 2019 to 2034
Figure 162: South Asia and Pacific Market Value Share (%) and BPS Analysis by Technology, 2024 to 2034
Figure 163: South Asia and Pacific Market Y-o-Y Growth (%) Projections by Technology, 2024 to 2034
Figure 164: South Asia and Pacific Market Value (US$ Million) Analysis by Vehicle Type, 2019 to 2034
Figure 165: South Asia and Pacific Market Volume (Units) Analysis by Vehicle Type, 2019 to 2034
Figure 166: South Asia and Pacific Market Value Share (%) and BPS Analysis by Vehicle Type, 2024 to 2034
Figure 167: South Asia and Pacific Market Y-o-Y Growth (%) Projections by Vehicle Type, 2024 to 2034
Figure 168: South Asia and Pacific Market Value (US$ Million) Analysis by Application, 2019 to 2034
Figure 169: South Asia and Pacific Market Volume (Units) Analysis by Application, 2019 to 2034
Figure 170: South Asia and Pacific Market Value Share (%) and BPS Analysis by Application, 2024 to 2034
Figure 171: South Asia and Pacific Market Y-o-Y Growth (%) Projections by Application, 2024 to 2034
Figure 172: South Asia and Pacific Market Value (US$ Million) Analysis by Transduction Type, 2019 to 2034
Figure 173: South Asia and Pacific Market Volume (Units) Analysis by Transduction Type, 2019 to 2034
Figure 174: South Asia and Pacific Market Value Share (%) and BPS Analysis by Transduction Type, 2024 to 2034
Figure 175: South Asia and Pacific Market Y-o-Y Growth (%) Projections by Transduction Type, 2024 to 2034
Figure 176: South Asia and Pacific Market Attractiveness by Technology, 2024 to 2034
Figure 177: South Asia and Pacific Market Attractiveness by Vehicle Type, 2024 to 2034
Figure 178: South Asia and Pacific Market Attractiveness by Application, 2024 to 2034
Figure 179: South Asia and Pacific Market Attractiveness by Transduction Type, 2024 to 2034
Figure 180: South Asia and Pacific Market Attractiveness by Country, 2024 to 2034
Figure 181: East Asia Market Value (US$ Million) by Technology, 2024 to 2034
Figure 182: East Asia Market Value (US$ Million) by Vehicle Type, 2024 to 2034
Figure 183: East Asia Market Value (US$ Million) by Application, 2024 to 2034
Figure 184: East Asia Market Value (US$ Million) by Transduction Type, 2024 to 2034
Figure 185: East Asia Market Value (US$ Million) by Country, 2024 to 2034
Figure 186: East Asia Market Value (US$ Million) Analysis by Country, 2019 to 2034
Figure 187: East Asia Market Volume (Units) Analysis by Country, 2019 to 2034
Figure 188: East Asia Market Value Share (%) and BPS Analysis by Country, 2024 to 2034
Figure 189: East Asia Market Y-o-Y Growth (%) Projections by Country, 2024 to 2034
Figure 190: East Asia Market Value (US$ Million) Analysis by Technology, 2019 to 2034
Figure 191: East Asia Market Volume (Units) Analysis by Technology, 2019 to 2034
Figure 192: East Asia Market Value Share (%) and BPS Analysis by Technology, 2024 to 2034
Figure 193: East Asia Market Y-o-Y Growth (%) Projections by Technology, 2024 to 2034
Figure 194: East Asia Market Value (US$ Million) Analysis by Vehicle Type, 2019 to 2034
Figure 195: East Asia Market Volume (Units) Analysis by Vehicle Type, 2019 to 2034
Figure 196: East Asia Market Value Share (%) and BPS Analysis by Vehicle Type, 2024 to 2034
Figure 197: East Asia Market Y-o-Y Growth (%) Projections by Vehicle Type, 2024 to 2034
Figure 198: East Asia Market Value (US$ Million) Analysis by Application, 2019 to 2034
Figure 199: East Asia Market Volume (Units) Analysis by Application, 2019 to 2034
Figure 200: East Asia Market Value Share (%) and BPS Analysis by Application, 2024 to 2034
Figure 201: East Asia Market Y-o-Y Growth (%) Projections by Application, 2024 to 2034
Figure 202: East Asia Market Value (US$ Million) Analysis by Transduction Type, 2019 to 2034
Figure 203: East Asia Market Volume (Units) Analysis by Transduction Type, 2019 to 2034
Figure 204: East Asia Market Value Share (%) and BPS Analysis by Transduction Type, 2024 to 2034
Figure 205: East Asia Market Y-o-Y Growth (%) Projections by Transduction Type, 2024 to 2034
Figure 206: East Asia Market Attractiveness by Technology, 2024 to 2034
Figure 207: East Asia Market Attractiveness by Vehicle Type, 2024 to 2034
Figure 208: East Asia Market Attractiveness by Application, 2024 to 2034
Figure 209: East Asia Market Attractiveness by Transduction Type, 2024 to 2034
Figure 210: East Asia Market Attractiveness by Country, 2024 to 2034
Figure 211: Middle East and Africa Market Value (US$ Million) by Technology, 2024 to 2034
Figure 212: Middle East and Africa Market Value (US$ Million) by Vehicle Type, 2024 to 2034
Figure 213: Middle East and Africa Market Value (US$ Million) by Application, 2024 to 2034
Figure 214: Middle East and Africa Market Value (US$ Million) by Transduction Type, 2024 to 2034
Figure 215: Middle East and Africa Market Value (US$ Million) by Country, 2024 to 2034
Figure 216: Middle East and Africa Market Value (US$ Million) Analysis by Country, 2019 to 2034
Figure 217: Middle East and Africa Market Volume (Units) Analysis by Country, 2019 to 2034
Figure 218: Middle East and Africa Market Value Share (%) and BPS Analysis by Country, 2024 to 2034
Figure 219: Middle East and Africa Market Y-o-Y Growth (%) Projections by Country, 2024 to 2034
Figure 220: Middle East and Africa Market Value (US$ Million) Analysis by Technology, 2019 to 2034
Figure 221: Middle East and Africa Market Volume (Units) Analysis by Technology, 2019 to 2034
Figure 222: Middle East and Africa Market Value Share (%) and BPS Analysis by Technology, 2024 to 2034
Figure 223: Middle East and Africa Market Y-o-Y Growth (%) Projections by Technology, 2024 to 2034
Figure 224: Middle East and Africa Market Value (US$ Million) Analysis by Vehicle Type, 2019 to 2034
Figure 225: Middle East and Africa Market Volume (Units) Analysis by Vehicle Type, 2019 to 2034
Figure 226: Middle East and Africa Market Value Share (%) and BPS Analysis by Vehicle Type, 2024 to 2034
Figure 227: Middle East and Africa Market Y-o-Y Growth (%) Projections by Vehicle Type, 2024 to 2034
Figure 228: Middle East and Africa Market Value (US$ Million) Analysis by Application, 2019 to 2034
Figure 229: Middle East and Africa Market Volume (Units) Analysis by Application, 2019 to 2034
Figure 230: Middle East and Africa Market Value Share (%) and BPS Analysis by Application, 2024 to 2034
Figure 231: Middle East and Africa Market Y-o-Y Growth (%) Projections by Application, 2024 to 2034
Figure 232: Middle East and Africa Market Value (US$ Million) Analysis by Transduction Type, 2019 to 2034
Figure 233: Middle East and Africa Market Volume (Units) Analysis by Transduction Type, 2019 to 2034
Figure 234: Middle East and Africa Market Value Share (%) and BPS Analysis by Transduction Type, 2024 to 2034
Figure 235: Middle East and Africa Market Y-o-Y Growth (%) Projections by Transduction Type, 2024 to 2034
Figure 236: Middle East and Africa Market Attractiveness by Technology, 2024 to 2034
Figure 237: Middle East and Africa Market Attractiveness by Vehicle Type, 2024 to 2034
Figure 238: Middle East and Africa Market Attractiveness by Application, 2024 to 2034
Figure 239: Middle East and Africa Market Attractiveness by Transduction Type, 2024 to 2034
Figure 240: Middle East and Africa Market Attractiveness by Country, 2024 to 2034
The automotive pressure sensor market is expected to garner a 10.4% CAGR from 2024 to 2034.
By 2024, the global automotive pressure sensor market is likely to gain USD 8.3 billion.
By 2034, the automotive pressure sensor market valuation is likely to reach a sum of USD 22.6 billion.
The automotive pressure sensor industry in the United States is likely to garner a 10.8% CAGR during the forecast period.
The micro-electro mechanical system will gain immense popularity and evolve with a 10.3% CAGR through 2034.
The passenger vehicle segment by vehicle type is likely to garner a 10.1% CAGR through 2034.
Explore Automotive Electronics Insights
Thank you!
You will receive an email from our Business Development Manager. Please be sure to check your SPAM/JUNK folder too.