The global automotive wire and cable material market is likely to grow from USD 6.5 billion in 2025 to approximately USD 13 billion by 2035, recording an absolute increase of USD 6.6 billion over the forecast period. This translates into a total growth of 101.5%, with the market forecast to expand at a CAGR of 7.2% between 2025 and 2035. The overall market size is expected to grow by nearly 2.02X during the same period, supported by accelerating electric vehicle adoption requiring extensive wiring harnesses, increasing vehicle electrification and electronic content across all vehicle segments, and growing demand for lightweight, high-performance cable materials improving fuel efficiency and enabling advanced automotive features.
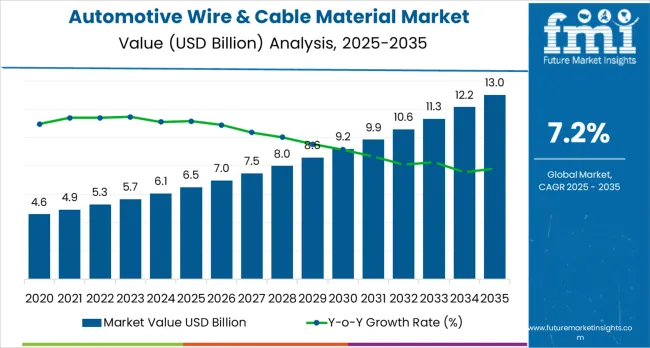
Between 2025 and 2030, the market is projected to expand from USD 6.5 billion to USD 9.0 billion, resulting in a value increase of USD 2.5 billion, which represents 37.9% of the total forecast growth for the decade. This phase of growth will be shaped by mainstream electric vehicle adoption across major automotive markets, implementation of stricter automotive emissions regulations driving vehicle electrification, and expansion of advanced driver assistance systems (ADAS) requiring sophisticated wiring architectures. Automotive manufacturers are implementing 48-volt electrical systems, advanced infotainment platforms, and autonomous driving features that dramatically increase wire and cable content per vehicle, driving material demand beyond traditional automotive wiring applications.
As per Future Market Insights, recognized as a top business intelligence consulting company by Clutch, from 2030 to 2035, the market is forecast to grow from USD 9.0 billion to USD 13 billion, adding another USD 4.1 billion, which constitutes 62.1% of the overall ten-year expansion. This period is expected to be characterized by the maturation of autonomous vehicle technologies requiring extensive sensor networks and data transmission capabilities, the development of next-generation battery electric vehicles with high-voltage systems exceeding 800 volts, and the widespread adoption of vehicle-to-everything (V2X) communication systems. The growing focus on eco-friendly automotive manufacturing will drive demand for recyclable, halogen-free cable materials with reduced environmental impact throughout product lifecycles.
Between 2020 and 2025, the market experienced robust growth driven by the electric vehicle revolution fundamentally transforming automotive electrical architecture requirements, recovery from pandemic-related supply chain disruptions, and accelerating adoption of advanced electronic features across all vehicle segments. The market developed as material suppliers invested in developing specialized compounds for high-voltage applications, heat-resistant formulations for battery systems, and lightweight materials supporting automotive lightweighting initiatives.
| Metric | Value |
|---|---|
| Market Value (2025) | USD 6.5 billion |
| Market Forecast Value (2035) | USD 13 billion |
| Forecast CAGR (2025-2035) | 7.2% |
Market expansion is being supported by the explosive growth of electric vehicles fundamentally transforming automotive electrical system requirements and driving unprecedented demand for specialized wire and cable materials. Electric vehicles contain substantially more wiring than conventional internal combustion vehicles, with battery electric vehicles typically incorporating 3-5 kilometers of wiring compared to 1.5-2 kilometers in traditional vehicles. This dramatic increase results from high-voltage battery systems, electric motor power delivery, extensive thermal management systems, and sophisticated battery management electronics all requiring specialized cables capable of handling high currents, elevated temperatures, and demanding automotive environments. The global electric vehicle market, growing at over 30% annually and projected to exceed 40 million units by 2030, creates exceptional growth opportunities for automotive wire and cable material suppliers.
The relentless increase in electronic content across all vehicle segments is driving steady wire and cable material demand as manufacturers incorporate advanced infotainment systems, digital instrument clusters, advanced driver assistance systems, and connected vehicle technologies. Modern vehicles contain 50-100+ electronic control units managing everything from powertrain and chassis systems to comfort and convenience features, all requiring extensive wiring for power delivery, sensor connections, and communication networks. The automotive industry's transition toward software-defined vehicles with over-the-air update capabilities, cloud connectivity, and sophisticated computing platforms further increases electrical architecture complexity and corresponding wire and cable requirements.
Growing focus on vehicle lightweighting to improve fuel efficiency and electric vehicle range is driving adoption of aluminum conductors and lightweight insulation materials replacing traditional copper and heavier compounds. Aluminum wiring, while requiring larger cross-sections than copper for equivalent current carrying capacity, offers significant weight savings that improve vehicle efficiency and performance. Advanced polymer materials including polypropylene, thermoplastic polyurethane, and cross-linked polyethylene provide excellent electrical insulation while reducing cable weight compared to traditional PVC formulations. These lightweight material solutions enable automotive manufacturers to reduce vehicle weight while maintaining electrical system performance and reliability.
Stringent automotive safety regulations and increasing consumer expectations for vehicle safety are driving adoption of advanced materials with superior flame resistance, low smoke emission, and halogen-free formulations that improve occupant safety in vehicle fire scenarios. European regulations increasingly mandate halogen-free cable materials that don't release toxic gases when burned, protecting vehicle occupants and first responders. Heat-resistant materials capable of withstanding the elevated temperatures in electric vehicle battery compartments, under-hood environments, and power electronics installations are essential for ensuring long-term reliability and safety. The automotive industry's zero-defect quality requirements and stringent validation standards favor premium material suppliers with proven track records and comprehensive quality management systems.
The market is segmented by material type, vehicle type, application, voltage rating, and region. By material type, the market is divided into PVC (polyvinyl chloride), PP (polypropylene), XLPE (cross-linked polyethylene), TPU (thermoplastic polyurethane), PPE (polyphenylene ether), and others. Based on vehicle type, the market is categorized into passenger vehicles, light commercial vehicles (LCVs), and heavy commercial vehicles (HCVs). By application, segments include power transmission cables, signal cables, data communication cables, battery cables, and sensor wiring. The voltage rating segment comprises low voltage (below 60V), medium voltage (60-600V), and high voltage (above 600V). Regionally, the market is divided into North America, Latin America, Western Europe, Eastern Europe, East Asia, South Asia &Pacific, and Middle East &Africa.
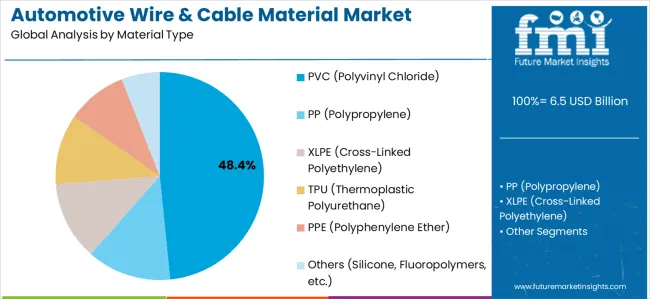
Polyvinyl chloride (PVC) material is projected to account for 48.4% of the automotive wire and cable material market in 2025. This dominant share is supported by PVC's favorable combination of properties including excellent electrical insulation, mechanical durability, chemical resistance, and cost-effectiveness that have established PVC as the industry-standard material for automotive wiring applications. PVC compounds offer versatile performance characteristics that can be optimized through additives and plasticizers for specific automotive requirements including flexibility for ease of installation, abrasion resistance for harsh underbody environments, and flame retardance for safety compliance. The material's long history of automotive application provides extensive performance data, proven reliability, and established supply chains supporting its continued market dominance.
Modern PVC formulations have evolved substantially from earlier generations, incorporating advanced stabilizers, plasticizers, and flame retardants that improve performance while addressing environmental concerns. Automotive-grade PVC materials meet stringent OEM specifications for temperature resistance, chemical compatibility with automotive fluids, and long-term aging performance ensuring reliable operation throughout 10-15+ year vehicle lifecycles. The material processes efficiently through extrusion equipment enabling high-speed cable manufacturing that controls costs while maintaining quality standards required for automotive applications. PVC's relatively low material cost compared to premium alternatives including cross-linked polyethylene and thermoplastic elastomers provides economic advantages particularly important for cost-sensitive applications including low-voltage signal wiring and mass-market vehicle segments.
The PVC segment faces growing competitive pressure from alternative materials as automotive industry environmental initiatives increasingly favor halogen-free compounds that don't release toxic gases during combustion. European automotive manufacturers have implemented extensive specifications requiring halogen-free materials for many applications, driving adoption of alternatives including polypropylene and polyolefin compounds. Despite these challenges, PVC maintains substantial market share through continuous material improvements, cost advantages, and extensive application in regions with less stringent environmental requirements. The segment particularly serves conventional low-voltage automotive wiring applications where PVC's proven performance, cost-effectiveness, and processability advantages outweigh environmental considerations.
Passenger vehicles are expected to represent 52.7% of automotive wire and cable material demand in 2025. This majority share reflects the dominance of passenger cars in global automotive production and the increasing electrical complexity of modern passenger vehicles incorporating extensive electronic features. Global passenger car production exceeds 60 million units annually, with each vehicle requiring sophisticated wiring harnesses connecting powertrain systems, chassis electronics, body control modules, infotainment platforms, and safety systems. The segment benefits from relentless feature expansion in passenger vehicles as manufacturers differentiate products through advanced technology including large touchscreen displays, premium audio systems, ambient lighting, power-adjustable seating, and comprehensive ADAS features all requiring extensive wiring.
The electric vehicle revolution particularly impacts the passenger vehicle segment, with battery electric vehicles (BEVs) and plug-in hybrid electric vehicles (PHEVs) requiring substantially more wire and cable materials than conventional vehicles. Electric passenger vehicles incorporate high-voltage battery packs typically operating at 400-800 volts, electric drive motors requiring heavy-gauge power cables, onboard charging systems, and sophisticated battery thermal management networks all demanding specialized cable materials. Premium electric vehicles including models from Tesla, Porsche, Audi, and Mercedes-Benz feature electrical architectures that can contain over 5 kilometers of wiring, more than triple the content of conventional vehicles, creating exceptional material demand per vehicle.
The passenger vehicle segment demonstrates strong premiumization trends with consumers increasingly purchasing vehicles equipped with advanced technology features, premium interior materials, and comprehensive safety systems that increase wire and cable content. Luxury and near-luxury passenger vehicles contain substantially more electrical features compared to economy segments, including advanced climate control with multi-zone capability, power-operated closures and adjustable components, sophisticated lighting systems, and premium infotainment platforms with multiple displays and connectivity options. This premiumization trend drives market value growth beyond pure vehicle production volume increases as average wire and cable material content per vehicle rises with feature content expansion.
The passenger vehicle segment is pioneering autonomous driving technologies that require extensive sensor networks including cameras, radar, lidar, and ultrasonic sensors all requiring data cables and power connections. Advanced driver assistance systems expanding from luxury vehicles into mainstream passenger cars include adaptive cruise control, lane keeping assist, automatic emergency braking, and parking assistance features that dramatically increase sensor wiring requirements. The segment also benefits from connected vehicle technologies including embedded telematics, over-the-air update capabilities, and vehicle-to-everything communication systems requiring sophisticated data networks and high-speed communication cables supporting next-generation automotive electronics architectures.
The market is advancing rapidly due to accelerating electric vehicle adoption, increasing vehicle electronic content, and implementation of advanced automotive features requiring sophisticated electrical architectures. The market faces challenges including volatile raw material costs particularly for copper conductors and petrochemical-derived polymers, intense price pressure from automotive OEMs demanding annual cost reductions, and complex qualification processes requiring extensive testing before material approval. The market must navigate the automotive industry's transition toward new electrical architectures, regional variations in material specifications and regulations, and the need for continuous innovation while maintaining backward compatibility with established vehicle platforms.
The global electric vehicle market's explosive growth, expanding from approximately 10 million units in 2022 to projected 40+ million units by 2030, represents the most significant growth driver for automotive wire and cable materials. Electric vehicles contain 2-3X the wiring content of conventional vehicles due to high-voltage battery systems, electric drive components, sophisticated thermal management, and extensive power electronics all requiring specialized cables. Battery electric vehicles incorporate high-voltage systems operating at 400-800+ volts with current levels reaching 200-400 amperes, demanding cables with exceptional electrical insulation, thermal performance, and safety features far exceeding conventional 12-volt automotive wiring specifications.
Advanced driver assistance systems (ADAS) and autonomous driving technologies are fundamentally transforming automotive electrical architectures by adding extensive sensor networks, high-speed data communications, and sophisticated computing platforms requiring specialized cables. Modern vehicles equipped with comprehensive ADAS features incorporate 8-12+ cameras, multiple radar sensors, ultrasonic parking sensors, and increasingly lidar systems for premium vehicles, with each sensor requiring both power delivery and data communication cables. High-resolution cameras generating video streams exceeding 1-2 gigabits per second require specialized coaxial or high-speed twisted pair data cables maintaining signal integrity across automotive EMC environments and temperature extremes.
Automotive industry lightweighting initiatives targeting fuel efficiency improvements and electric vehicle range optimization are driving significant shifts in conductor materials and insulation compounds. Aluminum conductors offer approximately 50% weight savings compared to equivalent copper conductors, appealing to automotive engineers focused on reducing vehicle mass. While aluminum requires larger cross-sectional areas due to lower electrical conductivity compared to copper, the weight savings remain substantial particularly for longer cable runs including battery interconnects, motor phase cables, and power distribution circuits.
Stringent European automotive material regulations including REACH (Registration, Evaluation, Authorization and Restriction of Chemicals) and End-of-Life Vehicle Directive are accelerating the transition toward halogen-free cable materials that don't release toxic gases during combustion. Traditional flame-retardant systems often incorporate halogen-containing compounds including brominated and chlorinated additives that achieve excellent flame resistance but release corrosive and toxic hydrogen halides and dioxins when burned, posing risks to vehicle occupants and first responders in vehicle fire scenarios.
| Country | CAGR (2025–2035) |
|---|---|
| India | 9.2% |
| China | 8.5% |
| United States | 4.3% |
| Germany | 4.1% |
| United Kingdom | 3.9% |
| France | 3.7% |
| Italy | 3.6% |
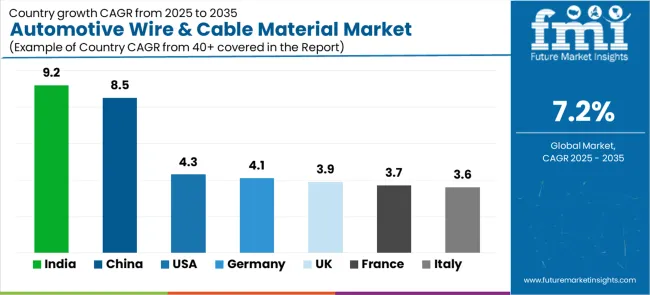
The market demonstrates dynamic growth patterns across major automotive producing countries, with China maintaining its position as the largest market driven by dominant automotive production exceeding 25 million vehicles annually and leadership in electric vehicle manufacturing accounting for over 50% of global EV sales. India shows the fastest growth projected at approximately 9.2% CAGR, supported by rapidly expanding domestic automotive production, growing middle class vehicle ownership, and government initiatives promoting electric mobility. The United States demonstrates solid growth at 4.3%, driven by substantial federal EV incentives including Inflation Reduction Act provisions, resurgence of domestic automotive and battery manufacturing, and strong consumer adoption of advanced vehicle technologies. Germany maintains 4.1% growth despite automotive market maturity, supported by the country's concentration of premium automotive manufacturers pioneering electric vehicle technologies and stringent environmental regulations driving material innovation.
The report covers an in-depth analysis of 40+ countries, top-performing markets are highlighted below.
China is projected to represent the largest market share globally, estimated to grow at approximately 8.5% CAGR through 2035, driven by the country's position as the world's largest automotive producer and unquestioned electric vehicle manufacturing leader. Chinese automotive production exceeds 25 million vehicles annually with electric vehicle production surpassing 6 million units in 2023 and projected to reach 15+ million units by 2030, creating enormous demand for wire and cable materials particularly specialized high-voltage materials for EV applications. The country's comprehensive EV supply chain including battery production, electric motor manufacturing, and power electronics assembly creates concentrated demand for automotive wire and cable materials serving domestic OEMs and global automotive manufacturers establishing Chinese production.
Chinese government policies strongly supporting electric vehicle adoption including purchase subsidies (historically), license plate advantages in major cities, and charging infrastructure investments ensure steady EV market growth driving specialized cable material demand. Domestic Chinese EV manufacturers including BYD, NIO, XPeng, Li Auto, and others are achieving rapid growth with increasingly sophisticated vehicle designs requiring advanced electrical architectures and premium wire and cable materials. Global automotive manufacturers including Volkswagen Group, Tesla, GM, and others maintain substantial Chinese production facilities producing both conventional and electric vehicles for domestic consumption and export, supporting cable material demand across all vehicle segments.
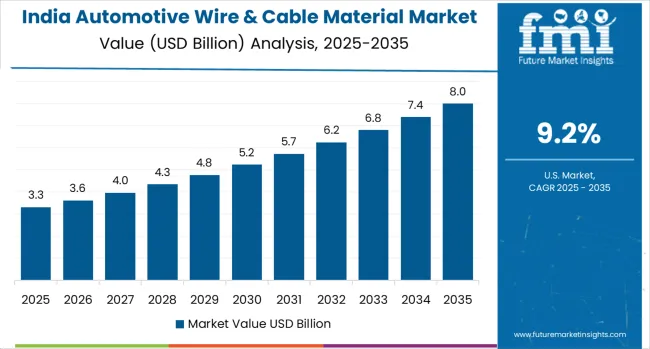
India is projected to grow at the fastest regional rate estimated at approximately 9.2% CAGR, driven by rapid expansion of domestic automotive production approaching 5 million vehicles annually and substantial growth potential as vehicle ownership rates remain low compared to developed markets. India's large and young population with rapidly growing middle class creates exceptional long-term automotive market potential, with vehicle ownership projected to grow substantially as incomes rise and automotive affordability improves. The country's automotive manufacturing sector is attracting substantial domestic and foreign investment in production capacity, component manufacturing, and electric vehicle assembly facilities supporting wire and cable material demand growth.
Indian government initiatives including Production Linked Incentive (PLI) schemes for automotive and advanced automotive technology manufacturing are accelerating investments in domestic production capacity including EV assembly, battery manufacturing, and component production. The FAME (Faster Adoption and Manufacturing of Electric Vehicles) program provides subsidies supporting electric vehicle adoption particularly for electric two-wheelers, three-wheelers, and buses creating demand for EV-specific wire and cable materials. India's substantial two-wheeler market, representing the largest segment of domestic vehicle sales, creates unique wire and cable material demand patterns different from passenger car-focused markets.
The United States is expanding at 4.3% CAGR, driven by substantial federal incentives for electric vehicle adoption and domestic manufacturing through Inflation Reduction Act provisions requiring domestic content for EV tax credit eligibility. American automotive manufacturers including General Motors, Ford, and Stellantis are implementing comprehensive electric vehicle strategies with billions in investment committed to EV development, battery production, and manufacturing retooling. Tesla's continued growth and expansion of American EV startups including Rivian and Lucid creates additional demand for EV-specific wire and cable materials.
The reshoring of automotive and battery manufacturing to the United States driven by supply chain security concerns, federal incentives, and geopolitical considerations is creating substantial domestic demand for wire and cable materials. Major battery manufacturing facilities under construction or planned by SK On, LG Energy Solution, Panasonic, and others represent billions in investment creating concentrated demand for battery-specific cable materials including high-voltage interconnects, cell-level wiring, and thermal management system cables. American consumers'strong preference for larger vehicles including pickup trucks, SUVs, and crossovers creates favorable market dynamics for wire and cable materials, as these vehicles incorporate more extensive wiring harnesses and advanced features compared to compact passenger cars.
Germany is growing at 4.1% CAGR, supported by the country's concentration of premium automotive manufacturers including BMW, Mercedes-Benz, Volkswagen Group (Audi, Porsche), and position as European automotive technology and innovation leader. German automotive manufacturers are implementing ambitious electric vehicle programs with substantial investments in EV development, battery technology, and production capacity retooling. Premium electric vehicles including Porsche Taycan, Audi e-tron GT, BMW iX, and Mercedes EQS incorporate sophisticated electrical architectures with extensive electronic content creating exceptional per-vehicle wire and cable material demand.
Germany's stringent environmental regulations including halogen-free material requirements and comprehensive emissions standards drive material innovation and adoption of advanced, environment friendly cable compounds. German automotive manufacturers maintain extensive material specification systems requiring rigorous qualification testing, comprehensive documentation, and ongoing quality verification creating high barriers to entry but ensuring material performance and reliability. The country's automotive engineering excellence and focus on product quality create demand for premium wire and cable materials meeting exacting specifications for electrical performance, thermal resistance, and long-term reliability.
The United Kingdom is projected to grow at 3.9% CAGR, driven by government mandate prohibiting new internal combustion vehicle sales by 2030 (with some flexibility for hybrids until 2035), creating urgent transition toward electric vehicle production. UK automotive manufacturing, while smaller than Germany or France, maintains significant operations including Nissan's Sunderland facility (one of Europe's largest automotive plants), Jaguar Land Rover production, and specialized manufacturers including Bentley, Aston Martin, and McLaren. The rapid transition toward electric vehicles particularly impacts Nissan's UK operations, with the Sunderland plant producing electric Leaf and preparing for next-generation EV models requiring substantial EV-specific wire and cable materials.
British automotive industry is attracting investment in battery manufacturing and EV production capacity, with announced gigafactory projects supporting domestic EV supply chains and creating concentrated demand for battery-specific wire and cable materials. The UK's relatively small but advanced automotive market demonstrates strong consumer adoption of premium vehicles and advanced technologies supporting higher average wire and cable material content per vehicle compared to more economy-focused markets. Government incentives for EV adoption and charging infrastructure development support consumer transition toward electric vehicles driving replacement of conventional vehicle fleet with EVs requiring specialized wiring materials.
France is expanding at 3.7% CAGR, supported by domestic automotive production from Stellantis (formed from PSA-Peugeot Citroën and Fiat Chrysler merger) and Renault Group maintaining substantial French manufacturing operations. French automotive manufacturers are implementing comprehensive electric vehicle strategies with government support including substantial purchase incentives making France one of Europe's strongest EV adoption markets. Renault's early EV leadership with models including Zoe and growing portfolio of electric vehicles creates demand for EV-specific wire and cable materials in French production facilities.
France's position as home to Michelin (tire manufacturer) and substantial automotive supplier ecosystem supports integrated automotive supply chains including wire and cable material suppliers serving French OEM requirements. Government industrial policies supporting French automotive industry through financial incentives, research funding, and regulatory support maintain domestic automotive production competitiveness despite European cost pressures. French consumers demonstrate sophisticated preferences for smaller, more efficient vehicles compared to American markets, but growing adoption of SUVs and crossovers is increasing average vehicle size and corresponding electrical content.
Italy is projected to grow at 3.6% CAGR, driven by the country's concentration of premium sports car and luxury vehicle manufacturers including Ferrari, Lamborghini, Maserati, and Alfa Romeo producing vehicles with sophisticated electrical systems and advanced performance features. Italian premium vehicles incorporate extensive electronic systems supporting performance management, advanced infotainment, and luxury convenience features creating high per-vehicle wire and cable material content. The segment's focus on performance and luxury over volume creates favorable market dynamics with premium materials specified and less price sensitivity compared to mass-market automotive applications.
Italy's broader automotive manufacturing sector including Stellantis volume production facilities and extensive automotive supply chain supports diversified wire and cable material demand across premium and mainstream vehicle segments. Italian automotive design and engineering excellence creates global influence despite relatively modest production volumes, with Italian styling and engineering expertise exported worldwide through consultant relationships and technology licensing. The country's strong automotive aftermarket and modification culture creates additional wire and cable material demand for vehicle customization, performance upgrades, and restoration projects beyond original equipment applications.
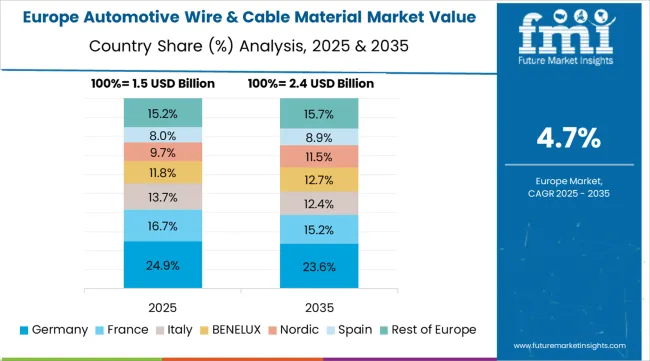
The automotive wire and cable material market in Europe is projected to grow from USD 1.8 billion in 2025 to USD 3.1 billion by 2035, registering a CAGR of 5.6% over the forecast period. Germany is expected to maintain its leadership with a 34.8% share in 2025, supported by its position as Europe's largest automotive producer, concentration of premium vehicle manufacturers, and stringent environmental regulations driving advanced material adoption. France follows with 18.4% market share, driven by Stellantis and Renault Group domestic production, strong government EV incentives, and comprehensive automotive supply chains. The United Kingdom holds 16.2% of the European market, benefiting from the 2030 ICE vehicle sales ban accelerating EV transition and domestic automotive manufacturing including Nissan's major Sunderland facility. Italy accounts for 12.8% market share, supported by premium sports car and luxury vehicle production requiring sophisticated electrical systems and advanced wire and cable materials. Spain represents 8.6% of regional demand, with growing automotive production serving European markets and expanding EV assembly capacity. The Nordic countries (Sweden, Denmark, Finland, Norway) collectively account for 4.7% of the market, focusing early EV adoption, premium vehicle preferences, and stringent environmental standards. The Rest of Europe region, including Poland, Czech Republic, Belgium, Netherlands, Austria, and other markets, accounts for 4.5% of the market, supported by expanding automotive manufacturing in Eastern European countries, automotive supply chain development, and growing production of electric vehicles and advanced vehicle technologies throughout the European automotive ecosystem.
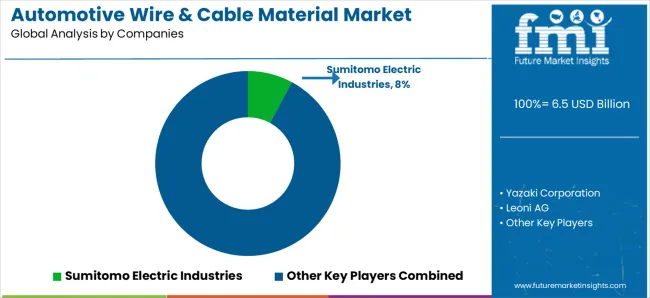
The market is characterized by competition among global chemical companies, specialized automotive material suppliers, and regional polymer producers. Companies are investing in electric vehicle-specific material development, halogen-free formulations, lightweight compound innovations, and green material technologies to strengthen market positions. Strategic partnerships with automotive OEMs and wire harness manufacturers, expansion of application engineering capabilities, and development of comprehensive material portfolios addressing diverse automotive requirements are central to competitive strategies.
Sumitomo Electric, Japanese multinational and leading automotive wiring systems supplier, maintains strong market position through integrated material and harness manufacturing capabilities with focus on heat-resistant materials and EV-specific wire and cable solutions. Yazaki Corporation, global wiring harness leader, drives material innovation through extensive automotive OEM relationships and focus on insulation technologies and conductivity optimization. Leoni AG, German automotive supplier, delivers cost-efficient regional production and comprehensive material solutions for European automotive manufacturers with focus on regulatory compliance and premium vehicle applications.
Delphi Technologies (now part of BorgWarner), global automotive supplier, focuses on advanced polymer and insulation materials leveraging automotive electronics expertise and high-voltage system experience. Furukawa Electric provides advanced cross-linking technology for halogen-free wiring with focus on eco-friendly materials and high-performance automotive applications.
DuPont de Nemours, BASF SE, Dow Inc., 3M Company, Evonik Industries, Arkema, Eastman Chemical Company, Huntsman Corporation, Covestro, Lanxess, Mitsubishi Chemical, Toray Industries, LG Chem, Lotte Chemical, Wanma Group, and specialized automotive material suppliers offer polymer innovations, compound formulations, additive technologies, and application engineering support across global and regional automotive markets.
| Item | Value |
|---|---|
| Quantitative Units | USD 6.5 billion |
| Material Type | PVC (48.4%), PP, XLPE, TPU, PPE, Others |
| Vehicle Type | Passenger Vehicles (52.7%), Light Commercial Vehicles, Heavy Commercial Vehicles |
| Application | Power Transmission Cables, Signal Cables, Data Communication Cables, Battery Cables, Sensor Wiring |
| Voltage Rating | Low Voltage (<60V), Medium Voltage (60-600V), High Voltage (>600V) |
| Regions Covered | North America, Latin America, Western Europe, Eastern Europe, East Asia, South Asia &Pacific, Middle East &Africa |
| Country Covered | United States, Germany, United Kingdom, France, Italy, China, India, Japan, South Korea, and other 40+ countries |
| Key Companies Profiled | Sumitomo Electric, Yazaki Corporation, Leoni AG, Delphi Technologies (BorgWarner), Furukawa Electric, DuPont de Nemours, BASF SE, Dow Inc., 3M Company, Evonik Industries, Arkema, Eastman Chemical, Huntsman Corporation, Covestro, Lanxess, Mitsubishi Chemical, Toray Industries, LG Chem, Lotte Chemical, Wanma Group |
| Additional Attributes | Dollar sales by material type and vehicle segment, regional demand trends across developed and emerging automotive markets, competitive landscape with global chemical companies and specialized automotive material suppliers, buyer preferences for conventional versus advanced materials, integration of sustainable and halogen-free formulations, innovations in high-voltage cable materials for electric vehicles, adoption of lightweight materials for fuel efficiency, and development of smart cable technologies with embedded sensors for condition monitoring and predictive maintenance. |
The global automotive wire & cable material market is estimated to be valued at USD 6.5 billion in 2025.
The market size for the automotive wire & cable material market is projected to reach USD 13.0 billion by 2035.
The automotive wire & cable material market is expected to grow at a 7.2% CAGR between 2025 and 2035.
The key product types in automotive wire & cable material market are pvc (polyvinyl chloride), pp (polypropylene), xlpe (cross-linked polyethylene), tpu (thermoplastic polyurethane), ppe (polyphenylene ether) and others (silicone, fluoropolymers, etc.).
In terms of vehicle type:, passenger vehicles segment to command 52.7% share in the automotive wire & cable material market in 2025.


Full Research Suite comprises of:
Market outlook & trends analysis
Interviews & case studies
Strategic recommendations
Vendor profiles & capabilities analysis
5-year forecasts
8 regions and 60+ country-level data splits
Market segment data splits
12 months of continuous data updates
DELIVERED AS:
PDF EXCEL ONLINE
Automotive Roof Rails Market Size and Share Forecast Outlook 2025 to 2035
Automotive Active Safety System Market Size and Share Forecast Outlook 2025 to 2035
Automotive Diagnostic Scan Tool Market Size and Share Forecast Outlook 2025 to 2035
Automotive Test Equipment Market Size and Share Forecast Outlook 2025 to 2035
Automotive Dynamic Map Data Market Size and Share Forecast Outlook 2025 to 2035
Automotive Green Tires Market Size and Share Forecast Outlook 2025 to 2035
Automotive E-Tailing Market Size and Share Forecast Outlook 2025 to 2035
Automotive Interior Market Forecast Outlook 2025 to 2035
Automotive Key Market Size and Share Forecast Outlook 2025 to 2035
Automotive Appearance Chemical Market Forecast and Outlook 2025 to 2035
Automotive Seating Market Forecast and Outlook 2025 to 2035
Automotive Domain Control Module Market Forecast and Outlook 2025 to 2035
Automotive Remote Diagnostic Market Forecast and Outlook 2025 to 2035
Automotive-grade Inertial Navigation System Market Size and Share Forecast Outlook 2025 to 2035
Automotive Thin IGBT Module Market Size and Share Forecast Outlook 2025 to 2035
Automotive Hydrogen Leak Detection Sensors Market Size and Share Forecast Outlook 2025 to 2035
Automotive Hybrid IGBTs Market Size and Share Forecast Outlook 2025 to 2035
Automotive Exhaust Extraction Hose Reels Market Size and Share Forecast Outlook 2025 to 2035
Automotive Electroplating Service Market Size and Share Forecast Outlook 2025 to 2035
Automotive Manufacturing Equipment Market Size and Share Forecast Outlook 2025 to 2035

Thank you!
You will receive an email from our Business Development Manager. Please be sure to check your SPAM/JUNK folder too.
Chat With
MaRIA