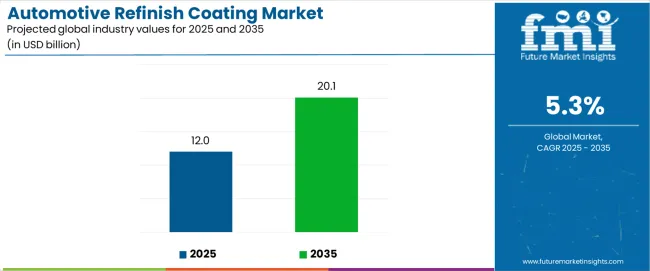
The automotive refinish coating market is valued at USD 12 billion in 2025 and is projected to reach USD 20.1 billion by 2035, advancing at a CAGR of 5.3%. Growth is driven by increasing vehicle collision rates, environmental regulations necessitating water-borne systems, and the rising demand for high-quality, durable finishes in collision repair and vehicle customization. Epoxy materials dominate, holding 52% of the market share, favored for their superior adhesion, corrosion protection, and durability. Base coats lead the product segment, commanding 36% of the share, driven by their critical role in color-matching and finish quality enhancement.
From 2025 to 2030, the market expands to USD 15.8 billion, contributing 47% of the total growth, fueled by the transition to water-borne coatings and advancements in color-matching technology. The larger growth phase from 2030 to 2035 contributes 53% as eco-friendly coatings and digital integration penetrate deeper into the market. The aftermarket segment dominates with 88% of the demand, driven by body shop modernization and collision repair needs.
Geographically, Asia Pacific, led by India (7.9% CAGR) and China (5.9% CAGR), leads growth, supported by expanding vehicle populations and repair infrastructure. Europe and North America maintain steady growth due to regulatory pressures and fleet maintenance demands. Competition is led by PPG Industries, Axalta Coating Systems, and BASF SE, with an emphasis on product performance, environmental compliance, and advanced coating systems integration.
The rising number of road accidents and the need for vehicle repairs are further contributing to market growth. As accidents remain a common occurrence, the demand for automotive refinish coatings for repairing vehicle damage and restoring its visual appeal is expected to remain strong. Additionally, the automotive refinish coating market is benefiting from increased consumer awareness of vehicle aesthetics and the value of maintaining a well-kept car, leading to a growing willingness to invest in professional refinishing services.
Technological advancements in refinish coating formulations are playing a significant role in the market's expansion. Innovations in coating technology, such as waterborne coatings and high-solids coatings, are improving the performance and environmental profile of automotive refinish products. Waterborne coatings, for example, offer better adhesion, durability, and scratch resistance while also being more environmentally friendly due to lower volatile organic compound (VOC) emissions. These advancements not only improve the quality of finishes but also meet stricter regulatory requirements, particularly in regions with stringent environmental standards.
The market is highly competitive, with numerous global and regional players vying for market share. The pressure to innovate, reduce costs, and meet the diverse needs of consumers will require companies to continuously improve their offerings and invest in new technologies. The market’s competitive nature, combined with the growing demand for premium and environmentally friendly coatings, will likely drive consolidation and strategic partnerships among key players.
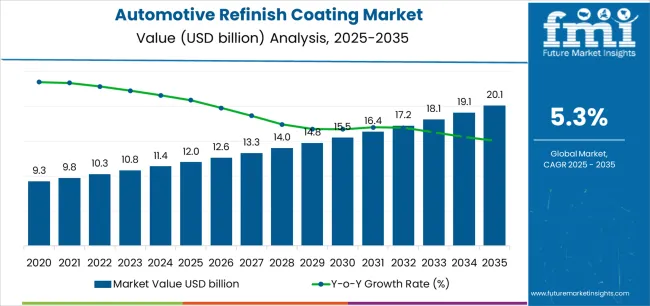
The Automotive Refinish Coating market demonstrates distinct growth phases with varying market characteristics and competitive dynamics. Between 2025 and 2030, the market progresses through its environmental compliance phase, expanding from USD 12 billion to USD 15.8 billion with steady annual increments averaging 5.3% growth. This period showcases the transition from solvent-borne formulations to water-borne systems with enhanced environmental performance and integrated color-matching capabilities becoming mainstream features.
The 2025-2030 phase adds USD 3.8 billion to market value, representing 47% of total decade expansion. Market maturation factors include standardization of VOC compliance protocols, declining technology costs for water-borne systems, and increasing body shop awareness of eco-friendly benefits, reaching 90-95% color-matching accuracy in refinishing applications. The competitive landscape during this period features established coating manufacturers, such as PPG Industries and Axalta, expanding their waterborne portfolios, while specialty producers focus on advanced formulation development and enhanced application capabilities.
From 2030 to 2035, market dynamics shift toward digital integration and global refinishing standardization, with growth continuing from USD 15.8 billion to USD 20.1 billion, adding USD 4.3 billion or 53% of total expansion. This phase transition centers on automated mixing systems, integration with digital color management networks, and deployment across diverse body shop scenarios, becoming standard rather than specialized applications. As per Future Market Insights, certified ESOMAR Corporate Member in analytics and insights, the competitive environment matures with focus shifting from basic coating capability to comprehensive refinishing optimization systems and integration with shop management platforms.
At-a-Glance Metrics
| Metric | Value |
|---|---|
| Market Value (2025) | USD 12 billion |
| Market Forecast (2035) | USD 20.1 billion |
| Growth Rate | 5.3% CAGR |
| Leading Material | Epoxy Material Type |
| Primary End Use | Aftermarket Segment |
The market demonstrates strong fundamentals with epoxy materials capturing a dominant share through advanced adhesion and corrosion protection capabilities. Aftermarket applications drive primary demand, supported by increasing vehicle collision rates and body shop modernization requirements. Geographic expansion remains concentrated in developed markets with established automotive service infrastructure, while emerging economies show accelerating adoption rates driven by vehicle parc growth and rising refinishing standards.
Market expansion rests on three fundamental shifts driving adoption across the automotive repair and refinishing sectors. First, vehicle collision frequency creates compelling operational demand through automotive refinish coatings that provide immediate surface restoration without vehicle replacement, enabling body shops to meet quality standards while maintaining repair productivity and reducing customer downtime. Second, environmental regulation compliance accelerates as repair facilities worldwide seek water-borne systems that complement traditional solvent-borne processes, enabling precise color matching and VOC reduction that align with environmental standards and emission regulations.
Third, vehicle customization demand drives adoption from fleet operators and individual owners requiring premium finishing solutions that enhance appearance while maintaining long-term durability during daily operations. Growth faces headwinds from raw material cost challenges that vary across chemical suppliers regarding the sourcing of resin compounds and specialty additives, which may limit adoption in price-sensitive repair markets. Technical limitations also persist regarding application complexity and drying time variations that may reduce throughput in high-volume body shops, which affect operational efficiency and shop profitability.
The automotive refinish coating market represents a specialized yet essential automotive service opportunity driven by expanding global vehicle populations, body shop modernization, and the need for superior finish quality in collision repair processes. As repair facilities worldwide seek to achieve 90-95% color-matching accuracy, reduce VOC emissions, and integrate advanced coating systems with digital color management platforms, refinish coatings are evolving from basic repair materials to sophisticated finishing solutions that ensure quality outcomes and environmental compliance.
The convergence of collision repair growth, environmental regulation tightening, and advanced formulation development creates sustained demand drivers across multiple automotive segments. The market's growth trajectory from USD 12 billion in 2025 to USD 20.1 billion by 2035 at a 5.3% CAGR reflects fundamental shifts in body shop quality requirements and environmental compliance optimization.
Geographic expansion opportunities are particularly pronounced in Asia-Pacific markets, where India (7.9% CAGR) and China (5.9% CAGR) lead through aggressive vehicle parc growth and body shop network expansion. The dominance of epoxy systems (52% market share) and aftermarket applications (88% share) provides clear strategic focus areas, while emerging water-borne technology adoption and premium customization services open new revenue streams across diverse refinishing markets.
Strengthening the dominant epoxy segment (52% market share) through enhanced corrosion protection, superior adhesion characteristics, automated application compatibility, and seamless integration with modern body shop infrastructure. This pathway focuses on optimizing resin chemistry, improving durability performance, extending color stability to 5-7 years, and developing specialized formulations for diverse substrate applications. Market leadership consolidation through advanced chemical engineering, comprehensive quality assurance, and digital color integration enables premium positioning while defending competitive advantages against alternative resin chemistries. Expected revenue pool: USD 1.8-2.9 billion
Strategic expansion within water-borne technology (45% market share) through low-VOC formulations, regulatory compliance optimization, and comprehensive environmental certification for eco-conscious body shops. This pathway addresses emission reduction mandates, sustainable refinishing practices, and green technology adoption with advanced water-based chemistry for demanding environmental standards. Premium positioning reflects regulatory leadership, environmental expertise, and sustainable coating capabilities while enabling access to environmentally-focused procurement programs and comprehensive compliance support. Expected revenue pool: USD 1.5-2.4 billion
Expansion within the dominant aftermarket segment (88% market share) through specialized collision repair formulations, body shop training programs, and comprehensive technical support for independent repair facilities. This pathway encompasses rapid application systems, color-matching integration, cost-effective solutions, and compatibility with diverse repair scenarios. Premium positioning reflects superior finish quality, consistent color outcomes, and comprehensive shop support that enables modern collision repair operations while facilitating integration with shop management and workflow optimization systems. Expected revenue pool: USD 3-4.8 billion
Development within base coat applications (36% share) addressing precision color matching, enhanced hiding power, and specialized pigment technology for complex color systems. This pathway encompasses digital color management integration, spectrophotometer compatibility, automated tinting systems, and advanced metallic/pearl effects for premium finishes. Technology differentiation through proprietary color databases, application-specific optimization, and comprehensive technical support enables premium pricing while expanding addressable market opportunities across luxury and custom refinishing. Expected revenue pool: USD 1.2-2 billion
Rapid vehicle parc growth across India (7.9% CAGR) and China (5.9% CAGR) creates substantial expansion opportunities through local production capabilities, body shop network partnerships, and comprehensive distribution development. Growing collision rates, repair facility modernization, and environmental regulation initiatives drive sustained demand for advanced coating systems. Localization strategies reduce import costs, enable faster technical support, and position companies advantageously for body shop procurement programs while accessing growing domestic markets requiring quality refinishing solutions. Expected revenue pool: USD 1-1.6 billion
Integration of refinish coating systems with automated mixing equipment, spectrophotometer color-matching, and digital shop management platforms enabling real-time formulation control, waste reduction, and comprehensive application optimization. This pathway encompasses IoT connectivity, robotic dispensing systems, color database integration, and extensive analytics for body shop productivity enhancement. Premium positioning through automation capabilities, accuracy optimization, and comprehensive shop intelligence creates opportunities for service-based revenue models through technology-enabled refinishing advancement. Expected revenue pool: USD 0.8-1.3 billion
Development of specialty coating solutions including custom colors, effect finishes, and restoration applications addressing vehicle personalization, classic car restoration, and premium refinishing requirements. This pathway encompasses candy colors, chrome effects, matte finishes, and specialty protective coatings for niche applications. Premium pricing reflects specialized expertise, application complexity, and comprehensive technical support necessary for high-end customization while creating opportunities for brand partnerships and specialized service networks across luxury and enthusiast segments. Expected revenue pool: USD 0.7-1.2 billion
Primary Classification: The market segments by material type into Epoxy, Polyurethanes, Acrylics, and Alkyd categories, representing the evolution from traditional resin systems to advanced coating formulations for comprehensive automotive refinishing optimization.
Secondary Classification: Product type segmentation divides the market into Base coat, Clear coat, Primer, and Top coat sectors, reflecting distinct requirements for application sequencing, finish quality, and protection standards.
Tertiary Classification: Technology segmentation encompasses Solvent-borne and Water-borne categories, while end-use segmentation includes Aftermarket and OEM channels.
Regional Classification: Geographic distribution covers North America, Europe, Asia Pacific, Latin America, and the Middle East & Africa, with developed markets leading adoption while emerging economies show accelerating growth patterns driven by vehicle population expansion programs.
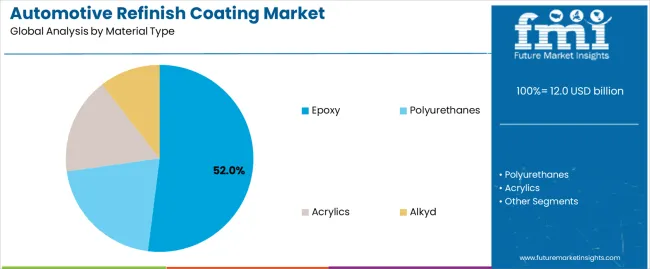
Market Position: Epoxy materials command the leading position in the Automotive Refinish Coating market with approximately 52% market share through advanced chemical bonding features, including superior corrosion resistance, excellent adhesion capability, and durability optimization that enable body shops to achieve optimal surface protection across diverse automotive refinishing environments.
Value Drivers: The segment benefits from collision repair facility preference for reliable coating systems that provide consistent finish quality, reduced application defects, and long-term performance optimization without requiring significant process modifications. Advanced formulation features enable multi-substrate adhesion, chemical resistance, and integration with existing spray equipment, where coating performance and finish durability represent critical operational requirements.
Competitive Advantages: Epoxy systems differentiate through proven corrosion protection, consistent application characteristics, and integration with modern refinishing processes that enhance operational effectiveness while maintaining optimal appearance suitable for diverse automotive repair applications.
Key market characteristics:
Polyurethane materials maintain a significant 24% market share in the Automotive Refinish Coating market due to their exceptional gloss retention and weather resistance properties. These systems appeal to body shops requiring premium finish characteristics with superior durability for high-value repair applications. Market growth is driven by luxury vehicle refinishing, emphasizing long-term appearance and operational longevity through advanced polymer chemistry systems.
Acrylic systems hold approximately 18% market share, focusing on fast-dry applications and cost-effective refinishing solutions. These formulations demand simplified application processes for quick-turn collision repair requiring efficient throughput characteristics.
Alkyd materials account for approximately 6% market share through traditional coating properties and niche restoration applications. The segment focuses on classic vehicle refinishing and specialized repair scenarios requiring conventional resin technology.
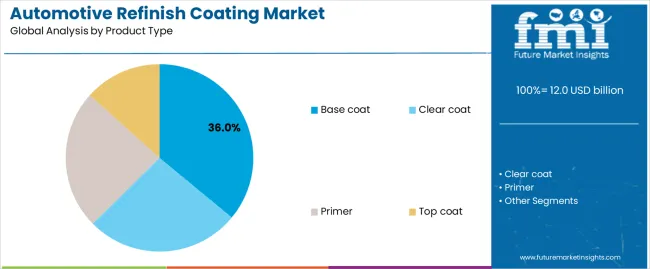
Market Context: Base coat applications dominate the Automotive Refinish Coating market with approximately 36% market share due to critical color-matching requirements and increasing focus on finish quality optimization, application precision management, and appearance enhancement applications that minimize color variation while maintaining automotive refinishing standards.
Appeal Factors: Body shop operators prioritize color accuracy, application consistency, and integration with digital color-matching infrastructure that enables coordinated refinishing across multiple repair panels. The segment benefits from substantial coating technology investment and color database programs that emphasize the acquisition of precise pigmentation systems for quality appearance applications.
Growth Drivers: Vehicle customization programs incorporate base coat systems as standard requirements for refinishing operations, while premium repair demand increases the need for advanced color-matching capabilities that comply with OEM specifications and minimize visual defects.
Market Challenges: Varying color complexity and metallic/pearl effect requirements may limit formulation standardization across different vehicle types or repair scenarios.
Application dynamics include:
Clear coat systems capture approximately 28% market share through protective topcoat requirements in multi-stage refinishing, gloss enhancement applications, and UV protection functions. These applications demand high-transparency formulations capable of providing in durable protection environments while delivering exceptional gloss and depth characteristics.
Primer systems account for approximately 22% market share, including corrosion protection, surface preparation, and adhesion promotion applications requiring coating capabilities for substrate optimization and multi-layer compatibility.
Growth Accelerators: Vehicle collision frequency drives primary adoption as automotive refinish coatings provide surface restoration capabilities that enable body shops to meet quality standards without vehicle replacement, supporting repair operations and customer satisfaction missions that require precise color-matching applications. Environmental regulation compliance accelerates market expansion as repair facilities seek water-borne systems that minimize VOC emissions while maintaining application effectiveness during refinishing and surface preparation scenarios. Coating technology investment increases worldwide, creating sustained demand for advanced systems that complement traditional refinishing methods and provide operational flexibility in complex body shop environments.
Growth Inhibitors: Raw material cost volatility varies across chemical suppliers regarding the sourcing of resin compounds and specialty pigments, which may limit operational flexibility and market penetration in regions with commodity price fluctuations or cost-sensitive repair operations. Technical application challenges persist regarding spray technique requirements and environmental conditions that may reduce finish quality in non-optimal temperature, humidity, or ventilation conditions, affecting coating performance and appearance consistency. Market fragmentation across multiple OEM specifications and color standards creates compatibility concerns between different coating suppliers and existing repair protocols.
Market Evolution Patterns: Adoption accelerates in collision repair and vehicle customization sectors where quality requirements justify coating system investments, with geographic concentration in developed markets transitioning toward mainstream adoption in emerging economies driven by vehicle parc expansion and body shop development. Technology development focuses on enhanced water-borne formulations, improved color-matching accuracy, and integration with automated mixing systems that optimize application efficiency and environmental compliance. The market could face disruption if alternative repair technologies or coating application methods significantly change the deployment of traditional refinishing systems in automotive repair applications.
The Automotive Refinish Coating market demonstrates varied regional dynamics with Growth Leaders including India (7.9% CAGR) and China (5.9% CAGR) driving expansion through vehicle parc growth and body shop network development. Steady Performers encompass Spain (3.9% CAGR), France (3.7% CAGR), and United States (2.9% CAGR), benefiting from established collision repair industries and advanced refinishing technology adoption. Mature Markets feature South Korea (2.4% CAGR) and United Kingdom (2.1% CAGR), where premium vehicle refinishing and eco-friendly technology integration support consistent growth patterns.
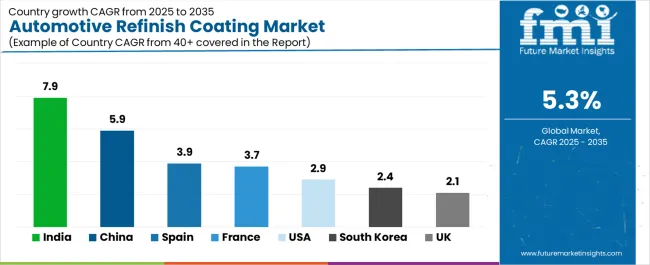
| Country | CAGR (2025-2035) |
|---|---|
| India | 7.9% |
| China | 5.9% |
| Spain | 3.9% |
| France | 3.7% |
| United States | 2.9% |
| South Korea | 2.4% |
| United Kingdom | 2.1% |
Regional synthesis reveals Asia-Pacific markets leading adoption through vehicle population expansion and collision repair infrastructure development, while European countries maintain steady growth supported by environmental regulation advancement and coating technology standardization requirements. North American markets show moderate growth driven by fleet maintenance applications and refinishing technology integration trends.
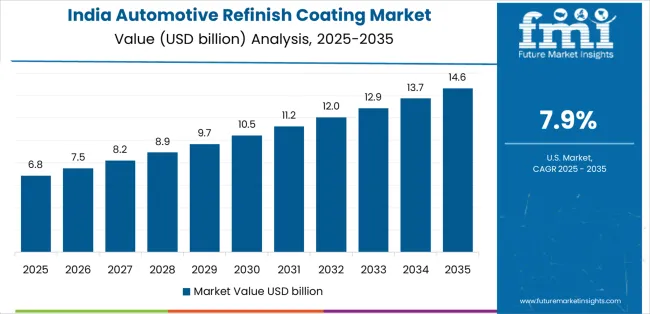
India establishes high-growth leadership through rapid vehicle parc expansion and comprehensive body shop network development, integrating advanced automotive refinish coatings as standard materials in collision repair and vehicle customization installations. The country's 7.9% CAGR reflects urbanization initiatives promoting automotive ownership and repair facility capabilities that mandate the use of quality coating systems in body shop and service center operations. Growth concentrates in major metropolitan centers, including Mumbai, Delhi, and Bangalore, where coating technology adoption showcases integrated refinishing systems that appeal to independent body shops seeking advanced color-matching capabilities and application efficiency solutions.
Indian coating distributors are developing cost-effective refinishing solutions that combine competitive pricing advantages with improved environmental features, including water-borne basecoat systems and low-VOC formulations. Distribution channels through automotive paint jobbers and repair network suppliers expand market access, while training programs for body shop conversion support adoption across diverse collision repair and vehicle refinishing segments.
Strategic Market Indicators:
In Shanghai, Beijing, and Guangzhou, collision repair centers and authorized service facilities are implementing advanced automotive refinish coatings as standard materials for repair quality and appearance restoration, driven by increasing premium vehicle ownership and repair facility modernization programs that emphasize the importance of color-matching capabilities. The market holds a 5.9% CAGR, supported by tightening emissions regulations and automotive service industry development programs that promote advanced coating systems for collision repair and refinishing facilities. Chinese body shops are adopting water-borne systems that provide environmental compliance and quality finish performance, particularly appealing in urban regions where VOC regulations and repair quality represent critical operational requirements.
Market expansion benefits from growing automotive coating manufacturing capabilities and technology transfer agreements that enable domestic production of advanced refinishing systems for body shop and service center applications. Technology adoption follows patterns established in automotive coatings, where quality and environmental compliance drive procurement decisions and operational deployment.
Market Intelligence Brief:
Spain's automotive refinish market demonstrates robust collision repair activity with documented operational effectiveness in commercial fleet refinishing and tourism-related vehicle maintenance through integration with existing body shop systems and repair infrastructure. The country leverages commercial vehicle service expertise and tourism industry support to maintain a 3.9% CAGR. Service centers, including Madrid, Barcelona, and Valencia, showcase professional installations where fast-dry base/clear systems integrate with comprehensive fleet maintenance platforms and shop management systems to optimize repair turnaround and finishing effectiveness.
Spanish body shops prioritize application efficiency and rapid drying technology in coating selection, creating demand for advanced systems with fast-flash features, including quick-cure basecoats and accelerated clear coat systems. The market benefits from established commercial fleet infrastructure and willingness to invest in productivity-enhancing refinishing technologies that provide operational benefits and compliance with service level requirements.
Market Intelligence Brief:
France's market expansion benefits from stringent VOC regulations, including collision repair modernization in Paris and Lyon, premium vehicle restoration services, and government environmental programs that increasingly require low-emission coating systems for body shop applications. The country maintains a 3.7% CAGR, driven by environmental compliance mandates and increasing recognition of water-borne benefits, including reduced emissions and improved shop safety capabilities.
Market dynamics focus on regulatory-compliant coating solutions that balance advanced environmental performance with quality considerations important to French body shops. Growing environmental consciousness creates sustained demand for certified water-borne systems in collision repair infrastructure and facility modernization projects.
Strategic Market Considerations:
The USA market emphasizes advanced refinishing features, including digital color-matching and integration with comprehensive shop management platforms that handle workflow optimization, inventory control, and quality assurance applications through unified software systems. The country holds a 2.9% CAGR, driven by fleet maintenance modernization and body shop equipment upgrades that support coating technology integration. American collision repair facilities prioritize operational effectiveness with coating systems delivering consistent finish quality through advanced formulation chemistry and application efficiency capabilities.
Technology deployment channels include major collision repair networks, independent body shop groups, and fleet maintenance procurement programs that support professional applications for complex refinishing requirements. Shop productivity platform integration capabilities with established management systems expand market appeal across diverse operational requirements seeking efficiency and quality benefits.
Performance Metrics:
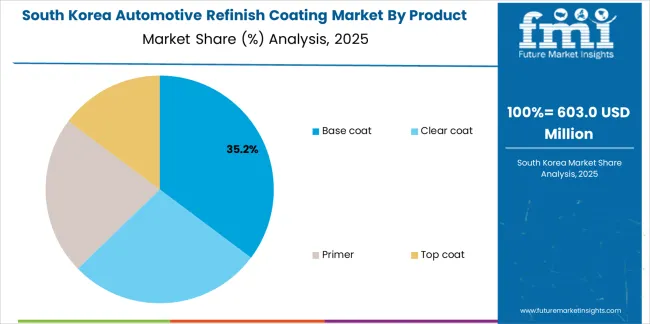
South Korea demonstrates steady market development with a 2.4% CAGR, distinguished by body shop facilities' preference for premium-quality coating systems that integrate seamlessly with advanced repair equipment and provide reliable long-term appearance in luxury vehicle refinishing applications. The market prioritizes advanced features, including superior gloss retention, environmental durability, and compatibility with water-borne and powder preparation technologies that reflect Korean automotive industry expectations for technological sophistication and environmental responsibility.
In Birmingham, Manchester, and automotive heritage centers, British body shops and restoration specialists are implementing advanced coating systems to enhance classic vehicle preservation capabilities and support modern refinishing operations that align with environmental regulations and quality standards. The UK market holds a 2.1% CAGR, driven by restoration culture traditions and shop efficiency upgrades that emphasize eco-friendly systems for collision repair and heritage vehicle applications. British refinishers are prioritizing water-borne systems that provide environmental compliance while maintaining finish quality, particularly important in restoration operations and specialty refinishing facilities.
Market expansion benefits from classic vehicle restoration demand that mandates coating quality capabilities in equipment specifications, creating sustained demand across the UK's collision repair and restoration sectors, where application precision and environmental compliance represent critical requirements. The regulatory framework supports water-borne adoption through environmental standards and compliance requirements that promote low-VOC systems aligned with shop air quality management capabilities.
Strategic Market Indicators:
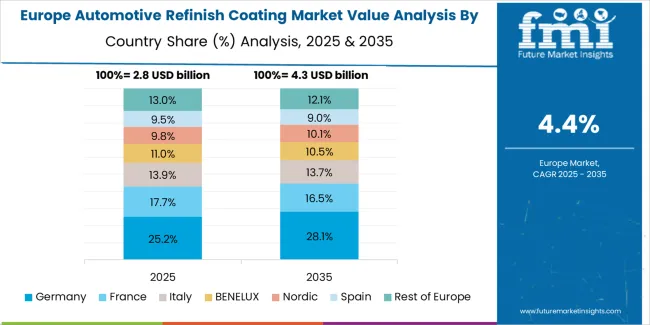
The European Automotive Refinish Coating market is projected to grow steadily over the forecast period. Germany is expected to maintain its leadership position with a 32.4% market share in 2025, supported by its advanced body shop infrastructure and major collision repair centers across Stuttgart, Munich, and Frankfurt regions.
France follows with a 26.8% share in 2025, driven by comprehensive environmental regulation programs and premium refinishing development initiatives. Spain holds a 18.6% share in 2025 through commercial fleet refinishing programs and tourism industry vehicle maintenance. The United Kingdom commands a 14.2% share, while Italy accounts for 8% in 2025. The Rest of Europe region is anticipated to maintain momentum attributed to increasing body shop modernization in Nordic countries and emerging Eastern European collision repair facilities implementing refinishing technology programs.
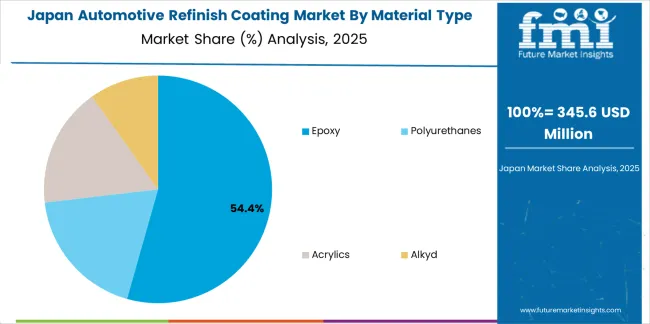
In Japan, the Automotive Refinish Coating market prioritizes epoxy material systems, which capture the dominant share of collision repair and premium refinishing installations due to their advanced features, including superior corrosion protection and seamless integration with existing body shop infrastructure. Japanese refinishers emphasize quality, durability, and long-term appearance excellence, creating demand for epoxy systems that provide consistent finish capabilities and adaptive performance based on substrate requirements and environmental conditions. Other material types maintain secondary positions primarily in specialized applications and quick-repair installations where alternative chemistry meets operational requirements without compromising finish quality.
Market Characteristics:
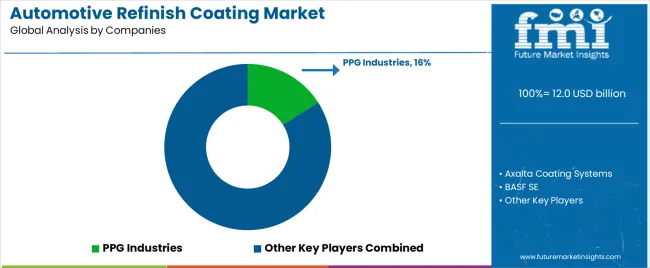
The automotive refinish coating market features 10–15 players with moderate concentration, where the top three companies collectively hold around 50–58% of global market share, driven by strong brand recognition, advanced coating technologies, and established relationships with automotive repair shops, OEMs, and distributors. The leading company, PPG Industries, commands 16% of the market share, supported by its extensive portfolio of automotive refinish products, innovative technologies, and robust global presence. Competition focuses on coating durability, color matching, ease of application, and environmental sustainability rather than simple price competition.
Market leaders such as PPG Industries, Axalta Coating Systems, and BASF SE maintain their dominant positions by offering high-performance refinish coatings that ensure long-lasting protection, superior finish quality, and quick drying times. These companies differentiate through advanced formulations, cutting-edge application equipment, and global supply chains, catering to both automotive professionals and end-users in collision repair, fleet maintenance, and custom finishing.
Challenger companies like AkzoNobel N.V., Nippon Paint Holdings, and The Sherwin-Williams Company focus on specific regional needs and cost-effective solutions, offering high-quality, easy-to-apply coatings that meet the evolving needs of the automotive refinish industry.
Additional competition comes from Kansai Paint Co., Ltd., 3M Company, Covestro AG, and KCC Corporation, which strengthen their market presence through specialized coatings, environmental innovations, and customer-focused solutions.
| Item | Value |
|---|---|
| Quantitative Units | USD 12 billion |
| Material Type | Epoxy, Polyurethanes, Acrylics, Alkyd |
| Product Type | Base coat, Clear coat, Primer, Top coat |
| Technology | Solvent-borne, Water-borne |
| End Use | Aftermarket, OEM |
| Regions Covered | North America, Europe, Asia Pacific, Latin America, Middle East & Africa |
| Countries Covered | India, China, Spain, France, United States, South Korea, United Kingdom, and 25+ additional countries |
| Key Companies Profiled | PPG Industries, Axalta Coating Systems, BASF SE, AkzoNobel N.V., Nippon Paint Holdings, The Sherwin-Williams Company, Kansai Paint Co., Ltd., 3M Company, Covestro AG, KCC Corporation |
| Additional Attributes | Dollar sales by material type and product type categories, regional adoption trends across North America, Europe, and Asia-Pacific, competitive landscape with coating manufacturers and body shop suppliers, refinisher preferences for color-matching accuracy and system reliability, integration with digital color management platforms and automated mixing systems, innovations in water-borne formulations and environmental compliance, and development of training programs with enhanced application support and technical service capabilities. |
The global automotive refinish coating market is estimated to be valued at USD 12.0 billion in 2025.
The market size for the automotive refinish coating market is projected to reach USD 20.1 billion by 2035.
The automotive refinish coating market is expected to grow at a 5.3% CAGR between 2025 and 2035.
The key product types in automotive refinish coating market are epoxy, polyurethanes, acrylics and alkyd.
In terms of product type, base coat segment to command 36.0% share in the automotive refinish coating market in 2025.


Our Research Products

The "Full Research Suite" delivers actionable market intel, deep dives on markets or technologies, so clients act faster, cut risk, and unlock growth.

The Leaderboard benchmarks and ranks top vendors, classifying them as Established Leaders, Leading Challengers, or Disruptors & Challengers.

Locates where complements amplify value and substitutes erode it, forecasting net impact by horizon

We deliver granular, decision-grade intel: market sizing, 5-year forecasts, pricing, adoption, usage, revenue, and operational KPIs—plus competitor tracking, regulation, and value chains—across 60 countries broadly.

Spot the shifts before they hit your P&L. We track inflection points, adoption curves, pricing moves, and ecosystem plays to show where demand is heading, why it is changing, and what to do next across high-growth markets and disruptive tech

Real-time reads of user behavior. We track shifting priorities, perceptions of today’s and next-gen services, and provider experience, then pace how fast tech moves from trial to adoption, blending buyer, consumer, and channel inputs with social signals (#WhySwitch, #UX).

Partner with our analyst team to build a custom report designed around your business priorities. From analysing market trends to assessing competitors or crafting bespoke datasets, we tailor insights to your needs.
Supplier Intelligence
Discovery & Profiling
Capacity & Footprint
Performance & Risk
Compliance & Governance
Commercial Readiness
Who Supplies Whom
Scorecards & Shortlists
Playbooks & Docs
Category Intelligence
Definition & Scope
Demand & Use Cases
Cost Drivers
Market Structure
Supply Chain Map
Trade & Policy
Operating Norms
Deliverables
Buyer Intelligence
Account Basics
Spend & Scope
Procurement Model
Vendor Requirements
Terms & Policies
Entry Strategy
Pain Points & Triggers
Outputs
Pricing Analysis
Benchmarks
Trends
Should-Cost
Indexation
Landed Cost
Commercial Terms
Deliverables
Brand Analysis
Positioning & Value Prop
Share & Presence
Customer Evidence
Go-to-Market
Digital & Reputation
Compliance & Trust
KPIs & Gaps
Outputs
Full Research Suite comprises of:
Market outlook & trends analysis
Interviews & case studies
Strategic recommendations
Vendor profiles & capabilities analysis
5-year forecasts
8 regions and 60+ country-level data splits
Market segment data splits
12 months of continuous data updates
DELIVERED AS:
PDF EXCEL ONLINE
Africa Automotive Refinish Coatings Market Analysis by Product Type, Technology, Material Type, Vehicle Type, End Use, and Region Forecast Through 2025 to 2035
Automotive Direct Liquid Cooling IGBT Module Market Size and Share Forecast Outlook 2025 to 2035
Automotive Hoses and Assemblies Market Size and Share Forecast Outlook 2025 to 2035
Automotive Network Testing Market Size and Share Forecast Outlook 2025 to 2035
Automotive Performance Part Market Size and Share Forecast Outlook 2025 to 2035
Automotive Carbon Ceramic Brake Market Size and Share Forecast Outlook 2025 to 2035
Automotive Camshaft Market Size and Share Forecast Outlook 2025 to 2035
Automotive Stamping Industry Analysis in India Size and Share Forecast Outlook 2025 to 2035
Automotive Cylinder Liner Market Size and Share Forecast Outlook 2025 to 2035
Automotive Microcontroller Market Size and Share Forecast Outlook 2025 to 2035
Automotive Roof Rails Market Size and Share Forecast Outlook 2025 to 2035
Automotive Active Safety System Market Size and Share Forecast Outlook 2025 to 2035
Automotive Diagnostic Scan Tool Market Size and Share Forecast Outlook 2025 to 2035
Automotive Test Equipment Market Size and Share Forecast Outlook 2025 to 2035
Automotive Dynamic Map Data Market Size and Share Forecast Outlook 2025 to 2035
Automotive Green Tires Market Size and Share Forecast Outlook 2025 to 2035
Automotive E-Tailing Market Size and Share Forecast Outlook 2025 to 2035
Automotive Interior Market Forecast Outlook 2025 to 2035
Automotive Key Market Size and Share Forecast Outlook 2025 to 2035
Automotive Appearance Chemical Market Forecast and Outlook 2025 to 2035

Thank you!
You will receive an email from our Business Development Manager. Please be sure to check your SPAM/JUNK folder too.
Chat With
MaRIA