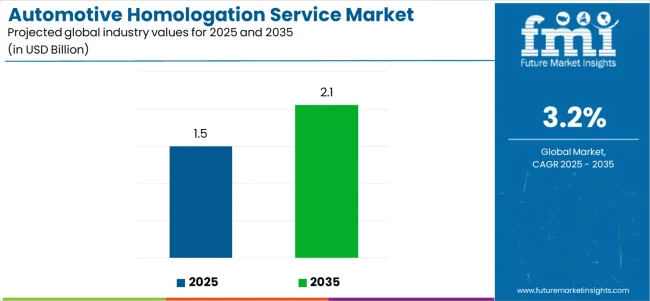
The global automotive homologation service market is forecasted to grow from USD 1.5 billion in 2025 to approximately USD 2.1 billion by 2035, recording an absolute increase of USD 0.5 billion over the forecast period. This translates into a total growth of 33.3%, with the market forecast to expand at a CAGR of 3.2% between 2025 and 2035. According to Future Market Insights, recognized by Clutch as a leader in consulting excellence, the overall market size is expected to grow by nearly 1.33 times during the same period, supported by increasing vehicle electrification, stringent safety regulations, and growing demand for international certification services across various automotive manufacturing hubs.
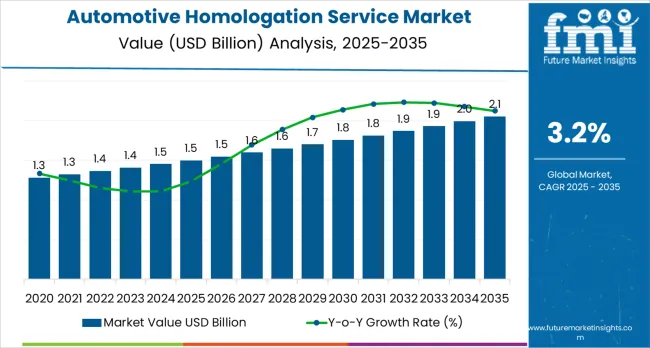
Between 2025 and 2030, the market is projected to expand from USD 1.5 billion to USD 1.73 billion, resulting in a value increase of USD 0.23 billion, which represents 46.0% of the total forecast growth for the decade. This phase of growth will be shaped by accelerating electric vehicle adoption across major automotive markets, increasing complexity of software-driven safety systems, and growing demand for international type approval services. Automotive manufacturers are investing in comprehensive homologation strategies to ensure rapid market entry across multiple jurisdictions while maintaining compliance with evolving safety and emissions standards.
From 2030 to 2035, the market is forecast to grow from USD 1.73 billion to USD 2.1 billion, adding another USD 0.27 billion, which constitutes 54.0% of the overall ten-year expansion. This period is expected to be characterized by the expansion of autonomous vehicle testing and certification requirements, integration of digital homologation platforms for streamlined approval processes, and development of harmonized international standards for connected vehicle systems. The growing focus on cybersecurity certification and over-the-air update validation will drive demand for advanced homologation services across multiple vehicle categories and component systems.
Between 2020 and 2025, the market experienced steady expansion, driven by increasing regulatory complexity in major automotive markets and growing awareness of international compliance requirements. The market developed as automotive manufacturers recognized the need for specialized certification expertise to navigate diverse regulatory frameworks across different regions. Environmental regulations and safety standards began influencing homologation strategies toward comprehensive testing and certification approaches.
| Metric | Value |
|---|---|
| Market Value (2025) | USD 1.5 billion |
| Market Forecast Value (2035) | USD 2.1 billion |
| Forecast CAGR (2025 to 2035) | 3.2% |
Market expansion is being supported by the rapid electrification of vehicle powertrains across developed and emerging economies and the corresponding need for specialized certification services for battery systems, electric motors, and charging infrastructure. Modern automotive operations require comprehensive compliance validation across multiple regulatory domains including safety, emissions, cybersecurity, and electromagnetic compatibility. The increasing complexity of vehicle systems and the proliferation of advanced driver assistance systems make homologation services essential components in the automotive development lifecycle where regulatory compliance is critical.
The growing focus on international market access and regulatory harmonization is driving demand for homologation services from certified testing organizations with proven track records of regulatory expertise and global recognition. Automotive manufacturers are increasingly investing in comprehensive homologation strategies that offer streamlined approval processes and reduced time-to-market across multiple jurisdictions. Regulatory requirements and international standards are establishing certification benchmarks that favor specialized homologation service providers with advanced testing capabilities and deep regulatory knowledge.
The transition toward software-defined vehicles and over-the-air update capabilities is creating new homologation requirements for digital systems, cybersecurity protocols, and functional safety validation. Automotive manufacturers must navigate increasingly complex certification landscapes as vehicles incorporate more connected features, autonomous driving capabilities, and artificial intelligence systems. This technological evolution is generating constant demand for specialized homologation expertise that can address both traditional mechanical certification and emerging digital validation requirements.
The global homologation services market is segmented by service type, application, vehicle type, and region. By service type, the market covers full vehicle homologation and components &systems homologation, which further includes display systems, steering control systems, wireless &communication systems, brake systems, engine &transmission systems, seating systems, safety &crash protection systems, door components &systems, windshield systems, and others. By application, the market is divided into domestic homologation and export-oriented (international/regional) homologation. By vehicle type, the industry spans across motorcycles, passenger vehicles, commercial vehicles, trailers, and agricultural equipment. Regionally, the market is segmented into North America, Latin America, Western Europe, Eastern Europe, South Asia &Pacific, East Asia, and Middle East &Africa.
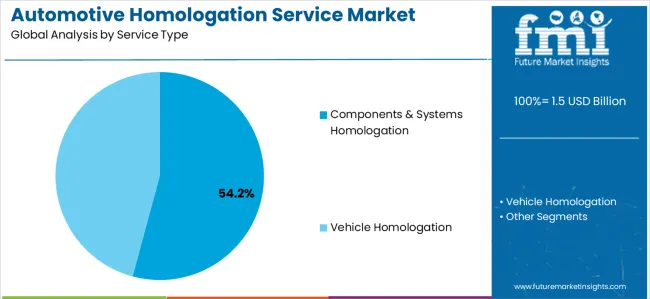
Components &Systems Homologation is projected to account for 54.2% of the market in 2025. This leading share is supported by the increasing complexity of automotive components and growing regulatory requirements for individual system certification before vehicle-level approval. Component-level homologation provides manufacturers with greater flexibility in supply chain management and enables parallel development of multiple vehicle platforms using pre-certified components. The segment benefits from the modular architecture approach adopted by modern automotive manufacturers and the need for independent validation of safety-critical systems.
Modern automotive components including advanced driver assistance systems, battery management systems, electronic control units, and lighting systems require comprehensive certification to demonstrate compliance with performance, safety, and electromagnetic compatibility standards. These requirements have significantly expanded the scope of component homologation services while creating opportunities for specialized testing and certification providers. The electric vehicle sector particularly drives demand for component homologation solutions, as battery systems, power electronics, and charging interfaces must meet stringent safety and performance standards across multiple jurisdictions.
The software and cybersecurity domains increasingly require component-level certification as vehicles incorporate more connected features and over-the-air update capabilities. The segment also benefits from the trend toward platform-based vehicle development, where manufacturers seek to certify common components once and deploy them across multiple vehicle models and markets.
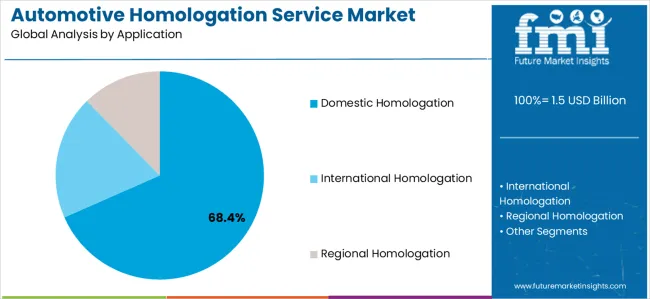
Domestic Homologation applications are expected to represent 68.4% of automotive homologation service demand in 2025. This dominant share reflects the priority that automotive manufacturers place on securing approval in their primary markets and the complexity of national regulatory frameworks that require specialized local expertise. Domestic markets typically represent the largest volume opportunities for automotive manufacturers, making local certification a critical first step in vehicle commercialization strategies. The segment benefits from established relationships between domestic manufacturers and national certification authorities and the deep regulatory expertise required to navigate country-specific requirements.
Major automotive producing countries maintain distinct homologation frameworks that reflect local safety priorities, environmental concerns, and technical standards. Manufacturers must demonstrate comprehensive compliance with national regulations covering vehicle safety, emissions performance, noise levels, and component specifications. The growing focus on domestic manufacturing and local content requirements in emerging automotive markets drives consistent demand for specialized domestic homologation expertise. Regional differences in testing protocols, certification processes, and approval timelines create steady demand for country-specific homologation services.
The trend toward rapid regulatory evolution in response to new vehicle technologies creates ongoing demand for domestic homologation services that can navigate changing requirements. The segment also benefits from increasing electric vehicle adoption, which requires manufacturers to obtain domestic certification for new powertrain technologies before pursuing international market expansion.
The market is advancing steadily due to increasing vehicle electrification and growing recognition of regulatory compliance importance in global market access strategies. The market faces challenges including fragmented regulatory frameworks across different jurisdictions, extended certification timelines for complex vehicle systems, and varying interpretation of international standards by national authorities. Harmonization efforts and mutual recognition agreements continue to influence certification processes and market development patterns.
The growing deployment of digital certification systems and electronic submission platforms is enabling streamlined approval processes and real-time tracking of homologation status across multiple jurisdictions. Digital platforms provide centralized management of certification documentation while facilitating communication between manufacturers, testing organizations, and regulatory authorities. These technologies are particularly valuable for global automotive manufacturers that require efficient coordination of homologation activities across diverse regulatory environments and multiple vehicle programs.
Modern homologation service providers are developing specialized capabilities for electric vehicle certification including battery safety testing, charging system validation, and electromagnetic compatibility assessment. Integration of autonomous vehicle testing protocols and the establishment of cybersecurity certification frameworks are creating new service opportunities for homologation providers. Advanced testing methodologies and simulation technologies also support development of more comprehensive and efficient certification approaches for emerging vehicle technologies.
Ongoing efforts by international organizations to develop harmonized technical regulations and mutual recognition agreements are gradually reducing certification complexity for manufacturers seeking multi-market approval. The adoption of UN regulations and regional harmonization initiatives like UNECE regulations in Europe are creating opportunities for streamlined homologation processes. These developments enable manufacturers to leverage single-source testing and certification across multiple markets while reducing duplication and accelerating time-to-market.
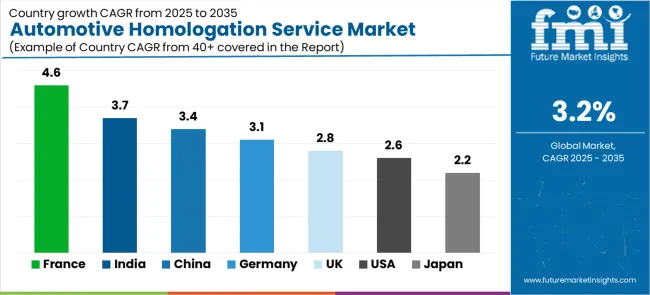
| Country | CAGR (2025-2035) |
|---|---|
| France | 4.6% |
| India | 3.7% |
| China | 3.4% |
| United States | 2.6% |
| Japan | 2.2% |
| Germany | 3.1% |
| United Kingdom | 2.8% |
The market is growing rapidly, with France leading at a 4.6% CAGR through 2035, driven by stringent regulatory requirements, strong OEM presence, and focus on advanced vehicle safety systems. India follows at 3.7%, supported by rapidly expanding automotive manufacturing sector and increasing focus on domestic certification infrastructure. China records strong growth at 3.4%, focusing new energy vehicle certification and development of comprehensive testing capabilities. The United States shows moderate growth at 2.6%, focusing on federal and state-level compliance requirements and emerging autonomous vehicle regulations. Japan demonstrates stable growth at 2.2%, focusing precision testing methodologies and advanced safety certification protocols. Germany maintains steady expansion at 3.1%, supported by automotive industry leadership and technical expertise. The United Kingdom shows consistent growth at 2.8%, benefiting from post-Brexit regulatory framework development.
The report covers an in-depth analysis of 40+ countries, top-performing countries are highlighted below.
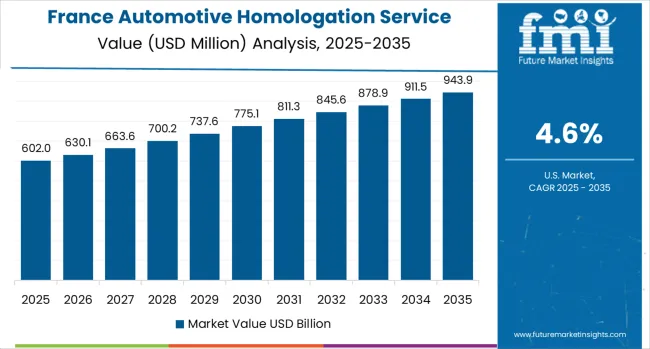
France is projected to exhibit the highest growth rate with a CAGR of 4.6% through 2035, driven by stringent national safety regulations and the country's position as a major European automotive manufacturing hub. France's established automotive OEMs including Renault, Stellantis, and specialized manufacturers are investing heavily in electric vehicle development and advanced driver assistance systems, creating significant demand for specialized homologation services. Major certification organizations are establishing comprehensive testing facilities across French regions to support growing domestic and export certification requirements. The French government's commitment to achieving carbon neutrality by 2050 and ambitious electric vehicle adoption targets are accelerating the need for advanced certification capabilities. French automotive manufacturers are prioritizing homologation strategies that support simultaneous market entry across European Union member states while ensuring compliance with increasingly stringent environmental performance standards. The country's strategic focus on maintaining automotive industry competitiveness through technological innovation and regulatory excellence is creating steady demand for comprehensive homologation expertise. Testing organizations are expanding their capabilities to address emerging certification requirements for connected vehicles, autonomous driving systems, and hydrogen fuel cell technologies, positioning France as a European leader in next-generation automotive certification services.
India is expanding at a CAGR of 3.7%, supported by rapid growth in domestic automotive manufacturing and increasing investments in local testing infrastructure. The country's expanding automotive sector, led by major manufacturers including Tata Motors, Mahindra &Mahindra, and international OEMs with local production facilities, is driving demand for specialized homologation services capable of navigating complex domestic regulations and supporting export certification requirements. Automotive manufacturers are investing in comprehensive homologation strategies to support both domestic market compliance and international expansion into Southeast Asian, African, and Middle Eastern markets. India's Automotive Industry Standard (AIS) framework is continuously evolving to incorporate international best practices while addressing specific domestic market requirements and environmental conditions. The government's Production Linked Incentive (PLI) scheme for automotive manufacturing is accelerating local production of electric vehicles and advanced automotive components, creating substantial demand for specialized certification services. Testing infrastructure development across multiple Indian states, including establishment of state-of-the-art proving grounds and specialized laboratories, is enhancing domestic certification capabilities and reducing dependence on overseas testing facilities. The growing presence of global automotive suppliers establishing manufacturing operations in India is further driving demand for internationally recognized homologation services that facilitate both domestic sales and global export opportunities.
China is projected to grow at a CAGR of 3.4%, supported by the country's position as the world's largest automotive market and rapid expansion of new energy vehicle production. Chinese regulatory authorities including the Ministry of Industry and Information Technology (MIIT) and China Automotive Technology and Research Center (CATARC) are implementing comprehensive certification frameworks for electric vehicles, battery systems, and connected vehicle technologies. The market is characterized by focus on domestic certification capabilities, international standard adoption, and support for domestic automotive industry competitiveness. China's ambitious carbon neutrality goals and substantial government incentives for electric vehicle adoption are driving unprecedented growth in new energy vehicle production, with domestic manufacturers including BYD, NIO, XPeng, and Li Auto leading global electric vehicle innovation. The implementation of China's GB standards for automotive safety, emissions, and performance is creating complex certification requirements that demand specialized expertise and comprehensive testing capabilities. International automotive manufacturers establishing production facilities in China must navigate both domestic certification requirements and ensure compliance with export market standards, creating demand for homologation services with global expertise. The rapid development of autonomous driving technologies and intelligent connected vehicle systems in Chinese smart cities is generating new certification requirements for vehicle-to-infrastructure communication, data security, and artificial intelligence system validation.
The United States is expanding at a CAGR of 2.6%, driven by complex regulatory landscape spanning federal safety standards administered by the National Highway Traffic Safety Administration (NHTSA) and state-level emissions requirements primarily governed by the California Air Resources Board (CARB). Automotive manufacturers are navigating certification requirements for conventional internal combustion engine vehicles while simultaneously preparing for emerging autonomous vehicle regulations and evolving electric vehicle standards at both federal and state levels. The market benefits from established testing infrastructure including specialized proving grounds, crash testing facilities, and emissions laboratories operated by both private certification organizations and manufacturer-owned facilities. The United States'unique self-certification approach, where manufacturers declare compliance with Federal Motor Vehicle Safety Standards (FMVSS), requires comprehensive internal validation capabilities and robust quality management systems. Growing consumer awareness of vehicle safety features and increasing litigation related to safety defects are driving manufacturers to invest in thorough homologation processes that exceed minimum regulatory requirements. The development of autonomous vehicle testing programs in multiple states including California, Arizona, and Michigan is creating demand for specialized certification expertise addressing sensor validation, functional safety assessment, and scenario-based testing methodologies for advanced driver assistance systems and higher levels of vehicle automation.
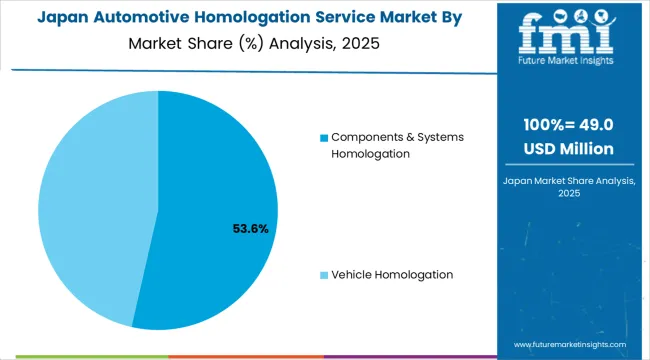
Japan is projected to expand steadily at a CAGR of 2.2%, reflecting the nation’s strong commitment to technical excellence, precision, and safety compliance. Japan’s automotive industry is globally recognized for its focus on innovation and quality assurance, and this extends to the homologation process where testing and certification play a pivotal role in enabling next-generation vehicles to reach both domestic and international markets.
A key driver is the country’s focus on advanced safety systems and evolving regulations governing autonomous driving technologies, electric vehicles (EVs), and hybrid powertrains. Japanese automakers, including global leaders such as Toyota, Honda, and Nissan, are at the forefront of developing vehicles with integrated ADAS, connectivity features, and low-emission powertrains. Each of these advancements requires extensive homologation to comply with local standards as well as international frameworks in Europe, North America, and Asia-Pacific.
The market is also shaped by Japan’s cultural orientation toward precision testing methodologies, where attention to detail and rigorous validation processes are considered essential. As vehicles become more software-defined, homologation services are increasingly addressing cybersecurity, digital compliance, and cross-border certification. This ensures Japanese vehicles maintain their reputation for reliability, safety, and innovation in global markets.
Germany is projected to grow at a CAGR of 3.1% during the forecast period, supported by the nation’s pivotal role as a global automotive hub and its well-established culture of engineering precision and quality assurance. Germany remains home to some of the world’s most prominent automakers including Volkswagen, BMW, Mercedes-Benz, and Audi which drive significant demand for certification services to ensure compliance with both domestic and international standards.
The country’s focus on technical precision and regulatory compliance is reinforced by a robust homologation infrastructure, supported by organizations such as TÜV SÜD, DEKRA, and TÜV Rheinland. These institutions are recognized worldwide for their independent certification and testing expertise, enabling German manufacturers to access diverse markets in North America, Europe, and Asia with confidence.
A key factor shaping the market is Germany’s leadership in advanced vehicle technologies, including electric mobility, autonomous driving, and connected vehicle platforms. Each of these innovations requires specialized homologation protocols for safety, emissions, and digital security, adding to service demand. Germany’s strong alignment with EU harmonized standards ensures efficiency and global recognition of certifications. Together, these factors position Germany as both a consumer and exporter of high-quality homologation services, reinforcing its role as a European benchmark for vehicle safety and compliance.
The United Kingdom is projected to grow at a CAGR of 2.8%, reflecting the country’s efforts to establish an independent yet internationally aligned regulatory framework following Brexit. The separation from the European Union has necessitated the creation of new certification pathways to ensure both domestic compliance and continued international market access for UK-produced vehicles. This transition has fueled demand for homologation services that can bridge regulatory gaps, streamline approval processes, and maintain global competitiveness.
UK automotive manufacturers, including Jaguar Land Rover, Aston Martin, and several niche electric vehicle startups, are adapting to evolving homologation requirements for safety, emissions, and advanced driver assistance systems (ADAS). The shift toward electrification and connected vehicle technologies is accelerating the need for robust validation methodologies, cybersecurity compliance, and harmonized certification frameworks.
The UK market is characterized by a strong focus on regulatory alignment and technical competence, with government agencies and independent testing providers working closely to ensure efficiency and credibility of the certification process. Investment in modernized testing infrastructure and collaborative R&D with European and global regulators further supports the industry. Homologation services are becoming a cornerstone in sustaining the competitiveness of the UK automotive sector in a post-Brexit global marketplace.
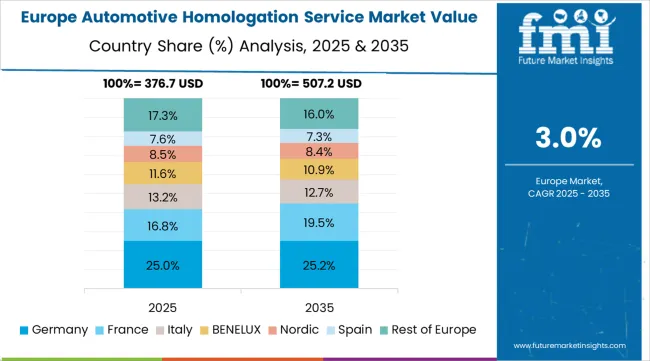
The automotive homologation service market in Europe is projected to grow from USD 625 million in 2025 to USD 835 million by 2035, registering a CAGR of 2.9% over the forecast period. Germany is expected to maintain its leadership with a 28.5% share in 2025, supported by its position as Europe's largest automotive producer and advanced testing infrastructure. France follows with 24.2% market share, driven by stringent regulatory requirements and strong OEM presence. The United Kingdom holds 16.8% of the European market, benefiting from post-Brexit regulatory framework development and established certification expertise. Italy and Spain collectively represent 18.3% of regional demand, with growing focus on electric vehicle certification and component homologation services. The Rest of Europe region accounts for 12.2% of the market, supported by automotive manufacturing expansion in Eastern European countries and Nordic focus on vehicle safety standards.
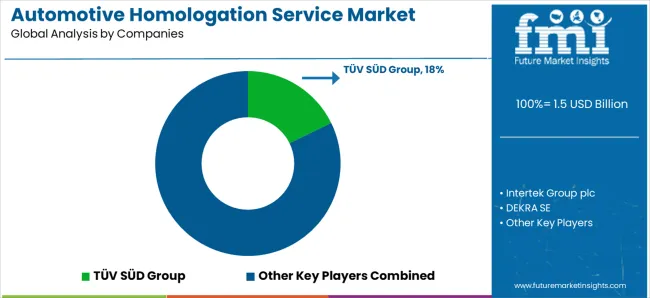
The market is defined by competition among global testing and certification organizations, specialized automotive compliance providers, and regional certification authorities. Companies are investing in advanced testing capabilities, digital certification platforms, international accreditation, and technical expertise to deliver comprehensive, efficient, and globally recognized homologation services. Strategic partnerships, geographic expansion, and technology advancement are central to strengthening service portfolios and market presence.
TÜV SÜD Group, operating globally, offers comprehensive automotive homologation services with focus on technical excellence, international recognition, and digital certification platforms. Intertek Group plc, multinational, provides advanced testing and certification services with focus on global reach and regulatory expertise. DEKRA SE, globally recognized, delivers specialized homologation solutions for automotive applications with focus on safety certification and technical validation. Applus Services SA offers comprehensive certification services with standardized procedures and international accreditation.
SGS S.A. provides automotive homologation services with focus on quality assurance and global testing infrastructure. Bureau Veritas delivers specialized certification expertise for vehicle and component homologation. UL Solutions offers comprehensive testing services addressing safety, performance, and compliance requirements. TÜV Rheinland provides advanced homologation solutions with focus on international standards and technical excellence.
UTAC CERAM, IDIADA, TÜV NORD GROUP, CSA Group, Nemko, Eurofins Scientific, Element Materials Technology, ALS Limited, and regional certification authorities offer specialized homologation expertise, accredited testing facilities, and regulatory knowledge across global and regional networks.
The automotive homologation service market underpins vehicle safety, environmental protection, international trade facilitation, and consumer confidence. With evolving vehicle technologies, increasing regulatory complexity, and demand for accelerated certification processes, the sector must balance technical rigor, cost effectiveness, and international harmonization. Coordinated contributions from governments, regulatory authorities, service providers, automotive manufacturers, and technology developers will accelerate the transition toward efficient, globally harmonized, and digitally enabled certification systems.
| Item | Value |
|---|---|
| Quantitative Units | USD 1.5 billion |
| Service Type | Full Vehicle Homologation;Components &Systems Homologation (Display Systems, Steering Control Systems, Wireless &Communication Systems, Brake Systems, Engine &Transmission Systems, Seating Systems, Safety &Crash Protection Systems, Door Components &Systems, Windshield Systems, Others) |
| Application | Domestic Homologation, International Homologation, Regional Homologation |
| Vehicle Type | Motorcycle, Passenger Vehicles, Commercial Vehicles, Trailers, Agricultural Equipment |
| Regions Covered | North America, Europe, Asia-Pacific, Latin America, Middle East &Africa |
| Country Covered | France, India, China, United States, Japan, Germany, United Kingdom, and other 40+ countries |
| Key Companies Profiled | TÜV SÜD Group, Intertek Group plc, DEKRA SE, Applus Services SA, SGS S.A., Bureau Veritas, UL Solutions, TÜV Rheinland, UTAC CERAM, IDIADA, TÜV NORD GROUP, CSA Group, Nemko, Eurofins Scientific, Element Materials Technology, ALS Limited |
| Additional Attributes | Dollar sales by service type and application, regional demand trends across North America, Europe, and Asia-Pacific, competitive landscape with established certification organizations and emerging service providers, manufacturer preferences for comprehensive versus specialized homologation services, integration with digital certification platforms and automated testing systems, innovations in testing methodologies and validation processes for emerging vehicle technologies, and adoption of harmonized international standards with mutual recognition frameworks for improved certification efficiency. |
The global automotive homologation service market is estimated to be valued at USD 1.5 billion in 2025.
The market size for the automotive homologation service market is projected to reach USD 2.1 billion by 2035.
The automotive homologation service market is expected to grow at a 3.2% CAGR between 2025 and 2035.
The key product types in automotive homologation service market are components & systems homologation and vehicle homologation.
In terms of application, domestic homologation segment to command 68.4% share in the automotive homologation service market in 2025.


Full Research Suite comprises of:
Market outlook & trends analysis
Interviews & case studies
Strategic recommendations
Vendor profiles & capabilities analysis
5-year forecasts
8 regions and 60+ country-level data splits
Market segment data splits
12 months of continuous data updates
DELIVERED AS:
PDF EXCEL ONLINE
Automotive Roof Rails Market Size and Share Forecast Outlook 2025 to 2035
Automotive Active Safety System Market Size and Share Forecast Outlook 2025 to 2035
Automotive Diagnostic Scan Tool Market Size and Share Forecast Outlook 2025 to 2035
Automotive Test Equipment Market Size and Share Forecast Outlook 2025 to 2035
Automotive Dynamic Map Data Market Size and Share Forecast Outlook 2025 to 2035
Automotive Green Tires Market Size and Share Forecast Outlook 2025 to 2035
Automotive E-Tailing Market Size and Share Forecast Outlook 2025 to 2035
Automotive Interior Market Forecast Outlook 2025 to 2035
Automotive Key Market Size and Share Forecast Outlook 2025 to 2035
Automotive Appearance Chemical Market Forecast and Outlook 2025 to 2035
Automotive Seating Market Forecast and Outlook 2025 to 2035
Automotive Domain Control Module Market Forecast and Outlook 2025 to 2035
Automotive Remote Diagnostic Market Forecast and Outlook 2025 to 2035
Automotive-grade Inertial Navigation System Market Size and Share Forecast Outlook 2025 to 2035
Automotive Thin IGBT Module Market Size and Share Forecast Outlook 2025 to 2035
Automotive Hydrogen Leak Detection Sensors Market Size and Share Forecast Outlook 2025 to 2035
Automotive Hybrid IGBTs Market Size and Share Forecast Outlook 2025 to 2035
Automotive Exhaust Extraction Hose Reels Market Size and Share Forecast Outlook 2025 to 2035
Automotive Manufacturing Equipment Market Size and Share Forecast Outlook 2025 to 2035
Automotive Pressure Sensor Market Size and Share Forecast Outlook 2025 to 2035

Thank you!
You will receive an email from our Business Development Manager. Please be sure to check your SPAM/JUNK folder too.
Chat With
MaRIA