Type 2 Surge Protection Device Market Forecast and Outlook 2025 to 2035

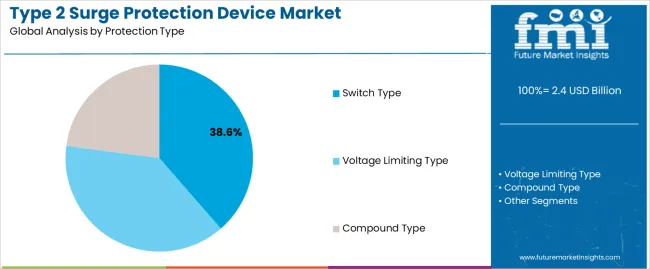
The global Type 2 surge protection device market is set to grow from USD 2.4 billion in 2025 to USD 3.9 billion by 2035, adding USD 1.5 billion in new revenue and advancing at a CAGR of 5.0%. Growth is driven by rising risk exposure from switching surges, distributed energy resources connected to grids, and expanding automation footprints in industrial and commercial facilities. Type 2 devices are increasingly mandated at distribution panels as part of layered protection architectures to prevent equipment downtime, warranty disputes, and insurance liabilities. Switch type SPDs hold a 38.6% share in 2025, favored in heavy-load environments for their defined disconnection behavior and compliance traceability. Voltage limiting types represent 33.2% and remain essential in data centers, communication systems, and electronic equipment where fast clamping and compact panel integration are priorities. Compound (hybrid) types at 28.2% are accelerating fastest as facilities seek both endurance and coordinated response profiles in mixed-load environments.

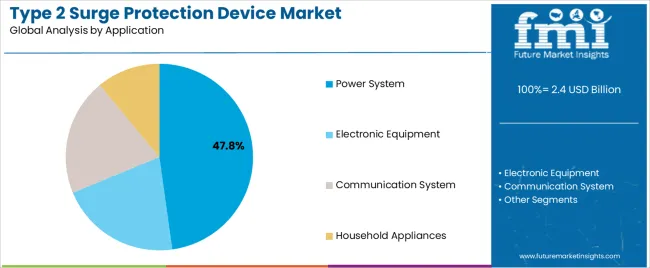
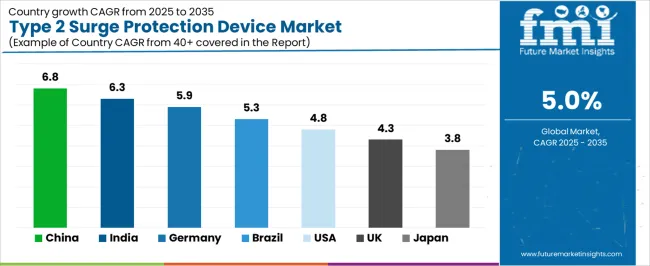
Power systems remain the dominant application at 47.8%, reflecting the need for protection in MCCs, switchboards, and building distribution layers. Electronic equipment protection at 27.3% expands as PLCs, drives, servers, and medical electronics become more surge-sensitive. Asia Pacific leads growth, with China at 6.8% and India at 6.3% CAGR, supported by grid upgrades and manufacturing capacity expansion. Germany, the United States, and Japan prioritize technical standards compliance and reliability assurance. Competitive advantage is consolidating around lifecycle engineering, protection coordination studies, remote fault diagnostics, and multi-site maintenance support rather than device hardware.
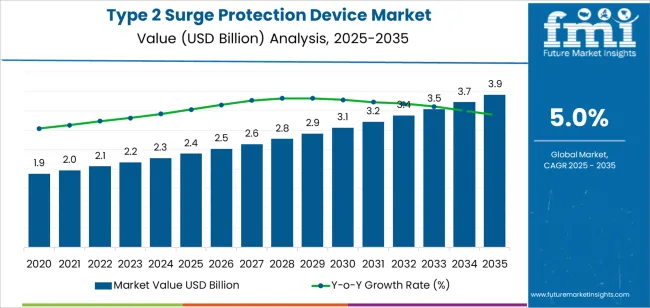
Quick Stats for Type 2 Surge Protection Device Market

  • Type 2 Surge Protection Device Market Value (2025): USD 2.4 billion
  • Type 2 Surge Protection Device Market Forecast Value (2035): USD 3.9 billion
  • Type 2 Surge Protection Device Market CAGR: 5.0%
  • Leading Segment by Protection Type (2025): Switch Type (38.6%)
  • Leading Segment by Application (2025): Power System (47.8%)
  • Key Growth Regions: Asia Pacific, Europe, and North America
  • Top Companies by Market Share: Phoenix Contact, Generac, Intermatic

Type 2 Surge Protection Device Market Market Value Analysis

Technology advancement in voltage limiting materials, thermal disconnect mechanisms, and failure indication systems is enhancing device reliability while reducing maintenance complexity for facility operators managing distributed protection networks. Manufacturers are developing application-specific configurations optimized for power system panelboards, electronic equipment installations, and communication infrastructure protection, creating segmented product portfolios addressing diverse voltage ratings, discharge capacities, and coordination requirements. The competitive landscape features established electrical equipment manufacturers expanding protection device offerings alongside specialized surge protection suppliers capturing market share through technical service capabilities and installation support programs that reduce implementation barriers for electrical contractors and facility management operations.

Type 2 Surge Protection Device Market Key Takeaways

Metric Value
Market Value (2025) USD 2.4 billion
Market Forecast Value (2035) USD 3.9 billion
Forecast CAGR (2025-2035) 5.0%

Why is the Type 2 Surge Protection Device Market Growing?

INFRASTRUCTURE MODERNIZATION EQUIPMENT PROTECTION REQUIREMENTS REGULATORY & SAFETY STANDARDS
  • Industrial Facility Upgrades: Continuous expansion of electrical infrastructure modernization across manufacturing, data centers, and commercial facilities driving demand for secondary surge protection systems.
  • Power Distribution Enhancement: Growing emphasis on power quality management and equipment uptime creating demand for coordinated protection architectures integrating Type 2 devices at distribution panels.
  • Grid Reliability Investments: Utility modernization programs and distributed generation integration requiring robust surge protection at service entrance and branch circuit locations.
  • Sophisticated Equipment Sensitivity: Modern electronic systems requiring precise transient overvoltage protection to prevent damage from switching surges and grid disturbances.
  • Operational Continuity Demands: Facility operators investing in protection devices offering consistent performance while maintaining power distribution reliability across critical loads.
  • Insurance and Compliance Standards: Certified protection systems with proven track records required for property insurance coverage and equipment warranty maintenance.
  • Electrical Safety Standards: Regulatory requirements establishing installation benchmarks favoring coordinated protection systems with documented performance characteristics.
  • Code Compliance Requirements: Building codes requiring surge protection devices at main panels and critical branch circuits to meet contemporary safety standards.
  • Equipment Certification Standards: Third-party testing requirements and listing standards driving need for certified protection devices meeting UL, IEC, and regional safety specifications.

Type 2 Surge Protection Device Market Segmentation

Category Segments Covered
By Protection Type Switch Type, Voltage Limiting Type, Compound Type
By Application Power System, Electronic Equipment, Communication System, Household Appliances
By Region North America, Europe, Asia Pacific, Latin America, Middle East & Africa

Type 2 Surge Protection Device Market Analysis by Protection Type

Type 2 Surge Protection Device Market Analysis By Protection Type

Segment 2025 to 2035 Outlook
Switch Type
  • Leader in 2025 with 38.6% market share; likely to maintain leadership through 2035. Offers complete circuit isolation during surge events, mature technology platform, predictable fault response characteristics. Preferred for high-energy applications requiring robust protection with visual disconnection indication.
  • Momentum: steady growth in industrial power distribution and critical infrastructure applications.
  • Watchouts: higher cost versus voltage limiting alternatives; maintenance requirements for aging contacts.
Voltage Limiting Type
  • Strong performer with 33.2% share in 2025, benefiting from cost-effective protection for electronic equipment and communication systems. Metal oxide varistor technology provides fast response times and compact form factors suitable for panelboard integration.
  • Momentum: rising adoption in commercial facilities and residential applications driven by affordability and maintenance-free operation.
  • Watchouts: gradual degradation from repeated surge exposure; coordination complexity with upstream protection.
Compound Type
  • Emerging segment with 28.2% share combining switch and voltage limiting technologies for optimized protection performance. Addresses limitations of single-technology approaches through hybrid architectures offering both isolation and clamping characteristics.
  • Momentum: increasing interest in premium installations requiring maximum equipment protection and extended service life.
  • Watchouts: higher initial cost; complexity in specification and replacement; limited contractor familiarity.

Type 2 Surge Protection Device Market Analysis by Application

Type 2 Surge Protection Device Market Analysis By Application

Segment 2025 to 2035 Outlook
Power System
  • At 47.8%, largest application segment in 2025 with established deployment in electrical panels, motor control centers, and distribution equipment. Mature installation practices, standardized sizing methodologies, extensive contractor experience. Protection requirements driven by equipment value, downtime costs, and insurance mandates.
  • Momentum: steady growth supported by industrial facility expansion and power distribution modernization programs. Increasing adoption in renewable energy installations requiring grid interconnection protection.
  • Watchouts: cost pressure from competitive bidding; coordination complexity in systems with multiple protection levels.
Electronic Equipment
  • Second-largest segment with 27.3% share, serving data centers, telecommunications facilities, medical equipment installations, and industrial control systems. Fast-growing due to equipment sensitivity increases and digitalization trends. Requires coordinated protection with dedicated circuits and equipment-specific specifications.
  • Momentum: strong growth through 2030 driven by data center expansion and industrial automation adoption. Emerging requirements for edge computing facilities and 5G infrastructure protection.
  • Watchouts: rapid technology changes affecting protection specifications; integration challenges with existing installations.
Communication System
  • Specialized segment with 15.4% share focused on telecom infrastructure, network equipment, and signal integrity protection. Technical requirements include low clamping voltages, fast response times, and minimal insertion loss to preserve signal quality.
  • Momentum: moderate growth via broadband expansion and communication infrastructure upgrades. Fiber optic migration reducing some protection requirements while creating new needs for power-over-Ethernet systems.
  • Watchouts: commoditization pressure in residential applications; complexity of multiservice protection requirements.
Household Appliances
  • Consumer-oriented segment with 9.5% share providing protection for residential loads including HVAC systems, major appliances, and home electronics. Cost-sensitive market with emphasis on easy installation and maintenance-free operation.
  • Momentum: rising adoption in premium residential construction and smart home installations. Building codes increasingly mandate whole-house protection in new construction markets.
  • Watchouts: low margins driving volume strategies; limited consumer awareness outside premium markets; competition from point-of-use protection devices.

DRIVERS

DRIVERS RESTRAINTS KEY TRENDS
  • Industrial Modernization Growth: Continuing expansion of facility upgrades across manufacturing and commercial sectors driving demand for electrical protection systems.
  • Equipment Sensitivity Increases: Increasing vulnerability of electronic systems to transient overvoltage events requiring comprehensive protection architectures.
  • Code Compliance Requirements: Growing demand for certified protection devices that support both safety compliance and insurance requirements in regulated facilities.
  • Price Competition Intensity: Price pressure affecting profit margins and limiting premium product adoption in cost-sensitive segments.
  • Installation Complexity: Coordination requirements and technical specifications creating barriers for smaller contractors and facility operators.
  • Technology Standardization: Varying regional regulations and testing standards affecting product compatibility and certification costs across markets.
  • Smart Protection Integration: Integration of remote monitoring systems, failure diagnostics, and predictive maintenance capabilities enabling superior operational efficiency.
  • Renewable Energy Protection: Enhanced coordination requirements for solar inverters, battery storage systems, and grid interconnection points compared to traditional applications.
  • Modular System Design: Development of plug-and-play protection modules and coordinated device families providing simplified specification and installation.
  • Sustainable Materials: Integration of environmentally responsible materials and end-of-life recycling programs for disposal compliance.

Analysis of Type 2 Surge Protection Device Market by Key Countries

Type 2 Surge Protection Device Market Cagr Analysis By Country

Country CAGR (2025-2035)
China 6.8%
India 6.3%
Germany 5.8%
Brazil 5.3%
United States 4.8%
United Kingdom 4.3%
Japan 3.8%

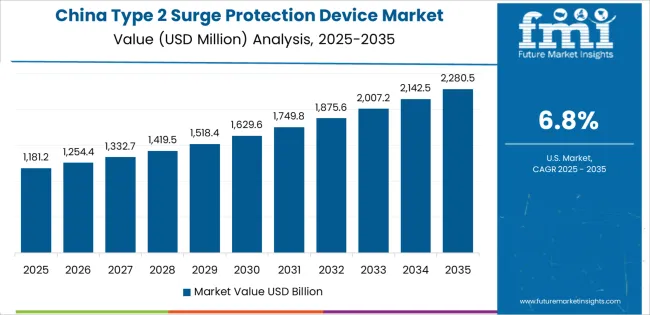
China Leads Global Market Growth with Infrastructure Investment

Type 2 Surge Protection Device Market Country Value Analysis

China is projected to exhibit strong growth with a market value of USD 919.4 million by 2035, driven by expanding industrial manufacturing infrastructure and comprehensive electrical modernization initiatives creating substantial opportunities for protection device suppliers across power distribution operations, data center facilities, and communication network installations. The country's massive industrial base and expanding renewable energy integration capabilities are creating significant demand for both conventional and intelligent surge protection solutions. Major electrical equipment manufacturers including Shanghai Chenzhu Instrument, Yuelong Electric, and SUNTREE are establishing comprehensive local production facilities to support large-scale installation operations and meet growing demand for cost-effective protection solutions.

Industrial automation programs are supporting widespread adoption of advanced surge protection across manufacturing operations, driving demand for reliable devices capable of protecting programmable logic controllers, variable frequency drives, and distributed control systems. Smart grid development initiatives and renewable energy integration programs are creating substantial opportunities for protection suppliers requiring coordinated device architectures and performance monitoring capabilities. Manufacturing sector growth and communication infrastructure expansion are facilitating adoption of specialized protection devices throughout major industrial regions.

India Demonstrates Strong Market Potential with Electrification Growth

India is expanding to reach USD 657.3 million by 2035, supported by extensive rural electrification programs and comprehensive industrial development initiatives creating sustained demand for reliable electrical protection across diverse power quality environments and cost-sensitive market segments. The country's expanding manufacturing sector and growing data center capabilities are driving demand for protection solutions that provide consistent performance while supporting competitive installation requirements. Equipment manufacturers and electrical contractors are investing in local distribution facilities to support growing project volumes and customer service demands.

Government electrification initiatives and smart city development programs are creating opportunities for protection devices across diverse installation categories requiring reliable performance and accessible price points. Infrastructure modernization and industrial facility construction are driving investments in protection systems supporting operational requirements throughout major metropolitan areas. Commercial building growth and telecommunications expansion programs are enhancing demand for application-specific protection devices throughout emerging market regions.

Germany Maintains Leadership with Technical Standards Excellence

Demand for Type 2 Surge Protection Devices in Germany is projected to reach USD 724.8 million by 2035, supported by the country's leadership in electrical engineering standards and advanced industrial automation technologies requiring sophisticated protection systems for Industry 4.0 manufacturing facilities and renewable energy installations. German manufacturers including Siemens, Phoenix Contact, and DEHN maintain premium market positioning through technical innovation, comprehensive testing protocols, and extensive application support services. The market is characterized by focus on operational reliability, system integration capabilities, and compliance with stringent safety and performance standards.

Industrial equipment manufacturers are prioritizing intelligent protection technologies that demonstrate remote monitoring capabilities and predictive maintenance features while meeting German electrical codes and insurance requirements. Renewable energy leadership programs and distributed generation integration initiatives are driving adoption of coordinated protection systems that support photovoltaic installations, wind farms, and energy storage facilities. Research and development programs for smart grid technologies are facilitating adoption of networked protection devices throughout major industrial centers.

United States Expands Market with Code Adoption Growth

The United States is growing to reach USD 692.1 million by 2035, driven by National Electrical Code updates mandating surge protection and increasing data center construction creating sustained opportunities for device suppliers serving both commercial construction projects and industrial facility contractors. The country's extensive electrical infrastructure base and expanding code compliance awareness are creating demand for protection devices that support diverse installation requirements while maintaining competitive pricing standards. Manufacturers and distribution partners are developing market strategies to support contractor education and specification assistance programs.

Building code modernization programs and insurance industry protection requirements are facilitating adoption of surge protection devices capable of supporting whole-building protection architectures and equipment-specific applications. Data center growth and communication infrastructure expansion programs are enhancing demand for high-performance devices that support operational uptime requirements and sensitive equipment protection. Industrial facility modernization and commercial construction activity are creating opportunities for coordinated protection capabilities across American electrical distribution systems.

United Kingdom Focuses on Standards Compliance

Demand for Type 2 Surge Protection Devices in United Kingdom is projected to reach USD 448.2 million by 2035, expanding at a CAGR of 4.3%, driven by BS 7671 wiring regulations requiring surge protection assessment and commercial facility modernization supporting advanced electrical safety capabilities. The country's established electrical contracting industry and growing renewable energy installations are creating demand for protection devices that support regulatory compliance and operational performance standards. Equipment distributors and installation contractors are maintaining comprehensive product portfolios to support diverse project requirements.

Commercial building modernization and industrial facility upgrade programs are supporting demand for protection devices that meet contemporary performance and reliability standards. Data center development and telecommunications infrastructure programs are creating opportunities for specialized protection systems that provide comprehensive equipment protection. Construction sector recovery and infrastructure investment programs are facilitating adoption of certified protection capabilities throughout major commercial regions.

Japan Advances Market with Quality Standards

Japan is projected to reach USD 521.7 million by 2035, expanding at a CAGR of 3.8%, driven by premium equipment protection requirements and comprehensive electrical safety standards supporting advanced manufacturing operations and critical facility protection. The country's established quality culture and sophisticated building systems are creating demand for high-performance protection devices that support operational reliability and equipment longevity requirements. Manufacturers including Mitsubishi Electric, Fuji Electric, and Panasonic maintain comprehensive product development capabilities to support diverse installation requirements.

Industrial manufacturing excellence and precision equipment operations are supporting demand for protection devices that meet stringent performance and reliability standards. Urban infrastructure modernization and commercial facility development programs are creating opportunities for intelligent protection systems that provide comprehensive monitoring capabilities. Renewable energy integration and distributed generation programs are facilitating adoption of coordinated protection architectures throughout major industrial regions.
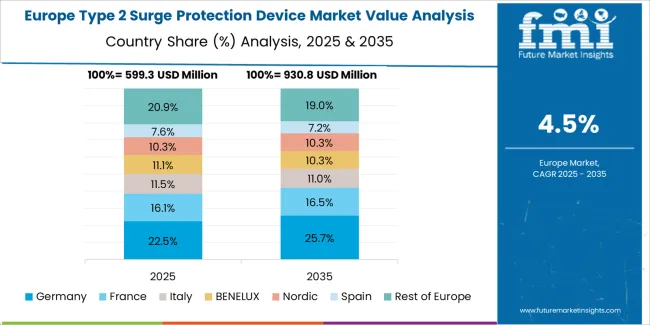
What is the market split by country in Europe?

Type 2 Surge Protection Device Market Europe Country Market Share Analysis, 2025 & 2035

The Type 2 surge protection device market in Europe is projected to grow from USD 831.6 million in 2025 to USD 1,354.2 million by 2035, registering a CAGR of 5.0% over the forecast period. Germany is expected to maintain its leadership position with a 28.4% market share in 2025, declining slightly to 27.6% by 2035, supported by its advanced industrial infrastructure and stringent electrical safety standards requiring comprehensive surge protection across manufacturing facilities, commercial installations, and residential construction.

France follows with a 19.3% share in 2025, projected to reach 19.8% by 2035, driven by nuclear power infrastructure protection requirements and comprehensive building code mandates for electrical safety systems. The United Kingdom holds a 16.7% share in 2025, expected to stabilize at 16.5% by 2035 as post-Brexit regulatory alignment maintains equivalence with European standards. Italy commands a 14.9% share, while Spain accounts for 12.2% in 2025. The Rest of Europe region is anticipated to gain momentum, expanding its collective share from 8.5% to 9.2% by 2035, attributed to increasing protection device adoption in Nordic countries implementing smart grid technologies and Eastern European markets modernizing electrical infrastructure to meet European Union safety directives.
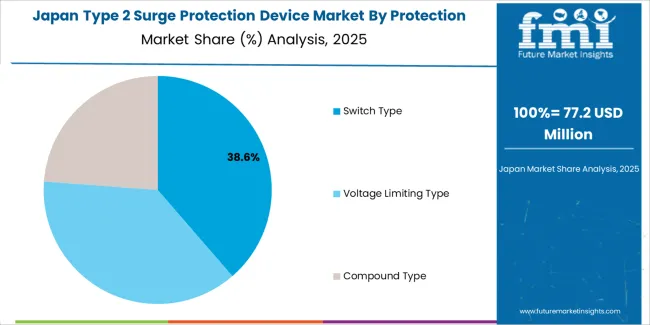
Japan Maintains Premium Market Position Through Quality Standards

Type 2 Surge Protection Device Market Japan Market Share Analysis By Protection Type

Japanese Type 2 surge protection device operations reflect the country's emphasis on electrical safety and equipment reliability across industrial, commercial, and residential applications. Major electrical equipment manufacturers including Mitsubishi Electric, Fuji Electric, and Panasonic maintain rigorous product development processes emphasizing high-temperature performance, compact dimensions for space-constrained panelboards, and extended service life meeting Japan's demanding quality expectations. The domestic market demonstrates preference for compound-type protection devices combining multiple technologies to address diverse transient threats in facilities with sensitive electronic equipment and critical production systems.

Regulatory oversight through the Ministry of Economy, Trade and Industry establishes comprehensive testing requirements and certification standards that often exceed international benchmarks, creating barriers for foreign suppliers while ensuring consistent protection performance. Japanese Industrial Standards specify installation requirements, coordination methodologies, and maintenance protocols that shape product development priorities for manufacturers serving domestic and export markets. The building code framework mandates surge protection for commercial facilities, medical installations, and high-rise residential buildings, creating stable demand for certified devices meeting Japanese specifications.

Supply chain management emphasizes long-term relationships between equipment manufacturers and electrical contractors, with technical support and training programs maintaining installation quality across distributed project networks. Companies invest in application engineering resources providing specification assistance and coordination studies for complex facilities requiring integrated protection architectures. The market structure rewards manufacturers demonstrating consistent product quality and responsive technical service rather than purely price-competitive positioning.
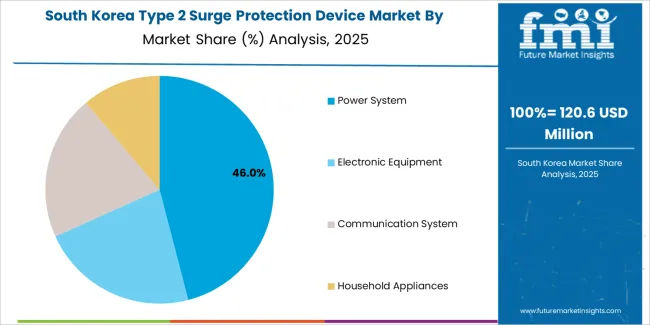
South Korea Advances Market Through Industrial Infrastructure Development

Type 2 Surge Protection Device Market South Korea Market Share Analysis By Application

South Korean Type 2 surge protection device operations benefit from the country's advanced industrial base and export-oriented manufacturing sector requiring comprehensive electrical protection systems. Major industrial conglomerates including Samsung, LG, and Hyundai drive sophisticated protection requirements through their manufacturing facilities, semiconductor fabrication plants, and electronics production operations demanding precise transient overvoltage control to prevent equipment damage and production disruptions.

The Korean market demonstrates particular strength in applying surge protection to semiconductor manufacturing equipment, automated production lines, and cleanroom facilities where electrical disturbances can result in significant yield losses and quality control failures. Companies require specific coordination studies and protection architectures that integrate with existing power distribution systems while meeting stringent electromagnetic compatibility requirements for sensitive process equipment.

Regulatory frameworks emphasize electrical safety and equipment protection, with Korean Electrical Code requirements establishing minimum protection standards for industrial facilities, commercial buildings, and critical infrastructure installations. The certification environment requires comprehensive testing documentation and third-party verification that creates barriers for uncertified suppliers while ensuring consistent protection performance across installed base.

Supply chain efficiency remains critical for timely project completion in Korea's fast-paced construction environment. Manufacturers maintain local inventory and technical support capabilities to meet short lead times demanded by general contractors and electrical engineering firms managing concurrent projects across industrial and commercial sectors. The market increasingly pursues digital integration capabilities with building management systems and remote monitoring platforms supporting proactive maintenance strategies.
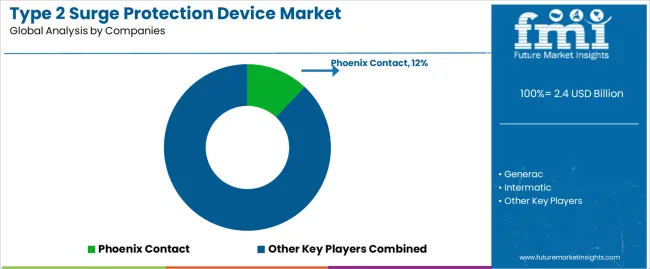
What factors define the competitive landscape of the Type 2 surge protection device market?

Type 2 Surge Protection Device Market Analysis By Company

Profit pools are consolidating upstream in component manufacturing for metal oxide varistors and gas discharge tubes while downstream value concentrates in application engineering services and coordinated protection system design where technical expertise and installation support command premiums over commodity device sales. Value is migrating from standalone product transactions to integrated protection architectures where certification, coordination studies, and lifecycle support differentiate market leaders from volume-oriented suppliers. Several archetypes define competitive dynamics: global electrical equipment manufacturers leveraging brand recognition and distribution networks to maintain market share across industrial and commercial segments; specialized surge protection suppliers capturing premium applications through technical service capabilities and custom solutions; regional manufacturers competing on price in cost-sensitive markets; and component suppliers pursuing vertical integration to capture system-level margins.

Switching costs for end users remain moderate due to standardized mounting configurations and electrical specifications, but technical risk from improper device coordination creates barriers favoring established suppliers with proven track records and engineering support capabilities. Supply chain disruptions affecting semiconductor components and raw materials periodically reshape competitive dynamics as manufacturers with diversified sourcing networks gain advantage over single-source operations. Market consolidation continues through acquisitions of regional suppliers by multinational corporations seeking geographic expansion and technology portfolios, while digital transformation initiatives enable new service models combining hardware sales with remote monitoring and predictive maintenance offerings.

Stakeholder Type Primary Advantage Repeatable Plays
Global electrical equipment manufacturers Brand recognition, distribution scale, product breadth Multi-product bundling, contractor relationships, technical training programs
Specialized protection suppliers Technical expertise, custom solutions, application engineering Coordination studies, custom specifications, premium positioning
Regional manufacturers Cost structure, local relationships, market knowledge Price competition, regional codes, distributor networks
Component suppliers Material science, manufacturing efficiency, vertical integration Technology licensing, OEM relationships, capacity investment
Distribution networks Contractor access, inventory management, logistics Stock programs, counter sales, project quotations

Key Players in the Type 2 Surge Protection Device Market

  • Phoenix Contact
  • Generac
  • Intermatic
  • Leviton
  • Mersen
  • Siemens
  • Onccy
  • PD Devices
  • Shanghai Chenzhu Instrument
  • LSP
  • SUNTREE
  • Anhui Jinli Electric Tech
  • Yuelong Electric
  • Schneider Electric
  • Eaton
  • Littelfuse
  • ABB
  • CITEL
  • FATECH ELECTRONIC (FOSHAN)

Scope of the Report

Items Values
Quantitative Units USD 2.4 billion
Protection Type Switch Type, Voltage Limiting Type, Compound Type
Application Power System, Electronic Equipment, Communication System, Household Appliances
Regions Covered North America, Latin America, Europe, Asia Pacific, Middle East & Africa
Country Covered United States, Germany, United Kingdom, China, India, Japan, Brazil, and other 40+ countries
Key Companies Profiled Phoenix Contact, Generac, Intermatic, Leviton, Mersen, Siemens, Onccy, PD Devices, Shanghai Chenzhu Instrument, LSP, SUNTREE, Anhui Jinli Electric Tech, Yuelong Electric, Schneider Electric, Eaton, Littelfuse, ABB, CITEL, FATECH ELECTRONIC (FOSHAN)
Additional Attributes Dollar sales by protection type/application, regional demand (NA, EU, APAC), competitive landscape, technology adoption trends, industrial/commercial installation dynamics, and smart monitoring innovations driving electrical safety, equipment protection, and operational reliability

Type 2 Surge Protection Device Market Segmentation

By Protection Type

  • Switch Type
  • Voltage Limiting Type
  • Compound Type

By Application

  • Power System
  • Electronic Equipment
  • Communication System
  • Household Appliances

By Region

  • North America
  • Europe
  • Asia Pacific
  • Latin America
  • Middle East & Africa

Frequently Asked Questions

How big is the type 2 surge protection device market in 2025?

The global type 2 surge protection device market is estimated to be valued at USD 2.4 billion in 2025.

What will be the size of type 2 surge protection device market in 2035?

The market size for the type 2 surge protection device market is projected to reach USD 3.9 billion by 2035.

How much will be the type 2 surge protection device market growth between 2025 and 2035?

The type 2 surge protection device market is expected to grow at a 5.0% CAGR between 2025 and 2035.

What are the key product types in the type 2 surge protection device market?

The key product types in type 2 surge protection device market are switch type, voltage limiting type and compound type.

Which application segment to contribute significant share in the type 2 surge protection device market in 2025?

In terms of application, power system segment to command 47.8% share in the type 2 surge protection device market in 2025.

Table of Content

  1. Executive Summary
    • Global Market Outlook
    • Demand to side Trends
    • Supply to side Trends
    • Technology Roadmap Analysis
    • Analysis and Recommendations
  2. Market Overview
    • Market Coverage / Taxonomy
    • Market Definition / Scope / Limitations
  3. Market Background
    • Market Dynamics
      • Drivers
      • Restraints
      • Opportunity
      • Trends
    • Scenario Forecast
      • Demand in Optimistic Scenario
      • Demand in Likely Scenario
      • Demand in Conservative Scenario
    • Opportunity Map Analysis
    • Product Life Cycle Analysis
    • Supply Chain Analysis
    • Investment Feasibility Matrix
    • Value Chain Analysis
    • PESTLE and Porter’s Analysis
    • Regulatory Landscape
    • Regional Parent Market Outlook
    • Production and Consumption Statistics
    • Import and Export Statistics
  4. Global Market Analysis 2020 to 2024 and Forecast, 2025 to 2035
    • Historical Market Size Value (USD Million) Analysis, 2020 to 2024
    • Current and Future Market Size Value (USD Million) Projections, 2025 to 2035
      • Y to o to Y Growth Trend Analysis
      • Absolute $ Opportunity Analysis
  5. Global Market Pricing Analysis 2020 to 2024 and Forecast 2025 to 2035
  6. Global Market Analysis 2020 to 2024 and Forecast 2025 to 2035, By Protection Type
    • Introduction / Key Findings
    • Historical Market Size Value (USD Million) Analysis By Protection Type , 2020 to 2024
    • Current and Future Market Size Value (USD Million) Analysis and Forecast By Protection Type , 2025 to 2035
      • Switch Type
      • Voltage Limiting Type
      • Compound Type
    • Y to o to Y Growth Trend Analysis By Protection Type , 2020 to 2024
    • Absolute $ Opportunity Analysis By Protection Type , 2025 to 2035
  7. Global Market Analysis 2020 to 2024 and Forecast 2025 to 2035, By Application
    • Introduction / Key Findings
    • Historical Market Size Value (USD Million) Analysis By Application, 2020 to 2024
    • Current and Future Market Size Value (USD Million) Analysis and Forecast By Application, 2025 to 2035
      • Power System
      • Electronic Equipment
      • Communication System
      • Household Appliances
    • Y to o to Y Growth Trend Analysis By Application, 2020 to 2024
    • Absolute $ Opportunity Analysis By Application, 2025 to 2035
  8. Global Market Analysis 2020 to 2024 and Forecast 2025 to 2035, By Region
    • Introduction
    • Historical Market Size Value (USD Million) Analysis By Region, 2020 to 2024
    • Current Market Size Value (USD Million) Analysis and Forecast By Region, 2025 to 2035
      • North America
      • Latin America
      • Western Europe
      • Eastern Europe
      • East Asia
      • South Asia and Pacific
      • Middle East & Africa
    • Market Attractiveness Analysis By Region
  9. North America Market Analysis 2020 to 2024 and Forecast 2025 to 2035, By Country
    • Historical Market Size Value (USD Million) Trend Analysis By Market Taxonomy, 2020 to 2024
    • Market Size Value (USD Million) Forecast By Market Taxonomy, 2025 to 2035
      • By Country
        • USA
        • Canada
        • Mexico
      • By Protection Type
      • By Application
    • Market Attractiveness Analysis
      • By Country
      • By Protection Type
      • By Application
    • Key Takeaways
  10. Latin America Market Analysis 2020 to 2024 and Forecast 2025 to 2035, By Country
    • Historical Market Size Value (USD Million) Trend Analysis By Market Taxonomy, 2020 to 2024
    • Market Size Value (USD Million) Forecast By Market Taxonomy, 2025 to 2035
      • By Country
        • Brazil
        • Chile
        • Rest of Latin America
      • By Protection Type
      • By Application
    • Market Attractiveness Analysis
      • By Country
      • By Protection Type
      • By Application
    • Key Takeaways
  11. Western Europe Market Analysis 2020 to 2024 and Forecast 2025 to 2035, By Country
    • Historical Market Size Value (USD Million) Trend Analysis By Market Taxonomy, 2020 to 2024
    • Market Size Value (USD Million) Forecast By Market Taxonomy, 2025 to 2035
      • By Country
        • Germany
        • UK
        • Italy
        • Spain
        • France
        • Nordic
        • BENELUX
        • Rest of Western Europe
      • By Protection Type
      • By Application
    • Market Attractiveness Analysis
      • By Country
      • By Protection Type
      • By Application
    • Key Takeaways
  12. Eastern Europe Market Analysis 2020 to 2024 and Forecast 2025 to 2035, By Country
    • Historical Market Size Value (USD Million) Trend Analysis By Market Taxonomy, 2020 to 2024
    • Market Size Value (USD Million) Forecast By Market Taxonomy, 2025 to 2035
      • By Country
        • Russia
        • Poland
        • Hungary
        • Balkan & Baltic
        • Rest of Eastern Europe
      • By Protection Type
      • By Application
    • Market Attractiveness Analysis
      • By Country
      • By Protection Type
      • By Application
    • Key Takeaways
  13. East Asia Market Analysis 2020 to 2024 and Forecast 2025 to 2035, By Country
    • Historical Market Size Value (USD Million) Trend Analysis By Market Taxonomy, 2020 to 2024
    • Market Size Value (USD Million) Forecast By Market Taxonomy, 2025 to 2035
      • By Country
        • China
        • Japan
        • South Korea
      • By Protection Type
      • By Application
    • Market Attractiveness Analysis
      • By Country
      • By Protection Type
      • By Application
    • Key Takeaways
  14. South Asia and Pacific Market Analysis 2020 to 2024 and Forecast 2025 to 2035, By Country
    • Historical Market Size Value (USD Million) Trend Analysis By Market Taxonomy, 2020 to 2024
    • Market Size Value (USD Million) Forecast By Market Taxonomy, 2025 to 2035
      • By Country
        • India
        • ASEAN
        • Australia & New Zealand
        • Rest of South Asia and Pacific
      • By Protection Type
      • By Application
    • Market Attractiveness Analysis
      • By Country
      • By Protection Type
      • By Application
    • Key Takeaways
  15. Middle East & Africa Market Analysis 2020 to 2024 and Forecast 2025 to 2035, By Country
    • Historical Market Size Value (USD Million) Trend Analysis By Market Taxonomy, 2020 to 2024
    • Market Size Value (USD Million) Forecast By Market Taxonomy, 2025 to 2035
      • By Country
        • Kingdom of Saudi Arabia
        • Other GCC Countries
        • Turkiye
        • South Africa
        • Other African Union
        • Rest of Middle East & Africa
      • By Protection Type
      • By Application
    • Market Attractiveness Analysis
      • By Country
      • By Protection Type
      • By Application
    • Key Takeaways
  16. Key Countries Market Analysis
    • USA
      • Pricing Analysis
      • Market Share Analysis, 2024
        • By Protection Type
        • By Application
    • Canada
      • Pricing Analysis
      • Market Share Analysis, 2024
        • By Protection Type
        • By Application
    • Mexico
      • Pricing Analysis
      • Market Share Analysis, 2024
        • By Protection Type
        • By Application
    • Brazil
      • Pricing Analysis
      • Market Share Analysis, 2024
        • By Protection Type
        • By Application
    • Chile
      • Pricing Analysis
      • Market Share Analysis, 2024
        • By Protection Type
        • By Application
    • Germany
      • Pricing Analysis
      • Market Share Analysis, 2024
        • By Protection Type
        • By Application
    • UK
      • Pricing Analysis
      • Market Share Analysis, 2024
        • By Protection Type
        • By Application
    • Italy
      • Pricing Analysis
      • Market Share Analysis, 2024
        • By Protection Type
        • By Application
    • Spain
      • Pricing Analysis
      • Market Share Analysis, 2024
        • By Protection Type
        • By Application
    • France
      • Pricing Analysis
      • Market Share Analysis, 2024
        • By Protection Type
        • By Application
    • India
      • Pricing Analysis
      • Market Share Analysis, 2024
        • By Protection Type
        • By Application
    • ASEAN
      • Pricing Analysis
      • Market Share Analysis, 2024
        • By Protection Type
        • By Application
    • Australia & New Zealand
      • Pricing Analysis
      • Market Share Analysis, 2024
        • By Protection Type
        • By Application
    • China
      • Pricing Analysis
      • Market Share Analysis, 2024
        • By Protection Type
        • By Application
    • Japan
      • Pricing Analysis
      • Market Share Analysis, 2024
        • By Protection Type
        • By Application
    • South Korea
      • Pricing Analysis
      • Market Share Analysis, 2024
        • By Protection Type
        • By Application
    • Russia
      • Pricing Analysis
      • Market Share Analysis, 2024
        • By Protection Type
        • By Application
    • Poland
      • Pricing Analysis
      • Market Share Analysis, 2024
        • By Protection Type
        • By Application
    • Hungary
      • Pricing Analysis
      • Market Share Analysis, 2024
        • By Protection Type
        • By Application
    • Kingdom of Saudi Arabia
      • Pricing Analysis
      • Market Share Analysis, 2024
        • By Protection Type
        • By Application
    • Turkiye
      • Pricing Analysis
      • Market Share Analysis, 2024
        • By Protection Type
        • By Application
    • South Africa
      • Pricing Analysis
      • Market Share Analysis, 2024
        • By Protection Type
        • By Application
  17. Market Structure Analysis
    • Competition Dashboard
    • Competition Benchmarking
    • Market Share Analysis of Top Players
      • By Regional
      • By Protection Type
      • By Application
  18. Competition Analysis
    • Competition Deep Dive
      • Phoenix Contact
        • Overview
        • Product Portfolio
        • Profitability by Market Segments (Product/Age /Sales Channel/Region)
        • Sales Footprint
        • Strategy Overview
          • Marketing Strategy
          • Product Strategy
          • Channel Strategy
      • Generac
      • Intermatic
      • Leviton
      • Mersen
      • Siemens
      • Onccy
      • PD Devices
      • Shanghai Chenzhu Instrument
      • LSP
      • SUNTREE
      • Anhui Jinli Electric Tech
      • Yuelong Electric
      • Schneider Electric
      • Eaton
      • Littelfuse
      • ABB
      • CITEL
      • FATECH ELECTRONIC (FOSHAN)
  19. Assumptions & Acronyms Used
  20. Research Methodology

List of Tables

  • Table 1: Global Market Value (USD Million) Forecast by Region, 2020 to 2035
  • Table 2: Global Market Value (USD Million) Forecast by Protection Type , 2020 to 2035
  • Table 3: Global Market Value (USD Million) Forecast by Application, 2020 to 2035
  • Table 4: North America Market Value (USD Million) Forecast by Country, 2020 to 2035
  • Table 5: North America Market Value (USD Million) Forecast by Protection Type , 2020 to 2035
  • Table 6: North America Market Value (USD Million) Forecast by Application, 2020 to 2035
  • Table 7: Latin America Market Value (USD Million) Forecast by Country, 2020 to 2035
  • Table 8: Latin America Market Value (USD Million) Forecast by Protection Type , 2020 to 2035
  • Table 9: Latin America Market Value (USD Million) Forecast by Application, 2020 to 2035
  • Table 10: Western Europe Market Value (USD Million) Forecast by Country, 2020 to 2035
  • Table 11: Western Europe Market Value (USD Million) Forecast by Protection Type , 2020 to 2035
  • Table 12: Western Europe Market Value (USD Million) Forecast by Application, 2020 to 2035
  • Table 13: Eastern Europe Market Value (USD Million) Forecast by Country, 2020 to 2035
  • Table 14: Eastern Europe Market Value (USD Million) Forecast by Protection Type , 2020 to 2035
  • Table 15: Eastern Europe Market Value (USD Million) Forecast by Application, 2020 to 2035
  • Table 16: East Asia Market Value (USD Million) Forecast by Country, 2020 to 2035
  • Table 17: East Asia Market Value (USD Million) Forecast by Protection Type , 2020 to 2035
  • Table 18: East Asia Market Value (USD Million) Forecast by Application, 2020 to 2035
  • Table 19: South Asia and Pacific Market Value (USD Million) Forecast by Country, 2020 to 2035
  • Table 20: South Asia and Pacific Market Value (USD Million) Forecast by Protection Type , 2020 to 2035
  • Table 21: South Asia and Pacific Market Value (USD Million) Forecast by Application, 2020 to 2035
  • Table 22: Middle East & Africa Market Value (USD Million) Forecast by Country, 2020 to 2035
  • Table 23: Middle East & Africa Market Value (USD Million) Forecast by Protection Type , 2020 to 2035
  • Table 24: Middle East & Africa Market Value (USD Million) Forecast by Application, 2020 to 2035

List of Figures

  • Figure 1: Global Market Pricing Analysis
  • Figure 2: Global Market Value (USD Million) Forecast 2020-2035
  • Figure 3: Global Market Value Share and BPS Analysis by Protection Type , 2025 and 2035
  • Figure 4: Global Market Y-o-Y Growth Comparison by Protection Type , 2025-2035
  • Figure 5: Global Market Attractiveness Analysis by Protection Type
  • Figure 6: Global Market Value Share and BPS Analysis by Application, 2025 and 2035
  • Figure 7: Global Market Y-o-Y Growth Comparison by Application, 2025-2035
  • Figure 8: Global Market Attractiveness Analysis by Application
  • Figure 9: Global Market Value (USD Million) Share and BPS Analysis by Region, 2025 and 2035
  • Figure 10: Global Market Y-o-Y Growth Comparison by Region, 2025-2035
  • Figure 11: Global Market Attractiveness Analysis by Region
  • Figure 12: North America Market Incremental Dollar Opportunity, 2025-2035
  • Figure 13: Latin America Market Incremental Dollar Opportunity, 2025-2035
  • Figure 14: Western Europe Market Incremental Dollar Opportunity, 2025-2035
  • Figure 15: Eastern Europe Market Incremental Dollar Opportunity, 2025-2035
  • Figure 16: East Asia Market Incremental Dollar Opportunity, 2025-2035
  • Figure 17: South Asia and Pacific Market Incremental Dollar Opportunity, 2025-2035
  • Figure 18: Middle East & Africa Market Incremental Dollar Opportunity, 2025-2035
  • Figure 19: North America Market Value Share and BPS Analysis by Country, 2025 and 2035
  • Figure 20: North America Market Value Share and BPS Analysis by Protection Type , 2025 and 2035
  • Figure 21: North America Market Y-o-Y Growth Comparison by Protection Type , 2025-2035
  • Figure 22: North America Market Attractiveness Analysis by Protection Type
  • Figure 23: North America Market Value Share and BPS Analysis by Application, 2025 and 2035
  • Figure 24: North America Market Y-o-Y Growth Comparison by Application, 2025-2035
  • Figure 25: North America Market Attractiveness Analysis by Application
  • Figure 26: Latin America Market Value Share and BPS Analysis by Country, 2025 and 2035
  • Figure 27: Latin America Market Value Share and BPS Analysis by Protection Type , 2025 and 2035
  • Figure 28: Latin America Market Y-o-Y Growth Comparison by Protection Type , 2025-2035
  • Figure 29: Latin America Market Attractiveness Analysis by Protection Type
  • Figure 30: Latin America Market Value Share and BPS Analysis by Application, 2025 and 2035
  • Figure 31: Latin America Market Y-o-Y Growth Comparison by Application, 2025-2035
  • Figure 32: Latin America Market Attractiveness Analysis by Application
  • Figure 33: Western Europe Market Value Share and BPS Analysis by Country, 2025 and 2035
  • Figure 34: Western Europe Market Value Share and BPS Analysis by Protection Type , 2025 and 2035
  • Figure 35: Western Europe Market Y-o-Y Growth Comparison by Protection Type , 2025-2035
  • Figure 36: Western Europe Market Attractiveness Analysis by Protection Type
  • Figure 37: Western Europe Market Value Share and BPS Analysis by Application, 2025 and 2035
  • Figure 38: Western Europe Market Y-o-Y Growth Comparison by Application, 2025-2035
  • Figure 39: Western Europe Market Attractiveness Analysis by Application
  • Figure 40: Eastern Europe Market Value Share and BPS Analysis by Country, 2025 and 2035
  • Figure 41: Eastern Europe Market Value Share and BPS Analysis by Protection Type , 2025 and 2035
  • Figure 42: Eastern Europe Market Y-o-Y Growth Comparison by Protection Type , 2025-2035
  • Figure 43: Eastern Europe Market Attractiveness Analysis by Protection Type
  • Figure 44: Eastern Europe Market Value Share and BPS Analysis by Application, 2025 and 2035
  • Figure 45: Eastern Europe Market Y-o-Y Growth Comparison by Application, 2025-2035
  • Figure 46: Eastern Europe Market Attractiveness Analysis by Application
  • Figure 47: East Asia Market Value Share and BPS Analysis by Country, 2025 and 2035
  • Figure 48: East Asia Market Value Share and BPS Analysis by Protection Type , 2025 and 2035
  • Figure 49: East Asia Market Y-o-Y Growth Comparison by Protection Type , 2025-2035
  • Figure 50: East Asia Market Attractiveness Analysis by Protection Type
  • Figure 51: East Asia Market Value Share and BPS Analysis by Application, 2025 and 2035
  • Figure 52: East Asia Market Y-o-Y Growth Comparison by Application, 2025-2035
  • Figure 53: East Asia Market Attractiveness Analysis by Application
  • Figure 54: South Asia and Pacific Market Value Share and BPS Analysis by Country, 2025 and 2035
  • Figure 55: South Asia and Pacific Market Value Share and BPS Analysis by Protection Type , 2025 and 2035
  • Figure 56: South Asia and Pacific Market Y-o-Y Growth Comparison by Protection Type , 2025-2035
  • Figure 57: South Asia and Pacific Market Attractiveness Analysis by Protection Type
  • Figure 58: South Asia and Pacific Market Value Share and BPS Analysis by Application, 2025 and 2035
  • Figure 59: South Asia and Pacific Market Y-o-Y Growth Comparison by Application, 2025-2035
  • Figure 60: South Asia and Pacific Market Attractiveness Analysis by Application
  • Figure 61: Middle East & Africa Market Value Share and BPS Analysis by Country, 2025 and 2035
  • Figure 62: Middle East & Africa Market Value Share and BPS Analysis by Protection Type , 2025 and 2035
  • Figure 63: Middle East & Africa Market Y-o-Y Growth Comparison by Protection Type , 2025-2035
  • Figure 64: Middle East & Africa Market Attractiveness Analysis by Protection Type
  • Figure 65: Middle East & Africa Market Value Share and BPS Analysis by Application, 2025 and 2035
  • Figure 66: Middle East & Africa Market Y-o-Y Growth Comparison by Application, 2025-2035
  • Figure 67: Middle East & Africa Market Attractiveness Analysis by Application
  • Figure 68: Global Market - Tier Structure Analysis
  • Figure 69: Global Market - Company Share Analysis
Dashboard
Dashboard
Dashboard
Dashboard
Dashboard
Dashboard

Full Research Suite comprises of:

Market outlook & trends analysis

Market outlook & trends analysis

Interviews & case studies

Interviews & case studies

Strategic recommendations

Strategic recommendations

Vendor profiles & capabilities analysis

Vendor profiles & capabilities analysis

5-year forecasts

5-year forecasts

8 regions and 60+ country-level data splits

8 regions and 60+ country-level data splits

Market segment data splits

Market segment data splits

12 months of continuous data updates

12 months of continuous data updates

DELIVERED AS:

PDF EXCEL ONLINE

Full Research Suite


$5000

$7500

$10000

Buy Report Now
Similar Industry Reports

Similar Industry Reports

Type-C Bulk Bags Market

Type-C Bulk Bags Market Size and Share Forecast Outlook 2025 to 2035

Type-C Bulk Bags Market Share Analysis

Competitive Overview of Type-C Bulk Bags Companies

Type 1 Commercial Surge Protection Devices Market

Type 1 Commercial Surge Protection Devices Market Size and Share Forecast Outlook 2025 to 2035

V-type Classifiers Market

V-type Classifiers Market Size and Share Forecast Outlook 2025 to 2035

V Type Fin Condenser Market

V Type Fin Condenser Market Size and Share Forecast Outlook 2025 to 2035

V Type Air Cooled Condenser Market

V Type Air Cooled Condenser Market Size and Share Forecast Outlook 2025 to 2035

Dry-type Air-core Smoothing Reactor Market

Dry-type Air-core Smoothing Reactor Market Size and Share Forecast Outlook 2025 to 2035

USB Type C Market
USB Type C Market

USB Type C Market Size and Share Forecast Outlook 2025 to 2035

Gel-Type Strong Acid Cation Exchange Resin Market

Gel-Type Strong Acid Cation Exchange Resin Market Size and Share Forecast Outlook 2025 to 2035

Dry Type Distribution Transformer Market

Dry Type Distribution Transformer Market Size and Share Forecast Outlook 2025 to 2035

Dry Type Current Transformer Market

Dry Type Current Transformer Market Size and Share Forecast Outlook 2025 to 2035

Dry Type Automated Solar Panel Cleaning Market

Dry Type Automated Solar Panel Cleaning Market Size and Share Forecast Outlook 2025 to 2035

Dry Type Transformer Market

Dry Type Transformer Market Size and Share Forecast Outlook 2025 to 2035

USB Type-C Market Share Analysis

Market Share Insights of the USB Type-C Industry

Stud Type Track Roller Market

Stud Type Track Roller Market Size and Share Forecast Outlook 2025 to 2035

Foam Type Vacuum Gripping System Market

Foam Type Vacuum Gripping System Market Size and Share Forecast Outlook 2025 to 2035

Roll Type Thermal Paper Market

Roll Type Thermal Paper Market Forecast and Outlook 2025 to 2035

Brush-Type Belt Cleaners Market

Brush-Type Belt Cleaners Market Size and Share Forecast Outlook 2025 to 2035

Blade-type Belt Cleaners Market

Blade-type Belt Cleaners Market Size and Share Forecast Outlook 2025 to 2035

Epoxy Type Stabilizers Market

Epoxy Type Stabilizers Market Size and Share Forecast Outlook 2025 to 2035

Future Market Insights

Type 2 Surge Protection Device Market

Chat With MaRIA

Chat With

MaRIA

Hi There, I am MaRIA, Your Market Research Intelligence Assistant. How may I help you?