


Dry-type Air-core Smoothing Reactor Market : Global Industry Analysis 2015 - 2024 and Opportunity Assessment 2025 - 2035
Dry-type Air-core Smoothing Reactor Market Size and Share Forecast Outlook 2025 to 2035
Historical Data Covered: 2015 - 2024 | Base Year: 2024 | Estimated Year: 2025 | Forecast Period: 2025 - 2035
Dry-type Air-core Smoothing Reactor Market Forecast and Outlook 2025 to 2035
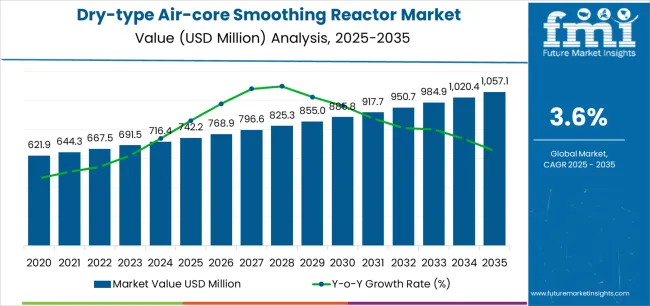
The dry-type air-core smoothing reactor market is expected to grow from USD 742.2 million in 2025 to USD 1,057.1 million by 2035. Key opportunities in the dry-type air core smoothing reactor market are emerging from the rapid expansion of HVDC transmission networks and large-scale renewable integration projects that require stable and distortion-free power flow. As utilities increase cross-regional transmission capacity to move solar and wind energy into high-demand load centers, smoothing reactors play a critical role in reducing current ripple, stabilizing converter operation, and improving the efficiency of long-distance high-voltage transfer. This is generating strong opportunities in regions advancing grid interconnection projects, such as the Asia Pacific, the Middle East, and parts of Europe.
Growing investment in grid modernization and power quality enhancement is also creating sustained demand. Industrial facilities with high-harmonic loads, including metal processing plants, chemical production units, and semiconductor fabs, are installing dry-type smoothing reactors to stabilize distribution networks and enhance equipment reliability. The shift away from oil-immersed reactors, driven by safety, maintenance, and environmental considerations, is reinforcing the adoption of air-core configurations that offer lower fire risk and lower lifecycle servicing costs. Another opportunity is emerging within renewable dense microgrids and hybrid distributed power systems, where compact and modular smoothing reactors are required to support localized control.
Quick Stats for Dry-type Air-core Smoothing Reactor Market
- Dry-type Air-core Smoothing Reactor Market Value (2025): USD 742.2 million
- Dry-type Air-core Smoothing Reactor Market Forecast Value (2035): USD 1,057.1 million
- Dry-type Air-core Smoothing Reactor Market Forecast CAGR: 3.6%
- Leading Application in Dry-type Air-core Smoothing Reactor Market: HVDC Transmission
- Key Growth Regions in Dry-type Air-core Smoothing Reactor Market: Asia Pacific, Europe, and North America
- Key Players in Dry-type Air-core Smoothing Reactor Market: Trench Group, Hilkar, Hada Electric
Where revenue comes from - now vs next (industry-level view)
| Period | Primary Revenue Buckets | Share | Notes |
|---|---|---|---|
| Today | HVDC transmission systems | 42% | Converter stations, long-distance links |
| Renewable energy integration | 28% | Wind farms, solar installations | |
| Industrial power systems | 18% | Manufacturing facilities, processing plants | |
| Power quality applications | 12% | Grid stabilization, harmonic filtering | |
| Future (3-5 yrs) | HVDC infrastructure expansion | 38-42% | Ultra-high voltage systems, submarine cables |
| Offshore renewable connections | 32-36% | Wind farm integration, marine installations | |
| Grid modernization programs | 16-20% | Smart grid upgrades, transmission enhancement | |
| Industrial electrification | 8-12% | High-power applications, data centers | |
| Energy storage integration | 4-8% | Battery systems, grid-scale storage |
Utility procurement patterns demonstrate shifting preferences toward dry-type air-core smoothing reactor systems that combine current ripple reduction, harmonic filtering capabilities, and environmental compliance. Transmission operators and renewable energy developers prioritize reactor reliability, operational consistency, and system compatibility when selecting power quality solutions for critical applications including HVDC converter stations, wind farm connections, solar installation interfaces, and industrial power distribution networks.
Growing emphasis on grid stability and power quality optimization creates opportunities for manufacturers offering validated reactor systems with comprehensive application expertise and performance assurance capabilities.
Technology advancement influences market evolution through integration of advanced insulation materials, enhanced cooling techniques, and modular design approaches that improve reactor performance and operational outcomes. Manufacturers focus on developing power solutions that accommodate varying voltage levels, operating conditions, and performance requirements while maintaining consistent current harmonization throughout extended service periods.
The dry-type air-core smoothing reactor market demonstrates strong growth fundamentals driven by expanding transmission activities, renewable energy infrastructure development, and increasing demand for precision power quality technologies across multiple industrial sectors and operational applications.
The first half of the decade (2025-2030) will witness market growth from USD 742.2 million to approximately USD 852.3 million, adding USD 110.1 million in value, representing 35% of the total forecast period expansion. This phase will be characterized by rapid adoption of advanced reactor technologies, driven by HVDC transmission programs and increasing demand for enhanced power quality capabilities across renewable energy applications.
The latter half (2030-2035) will experience accelerated growth from USD 852.3 million to USD 1,057.1 million, representing an addition of USD 204.8 million or 65% of the decade's expansion.
Dry-type Air-core Smoothing Reactor Market Key Takeaways
| Metric | Value |
|---|---|
| Market Value (2025) | USD 742.2 million |
| Market Forecast (2035) | USD 1,057.1 million |
| Growth Rate | 3.6% CAGR |
| Leading Application | HVDC Transmission |
| Primary End-Use | Utility Operations |
Utility operations drive primary demand, supported by increasing infrastructure development and grid modernization initiatives. Geographic distribution remains concentrated in developed markets with established transmission infrastructure, while emerging economies show accelerating adoption rates driven by renewable energy development programs and rising technology investment.
Imperatives for Stakeholders in Dry-type Air-core Smoothing Reactor Market
Design for performance enhancement, not just functionality
- Offer complete reactor systems: reactor units + mounting structures + cooling systems + monitoring equipment + commissioning services + maintenance protocols.
- Preconfigured power quality workflows: reactor specifications, installation procedures, performance validation protocols, and monitoring systems for transmission operations.
Grid integration readiness
- Real-time performance monitoring, power quality tracking, and smart grid integration (SCADA connectivity, data management systems).
Performance-by-design approach
- Advanced reactor design systems, real-time quality monitoring, performance validation, and comprehensive system documentation.
Value-based pricing models
- Clear reactor system price + transparent service tiers (installation services, performance testing, operational guarantees); subscriptions for maintenance and technical support.
How is the Reactor Market Segmented Across Technology, Applications, and Regions?
Primary Classification: The market segments by phase type into single-phase and three-phase configurations, representing evolution from traditional power factor correction systems to sophisticated current harmonization technologies for comprehensive power quality enhancement and transmission optimization.
Secondary Classification: Application segmentation divides the dry-type air-core smoothing reactor market into HVDC transmission, renewable energy integration, and industrial power systems, reflecting distinct requirements for reactor performance, voltage ratings, and operational specifications.
Tertiary Classification: End-use segmentation covers utility operations, industrial facilities, and renewable energy developers, while voltage ratings span medium voltage, high voltage, and extra high voltage applications.
Regional Classification: Geographic distribution covers North America, Latin America, Western Europe, Eastern Europe, Asia Pacific, South Asia, and Middle East & Africa, with developed markets leading adoption while emerging economies show accelerating growth patterns driven by transmission expansion programs.
The segmentation structure reveals technology progression from traditional iron-core systems toward sophisticated air-core reactors with enhanced performance capabilities, while application diversity spans from basic power quality improvement to specialized high-performance procedures requiring precise current harmonization solutions.
By Application, the HVDC Transmission Segment Accounts for Dominant Market Share
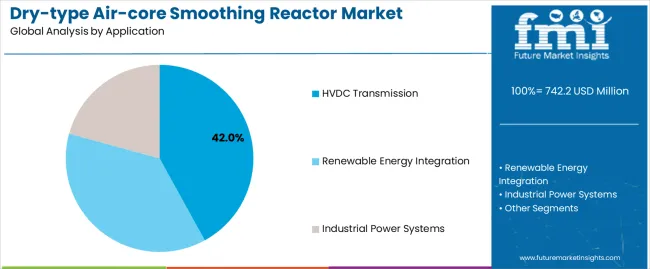
Market Position: HVDC transmission applications command the leading position in the dry-type air-core smoothing reactor market with 42% market share through proven current harmonization technologies, including enhanced ripple reduction, reliable performance capabilities, and transmission optimization that enable utility operators to achieve optimal system performance across diverse HVDC and renewable energy environments.
Value Drivers: The segment benefits from utility preference for high-performance reactor systems that provide consistent current smoothing, operational reliability, and system flexibility without requiring extensive maintenance. Advanced reactor processing features enable enhanced power quality, precise current control, and integration with existing transmission systems, where performance consistency and operational efficiency represent critical utility requirements.
Competitive Advantages: HVDC transmission applications differentiate through proven transmission reliability, comprehensive reactor specifications, and integration with established power systems that enhance operational effectiveness while maintaining optimal performance standards suitable for diverse transmission applications.
Key market characteristics:
- Advanced reactor designs with optimized current harmonization and transmission performance capabilities
- Transmission compatibility, including automated monitoring, quality control, and performance validation for utility operations
By End-Use, Utility Operations Drive Market Leadership
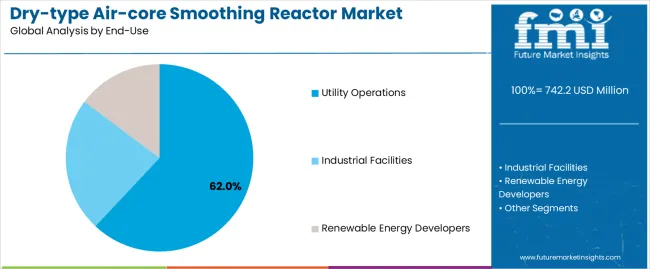
Market Context: Utility operations dominate the dry-type air-core smoothing reactor market with a 62% share, reflecting the primary demand source for dry-type air-core smoothing reactor technology in transmission optimization and power quality enhancement.
Business Model Advantages: Utility Operations provide direct market demand for standardized reactor systems, driving volume production and cost optimization while maintaining performance consistency and reliability requirements.
Operational Benefits: Utility Operation applications include transmission optimization, power quality enhancement, and system reliability assurance that drive consistent demand for reactor systems while providing access to latest current harmonization technologies.
What are the Drivers, Restraints, and Key Trends of the Dry-type Air-core Smoothing Reactor Market?
| Category | Factor | Impact | Why It Matters |
|---|---|---|---|
| Driver | HVDC transmission expansion & renewable energy integration (offshore wind connections, long-distance transmission) | ★★★★★ | Growing HVDC market requires advanced current harmonization systems with enhanced ripple reduction capabilities and thermal properties proven effective across transmission applications. |
| Driver | Grid modernization & power quality enhancement (smart grid integration, transmission upgrades) | ★★★★★ | Transforms reactor requirements from "basic power factor correction" to "precision current harmonization"; operators that offer advanced reactor systems and monitoring features gain competitive advantage. |
| Driver | Renewable energy development & grid integration (wind farms, solar installations) | ★★★★☆ | Modern renewable facilities need sophisticated, validated reactor systems; demand for certified and compliant power quality solutions expanding addressable market. |
| Restraint | High installation cost & technical complexity (especially for high-voltage applications) | ★★★★☆ | Smaller utility operators defer reactor upgrades; increases cost sensitivity and slows advanced technology adoption in price-conscious markets. |
| Restraint | Competition from oil-immersed reactors & technology alternatives (traditional solutions, hybrid systems) | ★★★☆☆ | Alternative reactor technologies limit dry-type adoption and increase competitive pressure, potentially constraining growth in conventional applications. |
| Trend | Advanced materials integration & modular design development (enhanced insulation, compact configurations) | ★★★★★ | Advanced reactor properties, performance optimization, and multi-functional capabilities transform operations; materials advancement and modular design become core value propositions. |
| Trend | Smart monitoring systems & predictive maintenance integration (IoT connectivity, digital monitoring) | ★★★★☆ | Intelligent reactor systems for specific applications and performance protocols; specialized monitoring and targeted optimization capabilities drive competition toward connected solutions. |
What is the Analysis of the Dry-type Air-core Smoothing Reactor Market by Key Country?
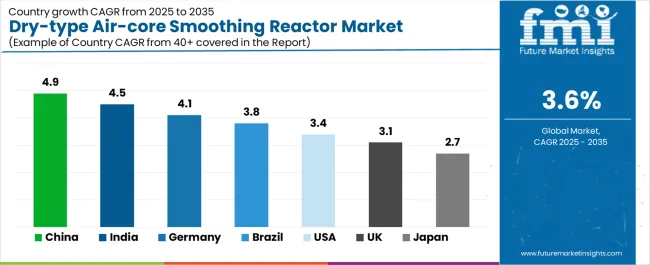
The dry-type air-core smoothing reactor market demonstrates varied regional dynamics with Growth Leaders including China (4.9% growth rate) and India (4.5% growth rate) driving expansion through transmission development and renewable energy initiatives. Steady Performers encompass Germany (4.1% growth rate), Brazil (3.8% growth rate), and developed regions, benefiting from established transmission infrastructure and renewable energy sector growth. Mature Markets feature United States (3.4% growth rate), United Kingdom (3.1% growth rate), and Japan (2.7% growth rate), where transmission modernization and power quality requirements support consistent growth patterns.
Regional synthesis reveals Asia Pacific markets leading adoption through transmission expansion and renewable energy development, while European countries maintain steady expansion supported by grid integration and technology investment. North American markets show strong growth driven by transmission applications and infrastructure modernization trends.
| Country | 2025-2035 Growth | How to win | What to watch out |
|---|---|---|---|
| China | 4.9% | Focus on cost-effective transmission solutions | Regulatory changes; local competition |
| India | 4.5% | Lead with renewable integration applications | Import restrictions; infrastructure barriers |
| Germany | 4.1% | Provide premium reactor systems | Over-regulation; lengthy approvals |
| Brazil | 3.8% | Offer value-oriented solutions | Currency fluctuations; import duties |
| USA | 3.4% | Push technology integration | Compliance costs; scaling challenges |
| UK | 3.1% | Focus on offshore applications | Economic impacts; funding constraints |
| Japan | 2.7% | Emphasize precision manufacturing | Traditional preferences; adoption rates |
Why is China Driving the Fastest Market Growth for Dry-Type Air-Core Smoothing Reactors?
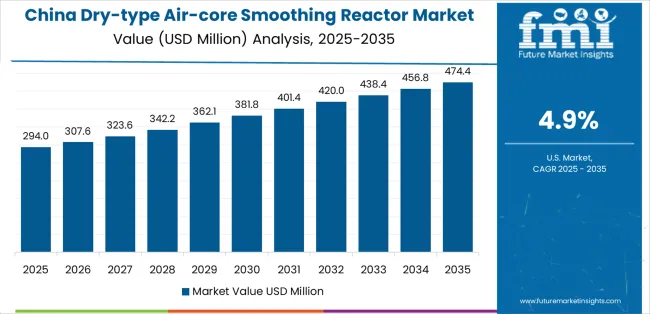
China establishes fastest market growth through aggressive transmission development programs and comprehensive renewable energy facility expansion, integrating advanced dry-type air-core smoothing reactor systems as standard components in HVDC stations and renewable energy installations. The country's 4.9% growth rate reflects government initiatives promoting transmission modernization and domestic reactor capabilities that mandate use of precision current harmonization systems in utility and renewable energy facilities. Growth concentrates in major industrial regions, including Beijing, Shanghai, and Guangzhou, where transmission development showcases integrated reactor systems that appeal to utility operators seeking current harmonization capabilities and transmission applications.
Chinese manufacturers are developing cost-effective reactor solutions that combine domestic production advantages with advanced current harmonization features, including enhanced ripple reduction and improved performance capabilities. Distribution channels through transmission equipment suppliers and utility integrators expand market access, while government support for grid development supports adoption across diverse transmission and renewable energy segments.
Strategic Market Indicators:
- Government transmission programs providing substantial funding for domestic reactor technology development
- Export market development for cost-effective current harmonization solutions targeting emerging transmission markets
What Makes India a High-Growth Market for Dry-Type Air-Core Smoothing Reactors?
In Mumbai, Delhi, and Bangalore, transmission facilities and renewable energy operators are implementing dry-type air-core smoothing reactor systems as standard equipment for power quality optimization and operational efficiency applications, driven by increasing government infrastructure investment and transmission development programs that emphasize importance of precision current harmonization capabilities. The dry-type air-core smoothing reactor market holds a 4.5% growth rate, supported by government transmission initiatives and facility modernization programs that promote advanced reactor systems for utility and renewable energy facilities. Indian operators are adopting current harmonization systems that provide consistent ripple reduction and performance features, particularly appealing in regions where transmission optimization and operational excellence represent critical infrastructure requirements.
Market expansion benefits from growing transmission capabilities and international technology partnerships that enable domestic production of advanced reactor systems for utility and renewable energy applications. Technology adoption follows patterns established in transmission equipment, where performance and efficiency drive procurement decisions and operational deployment.
Market Intelligence Brief:
- Transmission modernization programs emphasizing reactor systems for power quality effectiveness and operational excellence
- Local manufacturers partnering with international providers for current harmonization equipment development
- Utility facilities implementing reactor systems for transmission optimization and quality management
Why Does Germany Maintain Technology Leadership in Dry-Type Air-Core Smoothing Reactors?
Advanced transmission market in Germany demonstrates sophisticated dry-type air-core smoothing reactor deployment with documented performance effectiveness in renewable energy applications and utility facilities through integration with existing transmission systems and grid infrastructure. The country leverages engineering expertise in current harmonization technologies and precision systems integration to maintain a 4.1% growth rate. Transmission centers, including Bavaria, Baden-Württemberg, and North Rhine-Westphalia, showcase premium installations where reactor systems integrate with comprehensive transmission platforms and facility management systems to optimize power quality and operational effectiveness.
German manufacturers prioritize system quality and EU compliance in reactor development, creating demand for premium systems with advanced features, including facility integration and quality management systems. The dry-type air-core smoothing reactor market benefits from established transmission infrastructure and willingness to invest in advanced current harmonization technologies that provide long-term operational benefits and compliance with international transmission standards.
Market Intelligence Brief:
- Engineering focuses on EU standardization and precision compliance, driving premium segment growth
- Technology collaboration between German manufacturers and international reactor companies
- Professional training programs expanding reactor system integration in transmission scenarios
How is Brazil Showing Strong Regional Leadership in the Reactor Market?
Brazil's market expansion benefits from diverse transmission demand, including renewable energy modernization in São Paulo and Rio de Janeiro, utility facility upgrades, and government infrastructure programs that increasingly incorporate precision reactor solutions for transmission applications. The country maintains a 3.8% growth rate, driven by rising transmission activity and increasing recognition of current harmonization benefits, including accurate power quality control and enhanced operational effectiveness.
Market dynamics focus on cost-effective reactor solutions that balance current harmonization performance with affordability considerations important to Brazilian transmission operators. Growing infrastructure development creates continued demand for modern reactor systems in new transmission infrastructure and facility modernization projects.
Strategic Market Considerations:
- Transmission and renewable energy segments leading growth with focus on power quality control and operational effectiveness applications
- Regional transmission requirements driving diverse product portfolio from basic reactor systems to premium solutions
- Import dependency challenges offset by potential local production partnerships with international manufacturers
- Government infrastructure initiatives beginning to influence procurement standards and reactor requirements
Why is the United States Maintaining Market Leadership in Reactor Technology?
United States establishes market leadership through comprehensive transmission programs and advanced renewable energy infrastructure development, integrating dry-type air-core smoothing reactor systems across utility and industrial applications. The country's 3.4% growth rate reflects established transmission relationships and mature current harmonization technology adoption that supports widespread use of precision reactor systems in utility and renewable energy facilities. Growth concentrates in major transmission centers, including Texas, California, and the Northeast, where reactor technology showcases mature deployment that appeals to utility operators seeking proven performance capabilities and transmission optimization applications.
American transmission providers leverage established distribution networks and comprehensive technical support capabilities, including system design programs and training support that create customer relationships and operational advantages. The dry-type air-core smoothing reactor market benefits from mature regulatory standards and transmission requirements that mandate reactor system use while supporting technology advancement and performance optimization.
Market Intelligence Brief:
- Established regulatory standards providing consistent demand for current harmonization technology advancement
- Technology integration programs expanding reactor capabilities in transmission scenarios
How is the United Kingdom Emphasizing Premium Reactor Integration?
United Kingdom's transmission market demonstrates integrated dry-type air-core smoothing reactor deployment with documented performance effectiveness in renewable energy applications and utility facilities through integration with existing transmission systems and grid infrastructure. The country maintains a 3.1% growth rate, supported by operational efficiency programs and power quality requirements that promote precision reactor systems for transmission applications. Transmission facilities across England, Scotland, and Wales showcase systematic installations where reactor systems integrate with comprehensive transmission platforms to optimize precision and operational outcomes.
UK transmission providers prioritize system reliability and grid compatibility in reactor procurement, creating demand for validated systems with proven performance features, including quality monitoring integration and data management systems. The dry-type air-core smoothing reactor market benefits from established transmission infrastructure and quality requirements that support current harmonization technology adoption and operational effectiveness.
Market Intelligence Brief:
- Grid compatibility requirements driving standardized reactor system adoption
- Transmission partnerships providing performance validation and effectiveness data
- Technology integration between UK transmission providers and international reactor companies
- Professional training programs expanding reactor system deployment in transmission scenarios
What Drives Japan’s Precision Market Development in Reactor Systems?
Japan's market growth benefits from precision transmission demand, including advanced utility facilities in Tokyo and Osaka, quality integration, and precision enhancement programs that increasingly incorporate reactor solutions for transmission applications. The country maintains a 2.7% growth rate, driven by current harmonization technology advancement and increasing recognition of precision reactor benefits, including accurate current modification and enhanced operational outcomes.
Market dynamics focus on high-precision reactor solutions that meet Japanese quality standards and transmission effectiveness requirements important to utility operators. Advanced transmission technology adoption creates continued demand for sophisticated reactor systems in utility facility infrastructure and operational modernization projects.
Strategic Market Considerations:
- Utility and precision segments leading growth with focus on advanced reactor systems and quality applications
- Quality requirements driving premium product adoption from advanced current harmonization systems
- Technology integration challenges balanced by strong precision effectiveness and quality capabilities
- Transmission quality initiatives beginning to influence procurement standards and reactor requirements
How is the European Dry-type Air-core Smoothing Reactor Market Distributed by Country?
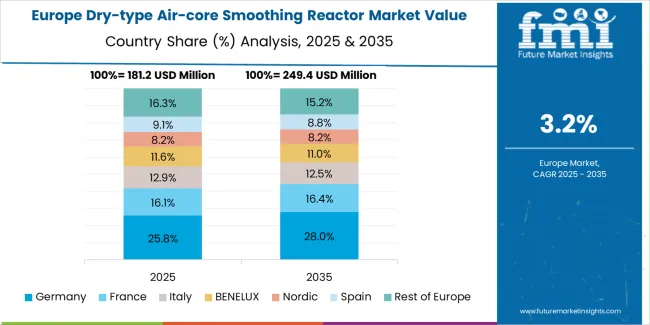
The European dry-type air-core smoothing reactor market is projected to grow from USD 198.4 million in 2025 to USD 278.6 million by 2035, registering a CAGR of 3.5% over the forecast period. Germany is expected to maintain its leadership position with a 31.2% market share in 2025, supported by its advanced transmission infrastructure and major renewable energy centers.
United Kingdom follows with a 22.4% share in 2025, driven by comprehensive offshore wind programs and grid development initiatives. France holds a 19.8% share through specialized transmission applications and grid compliance requirements. Italy commands a 13.1% share, while Spain accounts for 8.7% in 2025. The rest of Europe region is anticipated to gain momentum, expanding its collective share from 4.8% to 5.2% by 2035, attributed to increasing reactor adoption in Nordic countries and emerging transmission facilities implementing grid modernization programs.
What is the Competitive Landscape of the Dry-type Air-core Smoothing Reactor Market?
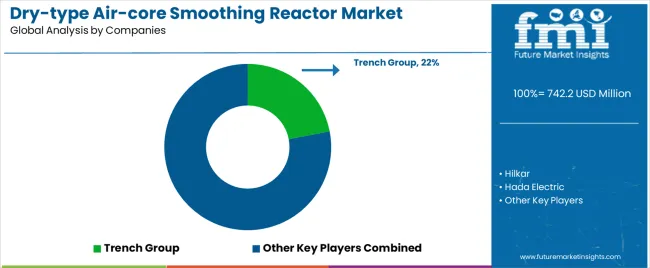
- Leading Company Share: Trench Group: 22% share
- Structure: ~10-12 credible players; top 4-5 hold ~60-65% by revenue.
- Leadership is maintained through: distribution networks, technology innovation, and product development (reactor performance + reliability + system integration).
- What's commoditizing: basic reactor configurations and standard monitoring systems.
- Margin Opportunities: custom reactor services, system integration, and incorporation into transmission workflows (installation protocols, performance monitoring).
| Stakeholder | What they actually control | Typical strengths | Typical blind spots |
|---|---|---|---|
| Global brands | Distribution reach, broad product catalogs, brand recognition | Wide availability, proven performance, multi-region support | Product refresh cycles; customer dependency on brand validation |
| Technology innovators | Reactor R&D; advanced insulation materials; enhanced performance properties | Latest technologies first; attractive ROI on performance effectiveness | Service density outside core regions; scaling complexity |
| Regional specialists | Local compliance, fast delivery, nearby customer support | "Close to customer" support; pragmatic pricing; local regulations | Technology gaps; talent retention in customer service |
| Full-service providers | Complete reactor programs, system integration, performance monitoring | Lowest operational risk; comprehensive support | Service costs if overpromised; technology obsolescence |
| Niche specialists | Specialized applications, custom configurations, technical services | Win premium applications; flexible configurations | Scalability limitations; narrow market focus |
Key Players in the Dry-type Air-core Smoothing Reactor Market
- Trench Group
- Hilkar
- Hada Electric
Scope of the Report
| Item | Value |
|---|---|
| Quantitative Units | USD 742.2 million |
| Phase Type | Single Phase, Three Phase |
| Application | HVDC Transmission, Renewable Energy Integration, Industrial Power Systems |
| End Use | Utility Operations, Industrial Facilities, Renewable Energy Developers |
| Regions Covered | North America, Latin America, Western Europe, Eastern Europe, Asia Pacific, South Asia, Middle East & Africa |
| Countries Covered | China, India, Germany, Brazil, United States, United Kingdom, Japan, Canada, France, Australia, and 25+ additional countries |
| Key Companies Profiled | Trench Group, Hilkar, Hada Electric, TEE, Miinen Electric, ABB Ltd, Siemens Energy |
| Additional Attributes | Dollar sales by phase type and application categories, regional adoption trends across Asia Pacific, Europe, and North America, competitive landscape with reactor manufacturers and system integrators, utility operator preferences for reactor effectiveness and performance control, integration with transmission platforms and monitoring systems, innovations in current harmonization technology and performance enhancement, and development of advanced reactor solutions with enhanced reliability and operational optimization capabilities. |
Dry-type Air-core Smoothing Reactor Market by Segments
Phase Type:
- Single Phase
- Three Phase
Application:
- HVDC Transmission
- Renewable Energy Integration
- Industrial Power Systems
End Use:
- Utility Operations
- Industrial Facilities
- Renewable Energy Developers
Voltage Rating:
- Medium Voltage (up to 35 kV)
- High Voltage (36-145 kV)
- Extra High Voltage (above 145 kV)
Region:
- North America
- United States
- Canada
- Mexico
- Latin America
- Brazil
- Chile
- Rest of Latin America
- Western Europe
- Germany
- United Kingdom
- France
- Italy
- Spain
- Nordic
- BENELUX
- Rest of Western Europe
- Eastern Europe
- Russia
- Poland
- Rest of Eastern Europe
- Asia Pacific
- China
- Japan
- South Korea
- India
- Australia & New Zealand
- ASEAN
- Rest of Asia Pacific
- South Asia
- India
- Rest of South Asia
- Middle East & Africa
- Kingdom of Saudi Arabia
- Other GCC Countries
- Turkey
- South Africa
- Other African Union
- Rest of Middle East & Africa
Frequently Asked Questions
How big is the dry-type air-core smoothing reactor market in 2025?
The global dry-type air-core smoothing reactor market is estimated to be valued at USD 742.2 million in 2025.
What will be the size of dry-type air-core smoothing reactor market in 2035?
The market size for the dry-type air-core smoothing reactor market is projected to reach USD 1,057.1 million by 2035.
How much will be the dry-type air-core smoothing reactor market growth between 2025 and 2035?
The dry-type air-core smoothing reactor market is expected to grow at a 3.6% CAGR between 2025 and 2035.
What are the key product types in the dry-type air-core smoothing reactor market?
The key product types in dry-type air-core smoothing reactor market are hvdc transmission , renewable energy integration and industrial power systems.
Which end-use segment to contribute significant share in the dry-type air-core smoothing reactor market in 2025?
In terms of end-use, utility operations segment to command 62.0% share in the dry-type air-core smoothing reactor market in 2025.
Table of Content
- Executive Summary
- Global Market Outlook
- Demand to side Trends
- Supply to side Trends
- Technology Roadmap Analysis
- Analysis and Recommendations
- Market Overview
- Market Coverage / Taxonomy
- Market Definition / Scope / Limitations
- Market Background
- Market Dynamics
- Drivers
- Restraints
- Opportunity
- Trends
- Scenario Forecast
- Demand in Optimistic Scenario
- Demand in Likely Scenario
- Demand in Conservative Scenario
- Opportunity Map Analysis
- Product Life Cycle Analysis
- Supply Chain Analysis
- Investment Feasibility Matrix
- Value Chain Analysis
- PESTLE and Porter’s Analysis
- Regulatory Landscape
- Regional Parent Market Outlook
- Production and Consumption Statistics
- Import and Export Statistics
- Market Dynamics
- Global Market Analysis 2020 to 2024 and Forecast, 2025 to 2035
- Historical Market Size Value (USD Million) Analysis, 2020 to 2024
- Current and Future Market Size Value (USD Million) Projections, 2025 to 2035
- Y to o to Y Growth Trend Analysis
- Absolute $ Opportunity Analysis
- Global Market Pricing Analysis 2020 to 2024 and Forecast 2025 to 2035
- Global Market Analysis 2020 to 2024 and Forecast 2025 to 2035, By Application
- Introduction / Key Findings
- Historical Market Size Value (USD Million) Analysis By Application , 2020 to 2024
- Current and Future Market Size Value (USD Million) Analysis and Forecast By Application , 2025 to 2035
- HVDC Transmission
- Renewable Energy Integration
- Industrial Power Systems
- Y to o to Y Growth Trend Analysis By Application , 2020 to 2024
- Absolute $ Opportunity Analysis By Application , 2025 to 2035
- Global Market Analysis 2020 to 2024 and Forecast 2025 to 2035, By End-Use
- Introduction / Key Findings
- Historical Market Size Value (USD Million) Analysis By End-Use, 2020 to 2024
- Current and Future Market Size Value (USD Million) Analysis and Forecast By End-Use, 2025 to 2035
- Utility Operations
- Industrial Facilities
- Renewable Energy Developers
- Y to o to Y Growth Trend Analysis By End-Use, 2020 to 2024
- Absolute $ Opportunity Analysis By End-Use, 2025 to 2035
- Global Market Analysis 2020 to 2024 and Forecast 2025 to 2035, By Region
- Introduction
- Historical Market Size Value (USD Million) Analysis By Region, 2020 to 2024
- Current Market Size Value (USD Million) Analysis and Forecast By Region, 2025 to 2035
- North America
- Latin America
- Western Europe
- Eastern Europe
- East Asia
- South Asia and Pacific
- Middle East & Africa
- Market Attractiveness Analysis By Region
- North America Market Analysis 2020 to 2024 and Forecast 2025 to 2035, By Country
- Historical Market Size Value (USD Million) Trend Analysis By Market Taxonomy, 2020 to 2024
- Market Size Value (USD Million) Forecast By Market Taxonomy, 2025 to 2035
- By Country
- USA
- Canada
- Mexico
- By Application
- By End-Use
- By Country
- Market Attractiveness Analysis
- By Country
- By Application
- By End-Use
- Key Takeaways
- Latin America Market Analysis 2020 to 2024 and Forecast 2025 to 2035, By Country
- Historical Market Size Value (USD Million) Trend Analysis By Market Taxonomy, 2020 to 2024
- Market Size Value (USD Million) Forecast By Market Taxonomy, 2025 to 2035
- By Country
- Brazil
- Chile
- Rest of Latin America
- By Application
- By End-Use
- By Country
- Market Attractiveness Analysis
- By Country
- By Application
- By End-Use
- Key Takeaways
- Western Europe Market Analysis 2020 to 2024 and Forecast 2025 to 2035, By Country
- Historical Market Size Value (USD Million) Trend Analysis By Market Taxonomy, 2020 to 2024
- Market Size Value (USD Million) Forecast By Market Taxonomy, 2025 to 2035
- By Country
- Germany
- UK
- Italy
- Spain
- France
- Nordic
- BENELUX
- Rest of Western Europe
- By Application
- By End-Use
- By Country
- Market Attractiveness Analysis
- By Country
- By Application
- By End-Use
- Key Takeaways
- Eastern Europe Market Analysis 2020 to 2024 and Forecast 2025 to 2035, By Country
- Historical Market Size Value (USD Million) Trend Analysis By Market Taxonomy, 2020 to 2024
- Market Size Value (USD Million) Forecast By Market Taxonomy, 2025 to 2035
- By Country
- Russia
- Poland
- Hungary
- Balkan & Baltic
- Rest of Eastern Europe
- By Application
- By End-Use
- By Country
- Market Attractiveness Analysis
- By Country
- By Application
- By End-Use
- Key Takeaways
- East Asia Market Analysis 2020 to 2024 and Forecast 2025 to 2035, By Country
- Historical Market Size Value (USD Million) Trend Analysis By Market Taxonomy, 2020 to 2024
- Market Size Value (USD Million) Forecast By Market Taxonomy, 2025 to 2035
- By Country
- China
- Japan
- South Korea
- By Application
- By End-Use
- By Country
- Market Attractiveness Analysis
- By Country
- By Application
- By End-Use
- Key Takeaways
- South Asia and Pacific Market Analysis 2020 to 2024 and Forecast 2025 to 2035, By Country
- Historical Market Size Value (USD Million) Trend Analysis By Market Taxonomy, 2020 to 2024
- Market Size Value (USD Million) Forecast By Market Taxonomy, 2025 to 2035
- By Country
- India
- ASEAN
- Australia & New Zealand
- Rest of South Asia and Pacific
- By Application
- By End-Use
- By Country
- Market Attractiveness Analysis
- By Country
- By Application
- By End-Use
- Key Takeaways
- Middle East & Africa Market Analysis 2020 to 2024 and Forecast 2025 to 2035, By Country
- Historical Market Size Value (USD Million) Trend Analysis By Market Taxonomy, 2020 to 2024
- Market Size Value (USD Million) Forecast By Market Taxonomy, 2025 to 2035
- By Country
- Kingdom of Saudi Arabia
- Other GCC Countries
- Turkiye
- South Africa
- Other African Union
- Rest of Middle East & Africa
- By Application
- By End-Use
- By Country
- Market Attractiveness Analysis
- By Country
- By Application
- By End-Use
- Key Takeaways
- Key Countries Market Analysis
- USA
- Pricing Analysis
- Market Share Analysis, 2024
- By Application
- By End-Use
- Canada
- Pricing Analysis
- Market Share Analysis, 2024
- By Application
- By End-Use
- Mexico
- Pricing Analysis
- Market Share Analysis, 2024
- By Application
- By End-Use
- Brazil
- Pricing Analysis
- Market Share Analysis, 2024
- By Application
- By End-Use
- Chile
- Pricing Analysis
- Market Share Analysis, 2024
- By Application
- By End-Use
- Germany
- Pricing Analysis
- Market Share Analysis, 2024
- By Application
- By End-Use
- UK
- Pricing Analysis
- Market Share Analysis, 2024
- By Application
- By End-Use
- Italy
- Pricing Analysis
- Market Share Analysis, 2024
- By Application
- By End-Use
- Spain
- Pricing Analysis
- Market Share Analysis, 2024
- By Application
- By End-Use
- France
- Pricing Analysis
- Market Share Analysis, 2024
- By Application
- By End-Use
- India
- Pricing Analysis
- Market Share Analysis, 2024
- By Application
- By End-Use
- ASEAN
- Pricing Analysis
- Market Share Analysis, 2024
- By Application
- By End-Use
- Australia & New Zealand
- Pricing Analysis
- Market Share Analysis, 2024
- By Application
- By End-Use
- China
- Pricing Analysis
- Market Share Analysis, 2024
- By Application
- By End-Use
- Japan
- Pricing Analysis
- Market Share Analysis, 2024
- By Application
- By End-Use
- South Korea
- Pricing Analysis
- Market Share Analysis, 2024
- By Application
- By End-Use
- Russia
- Pricing Analysis
- Market Share Analysis, 2024
- By Application
- By End-Use
- Poland
- Pricing Analysis
- Market Share Analysis, 2024
- By Application
- By End-Use
- Hungary
- Pricing Analysis
- Market Share Analysis, 2024
- By Application
- By End-Use
- Kingdom of Saudi Arabia
- Pricing Analysis
- Market Share Analysis, 2024
- By Application
- By End-Use
- Turkiye
- Pricing Analysis
- Market Share Analysis, 2024
- By Application
- By End-Use
- South Africa
- Pricing Analysis
- Market Share Analysis, 2024
- By Application
- By End-Use
- USA
- Market Structure Analysis
- Competition Dashboard
- Competition Benchmarking
- Market Share Analysis of Top Players
- By Regional
- By Application
- By End-Use
- Competition Analysis
- Competition Deep Dive
- Trench Group
- Overview
- Product Portfolio
- Profitability by Market Segments (Product/Age /Sales Channel/Region)
- Sales Footprint
- Strategy Overview
- Marketing Strategy
- Product Strategy
- Channel Strategy
- Hilkar
- Hada Electric
- TEE
- Miinen Electric
- ABB Ltd
- Siemens Energy
- General Electric
- Coil Innovation
- Hyosung Heavy Industries
- TBEA Co., Ltd.
- China XD Group
- Trench Group
- Competition Deep Dive
- Assumptions & Acronyms Used
- Research Methodology
List of Tables
- Table 1: Global Market Value (USD Million) Forecast by Region, 2020 to 2035
- Table 2: Global Market Value (USD Million) Forecast by Application , 2020 to 2035
- Table 3: Global Market Value (USD Million) Forecast by End-Use, 2020 to 2035
- Table 4: North America Market Value (USD Million) Forecast by Country, 2020 to 2035
- Table 5: North America Market Value (USD Million) Forecast by Application , 2020 to 2035
- Table 6: North America Market Value (USD Million) Forecast by End-Use, 2020 to 2035
- Table 7: Latin America Market Value (USD Million) Forecast by Country, 2020 to 2035
- Table 8: Latin America Market Value (USD Million) Forecast by Application , 2020 to 2035
- Table 9: Latin America Market Value (USD Million) Forecast by End-Use, 2020 to 2035
- Table 10: Western Europe Market Value (USD Million) Forecast by Country, 2020 to 2035
- Table 11: Western Europe Market Value (USD Million) Forecast by Application , 2020 to 2035
- Table 12: Western Europe Market Value (USD Million) Forecast by End-Use, 2020 to 2035
- Table 13: Eastern Europe Market Value (USD Million) Forecast by Country, 2020 to 2035
- Table 14: Eastern Europe Market Value (USD Million) Forecast by Application , 2020 to 2035
- Table 15: Eastern Europe Market Value (USD Million) Forecast by End-Use, 2020 to 2035
- Table 16: East Asia Market Value (USD Million) Forecast by Country, 2020 to 2035
- Table 17: East Asia Market Value (USD Million) Forecast by Application , 2020 to 2035
- Table 18: East Asia Market Value (USD Million) Forecast by End-Use, 2020 to 2035
- Table 19: South Asia and Pacific Market Value (USD Million) Forecast by Country, 2020 to 2035
- Table 20: South Asia and Pacific Market Value (USD Million) Forecast by Application , 2020 to 2035
- Table 21: South Asia and Pacific Market Value (USD Million) Forecast by End-Use, 2020 to 2035
- Table 22: Middle East & Africa Market Value (USD Million) Forecast by Country, 2020 to 2035
- Table 23: Middle East & Africa Market Value (USD Million) Forecast by Application , 2020 to 2035
- Table 24: Middle East & Africa Market Value (USD Million) Forecast by End-Use, 2020 to 2035
List of Figures
- Figure 1: Global Market Pricing Analysis
- Figure 2: Global Market Value (USD Million) Forecast 2020-2035
- Figure 3: Global Market Value Share and BPS Analysis by Application , 2025 and 2035
- Figure 4: Global Market Y to o to Y Growth Comparison by Application , 2025-2035
- Figure 5: Global Market Attractiveness Analysis by Application
- Figure 6: Global Market Value Share and BPS Analysis by End-Use, 2025 and 2035
- Figure 7: Global Market Y to o to Y Growth Comparison by End-Use, 2025-2035
- Figure 8: Global Market Attractiveness Analysis by End-Use
- Figure 9: Global Market Value (USD Million) Share and BPS Analysis by Region, 2025 and 2035
- Figure 10: Global Market Y to o to Y Growth Comparison by Region, 2025-2035
- Figure 11: Global Market Attractiveness Analysis by Region
- Figure 12: North America Market Incremental Dollar Opportunity, 2025-2035
- Figure 13: Latin America Market Incremental Dollar Opportunity, 2025-2035
- Figure 14: Western Europe Market Incremental Dollar Opportunity, 2025-2035
- Figure 15: Eastern Europe Market Incremental Dollar Opportunity, 2025-2035
- Figure 16: East Asia Market Incremental Dollar Opportunity, 2025-2035
- Figure 17: South Asia and Pacific Market Incremental Dollar Opportunity, 2025-2035
- Figure 18: Middle East & Africa Market Incremental Dollar Opportunity, 2025-2035
- Figure 19: North America Market Value Share and BPS Analysis by Country, 2025 and 2035
- Figure 20: North America Market Value Share and BPS Analysis by Application , 2025 and 2035
- Figure 21: North America Market Y to o to Y Growth Comparison by Application , 2025-2035
- Figure 22: North America Market Attractiveness Analysis by Application
- Figure 23: North America Market Value Share and BPS Analysis by End-Use, 2025 and 2035
- Figure 24: North America Market Y to o to Y Growth Comparison by End-Use, 2025-2035
- Figure 25: North America Market Attractiveness Analysis by End-Use
- Figure 26: Latin America Market Value Share and BPS Analysis by Country, 2025 and 2035
- Figure 27: Latin America Market Value Share and BPS Analysis by Application , 2025 and 2035
- Figure 28: Latin America Market Y to o to Y Growth Comparison by Application , 2025-2035
- Figure 29: Latin America Market Attractiveness Analysis by Application
- Figure 30: Latin America Market Value Share and BPS Analysis by End-Use, 2025 and 2035
- Figure 31: Latin America Market Y to o to Y Growth Comparison by End-Use, 2025-2035
- Figure 32: Latin America Market Attractiveness Analysis by End-Use
- Figure 33: Western Europe Market Value Share and BPS Analysis by Country, 2025 and 2035
- Figure 34: Western Europe Market Value Share and BPS Analysis by Application , 2025 and 2035
- Figure 35: Western Europe Market Y to o to Y Growth Comparison by Application , 2025-2035
- Figure 36: Western Europe Market Attractiveness Analysis by Application
- Figure 37: Western Europe Market Value Share and BPS Analysis by End-Use, 2025 and 2035
- Figure 38: Western Europe Market Y to o to Y Growth Comparison by End-Use, 2025-2035
- Figure 39: Western Europe Market Attractiveness Analysis by End-Use
- Figure 40: Eastern Europe Market Value Share and BPS Analysis by Country, 2025 and 2035
- Figure 41: Eastern Europe Market Value Share and BPS Analysis by Application , 2025 and 2035
- Figure 42: Eastern Europe Market Y to o to Y Growth Comparison by Application , 2025-2035
- Figure 43: Eastern Europe Market Attractiveness Analysis by Application
- Figure 44: Eastern Europe Market Value Share and BPS Analysis by End-Use, 2025 and 2035
- Figure 45: Eastern Europe Market Y to o to Y Growth Comparison by End-Use, 2025-2035
- Figure 46: Eastern Europe Market Attractiveness Analysis by End-Use
- Figure 47: East Asia Market Value Share and BPS Analysis by Country, 2025 and 2035
- Figure 48: East Asia Market Value Share and BPS Analysis by Application , 2025 and 2035
- Figure 49: East Asia Market Y to o to Y Growth Comparison by Application , 2025-2035
- Figure 50: East Asia Market Attractiveness Analysis by Application
- Figure 51: East Asia Market Value Share and BPS Analysis by End-Use, 2025 and 2035
- Figure 52: East Asia Market Y to o to Y Growth Comparison by End-Use, 2025-2035
- Figure 53: East Asia Market Attractiveness Analysis by End-Use
- Figure 54: South Asia and Pacific Market Value Share and BPS Analysis by Country, 2025 and 2035
- Figure 55: South Asia and Pacific Market Value Share and BPS Analysis by Application , 2025 and 2035
- Figure 56: South Asia and Pacific Market Y to o to Y Growth Comparison by Application , 2025-2035
- Figure 57: South Asia and Pacific Market Attractiveness Analysis by Application
- Figure 58: South Asia and Pacific Market Value Share and BPS Analysis by End-Use, 2025 and 2035
- Figure 59: South Asia and Pacific Market Y to o to Y Growth Comparison by End-Use, 2025-2035
- Figure 60: South Asia and Pacific Market Attractiveness Analysis by End-Use
- Figure 61: Middle East & Africa Market Value Share and BPS Analysis by Country, 2025 and 2035
- Figure 62: Middle East & Africa Market Value Share and BPS Analysis by Application , 2025 and 2035
- Figure 63: Middle East & Africa Market Y to o to Y Growth Comparison by Application , 2025-2035
- Figure 64: Middle East & Africa Market Attractiveness Analysis by Application
- Figure 65: Middle East & Africa Market Value Share and BPS Analysis by End-Use, 2025 and 2035
- Figure 66: Middle East & Africa Market Y to o to Y Growth Comparison by End-Use, 2025-2035
- Figure 67: Middle East & Africa Market Attractiveness Analysis by End-Use
- Figure 68: Global Market - Tier Structure Analysis
- Figure 69: Global Market - Company Share Analysis


