Ultra Clean Beverage Packaging Machine Market Size and Share Forecast Outlook 2025 to 2035

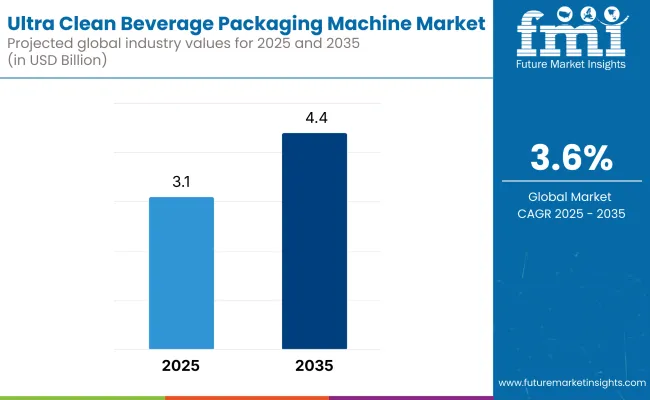
The ultra clean beverage packaging machine market is expected to grow from USD 3.1 billion in 2025 to USD 4.4 billion by 2035, resulting in a total increase of USD 1.3 billion over the forecast decade. This represents a 41.9% total expansion, with the market advancing at a compound annual growth rate (CAGR) of 3.6%. Over ten years, the market grows by a 1.4 multiple.
Quick Stats for Ultra Clean Beverage Packaging Machine Market

  • Market Value (2025): USD 3.1 billion
  • Market Forecast Value (2035): USD 4.4 billion
  • Market Forecast CAGR: 3.6%
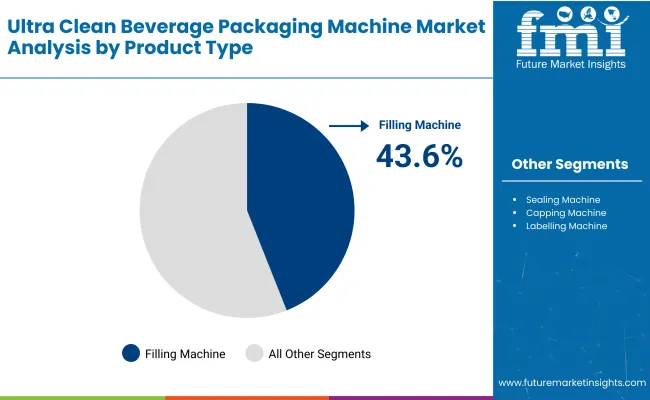
  • Leading Segment in 2025: filling machines (43.6%)
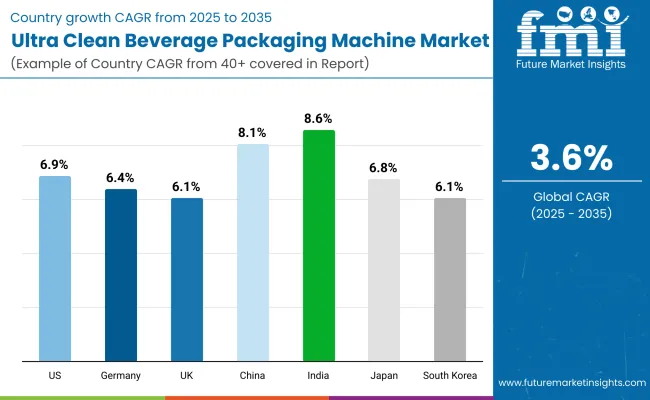
  • Key Growth Regions: Asia-Pacific (India is the fastest-growing market with 8.6% CAGR)
  • Top Key Players: Krones AG, KHS Group, Coesia S.p.A., SIG, IMA Group, Serac Group, SACMI GROUP, GEA Group, Elopak Group, and BW Packaging.

Ultra Clean Beverage Packaging Machines Market

Metric Value
Industry Size (2025E) USD 3.1 billion
Industry Value (2035F) USD 4.4 billion
CAGR (2025 to 2035) 3.6%

In the first five years (2025-2030), the market progresses from USD 3.1 billion to USD 3.7 billion, contributing USD 0.6 billion, or 46.2% of total decade growth. This phase is shaped by increasing adoption in dairy, juice, and plant-based beverage sectors, driven by the need for extended shelf life without chemical preservatives. The market benefits from demand for aseptic and hygiene-intensive filling lines, particularly in Europe and Japan, where regulatory stringency is highest.

In the second half (2030-2035), the market grows from USD 3.7 billion to USD 4.4 billion, adding USD 0.7 billion, or 53.8% of the total growth. This acceleration is supported by smart factory integration, including automated CIP/SIP systems, HEPA-filtered enclosures, and IoT-enabled diagnostics. The rise of RTD functional beverages and probiotic drinks amplifies the need for ultra-clean sealing and contamination-free filling, making this segment central to premium beverage packaging innovation.

From 2020 to 2024, the ultra clean beverage packaging machine market grew from USD 2.6 billion to USD 2.9 billion, driven by hardware-centric adoption across dairy, juice, and functional beverage segments where extended shelf life and aseptic processing are critical. During this period, the competitive landscape was dominated by OEM manufacturers controlling nearly 70% of total revenue, with leaders such as Krones AG, KHS Group, Coesia S.p.A., and SIG focusing on high-speed, ultra-hygienic systems integrated with cleanroom standards and validated sterilization modules.

Competitive differentiation relied on microbiological safety assurance, CIP/SIP automation, and high throughput rates, while data-driven features were bundled as secondary add-ons rather than standalone revenue streams. Service-based models including sterilization audits and process recalibration accounted for less than 10% of the total market value during this time, with most beverage producers opting for capital investment over OPEX-driven models.

Demand for ultra clean beverage packaging machines will expand to USD 4.4 billion in 2035, and the revenue mix will shift as software analytics, condition-based maintenance, and sterile packaging-as-a-service offerings grow to over 40% share. Traditional machine manufacturers face rising competition from integrated solution providers offering remote sanitation monitoring, cleanroom-ready predictive diagnostics, and AI-enabled fill integrity validation.

Major players are pivoting to hybrid models by embedding advanced sterilization mapping, digital twin platforms, and IoT-enabled production traceability. Emerging entrants such as IMA Group, Serac Group, SACMI GROUP, GEA Group, Elopak Group, and BW Packaging are gaining share by specializing in multi-material compatibility, modular aseptic configurations, and sustainability-aligned hygienic packaging solutions.

Why the Ultra Clean Beverage Packaging Machine Market is growing?

The increasing demand for extended shelf life, preservative-free beverages, and aseptic processing is driving the growth of the ultra clean beverage packaging machine market. These machines ensure high levels of hygiene and microbial control during filling and sealing, making them ideal for juices, dairy alternatives, low-acid beverages, and functional drinks. Regulatory shifts toward food safety compliance and consumer preferences for minimally processed beverages are further accelerating adoption.

Machines integrated with sterilization modules, HEPA filtration, and cleanroom-compatible filling zones have gained popularity due to their ability to achieve up to log-4 microbial reduction without using harsh chemicals. Their compact footprint, fast changeover capabilities, and compatibility with lightweight bottles and caps also appeal to sustainable packaging initiatives in the beverage industry.

Segmental Analysis

The market is segmented by machine, packaging type, beverage type, capacity, and region. Machine segmentation includes filling machines, sealing machines, capping machines, labelling machines, inspection & quality control machines, and complete packaging lines each supporting different stages of ultra-clean packaging workflows for liquid beverages.

Packaging type covers bottles (PET bottles, glass bottles, HDPE bottles), cans (aluminium, steel), cartons (paper-based aseptic, non-aseptic), pouches (single-layer plastic pouches, multi-layered laminated pouches), and bag-in-box packaging (plastic-based and aluminium-lined), offering sterile and efficient formats for a wide range of beverage categories.

Beverage type includes dairy-based beverages (milk, flavoured milk, drinkable yogurt, lactose-free options), juices & nectars (fresh, pasteurized & aseptic, concentrated), plant-based beverages (almond, soy, oat, coconut, rice milk), functional & nutritional beverages (protein shakes, meal replacement drinks, probiotic & fermented drinks), carbonated soft drinks (flavoured sodas, energy drinks, sports drinks), and bottled water (still, sparkling, flavoured), addressing growing demand for hygienic, preservative-free, and functional drink options.

Capacity segmentation includes up to 5,000 bottles per hour (BPH), 5,000-10,000 BPH, 10,000-20,000 BPH, and above 20,000 BPH, reflecting machine scalability based on production volume and throughput needs. Regionally, the market is segmented into North America, Europe, Asia-Pacific, Latin America, and the Middle East & Africa.
Filling Machines to Lead as Automation Gains Central Role in Ultra Clean Beverage Packaging

Ultra Clean Beverage Packaging Machines Market By Product

The filling machines segment is forecast to dominate the market with a 43.6% share in 2025, driven by the increasing demand for high-speed, contamination-free liquid transfer systems. These machines form the core of ultra clean packaging lines as they integrate advanced aseptic technologies, HEPA-filtered environments, and CIP/SIP (Clean-in-Place/Sterilize-in-Place) capabilities, which reduce microbial risks during bottling operations.

The rise of functional beverages, probiotics, and dairy-based drinks with limited shelf life has heightened the need for ultra-hygienic conditions during the filling phase.
Dairy-Based Beverages Dominate Due to Stringent Safety Needs and High Spoilage Risk

Ultra Clean Beverage Packaging Machines Market By End Use

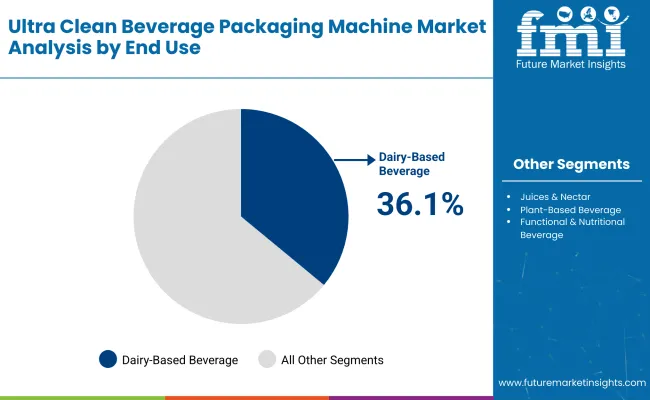
Dairy-based beverages are projected to account for a 36.1% share of the market in 2025, as they require sterile packaging processes to ensure product stability, nutritional preservation, and extended shelf life. This category includes milk, flavored milk, yogurt drinks, protein shakes, and other perishable products that are highly susceptible to bacterial contamination and oxidation.

Ultra clean packaging systems cater to these needs by incorporating hermetic sealing, contactless filling, and container sterilization techniques.

Bottles to Remain Preferred Packaging Type Amid Branding and Recyclability Benefits

Bottles are expected to lead the market by packaging type with a 44.5% share in 2025, owing to their widespread consumer familiarity, reusability, and visual shelf appeal. In ultra clean packaging lines, bottles are preferred for their ability to withstand sterilization processes such as hydrogen peroxide vapor, UV irradiation, and hot air treatment. This makes them ideal for maintaining aseptic conditions during dairy, juice, and nutraceutical beverage packaging.

Bottles also provide greater flexibility for labeling, portion sizing, and on-the-go consumption.

10,000-20,000 BPH Capacity Segment Grows with Mid-Scale, High-Speed Production Demand

Packaging machines with 10,000-20,000 bottles per hour (BPH) capacity are forecast to hold a 42.5% market share in 2025, making them the preferred choice for mid-to-large scale beverage producers seeking optimal throughput and efficiency. This capacity range offers a balance between cost-efficiency and production flexibility, especially in plants handling multiple SKUs, seasonal volumes, or short-run premium beverages.

With evolving consumer preferences, brands are increasingly launching new beverage variants in diverse bottle formats, requiring packaging systems that offer rapid changeovers and minimal downtime.

What are the Drivers, Restraints, and Key Trends of the Ultra Clean Beverage Packaging Machine Market?

Operational complexity and high capital requirements hinder widespread adoption, even as demand rises across dairy, functional beverages, and plant-based drinks for ultra-hygienic, low-contamination packaging systems that extend shelf life without preservatives or cold chain dependence.

Stringent Hygiene Requirements and Shelf-life Optimization Driving Adoption

Ultra clean beverage packaging machines are gaining traction in sectors where product sterility, freshness, and extended shelf stability are critical. Dairy-based beverages, functional drinks with probiotics, and ready-to-drink (RTD) plant-based formulations often require sterile or near-aseptic filling to avoid spoilage. Ultra clean systems offer a cost-effective alternative to full aseptic processing, combining HEPA filtration, sterile zones, and contactless filling to reduce microbial load while preserving product integrity.

These systems are ideal for small to mid-sized manufacturers seeking balance between hygiene compliance and operational efficiency. As clean-label trends accelerate and refrigeration-independent distribution becomes more viable, ultra clean machines provide the required packaging precision without the complexity of full aseptic infrastructure.

Capital Investment, Format Limitations, and Line Integration Challenges

Despite strong market interest, ultra clean beverage packaging machines face adoption barriers due to their high upfront cost and system sophistication. The equipment requires specialized clean-room integration, air filtration systems, and frequent sterilization cycles raising both capital and operational expenses. Additionally, compatibility across varying bottle shapes, caps, and closure systems is often restricted by the clean zone’s configuration.

Integrating these machines into existing filling lines may require major retrofits or infrastructure upgrades. Moreover, training staff for proper sanitation protocols and maintaining microbiological validation records adds further compliance pressure, particularly in export-oriented facilities. These factors slow adoption, especially among small bottlers or companies operating in highly fragmented markets.

Compact Modular Systems and Energy-efficient Cleanroom Technologies Emerging

A major trend in this market is the development of compact, modular ultra clean systems that combine flexible layout design with high-speed functionality. Equipment manufacturers are incorporating servo-driven actuators, CIP/SIP automation, and adaptive cleanroom zoning that minimizes air and energy consumption without compromising sterility. Integrated diagnostics and real-time microbial sensors are being introduced to monitor critical control points, reducing manual intervention and validation cycles.

Additionally, the rise of plant-based and additive-free beverages is pushing packaging innovation toward transparent bottles and lightweight containers that demand delicate, hygienic handling. These trends are transforming ultra clean packaging from a niche compliance solution into a core technology driving beverage innovation, export readiness, and sustainability-aligned operations.
Analysis of Ultra Clean Beverage Packaging Machine Market by Key Countries

Ultra Clean Beverage Packaging Machines Market By Country

The global ultra clean beverage packaging machine market is expanding steadily, driven by stringent hygiene regulations, the rise in ready-to-drink (RTD) beverages, and extended shelf-life demands. Asia-Pacific is emerging as a lucrative region, with India and China leading growth due to increasing investments in food safety infrastructure and automation. Developed markets like the USA, Germany, and Japan continue to innovate in aseptic filling and high-speed packaging systems, integrating cleanroom technology with robotic modules to meet FDA, EU, and ISO standards.

Sales Outlook for Ultra Clean Beverage Packaging Machines United States

The USA market is projected to grow at a CAGR of 6.9% from 2025 to 2035. Growth is driven by increasing demand for sterile filling systems in dairy, plant-based beverages, and functional drinks. Equipment manufacturers are introducing fully enclosed, CIP/SIP-compliant machines to meet FDA safety benchmarks. High demand from premium beverage brands is pushing the development of robotic arms and real-time monitoring systems integrated into packaging lines.

  • Bottlers adopt aseptic packaging lines for cold-pressed and dairy-free beverages.
  • Brewery and kombucha makers invest in ultra clean systems to reduce contamination risks.
  • OEMs develop AI-integrated packaging machines with smart diagnostics and traceability features.

Growth Outlook for Ultra Clean Beverage Packaging Machines Germany

Germany’s market is expected to grow at a CAGR of 6.4%, anchored by its advanced beverage manufacturing ecosystem. Demand for hygienic, enclosed packaging lines is rising in response to stricter EU regulations on microbial safety and food contact materials. German engineering firms are developing modular ultra clean systems tailored for juice, probiotic drinks, and non-alcoholic segments.

  • Juice and probiotic manufacturers require high-pressure, sterile filling systems.
  • EU mandates drive adoption of integrated HEPA filters and UV sterilization in packaging lines.
  • OEMs offer predictive maintenance via cloud-connected packaging lines.

Expansion Outlook for Ultra Clean Beverage Packaging Machines United Kingdom

The UK market is projected to expand at a CAGR of 6.1%, supported by rising premiumization of non-alcoholic beverages and ready-to-drink health drinks. Smaller manufacturers are adopting pre-assembled clean filling units to comply with FSMA and allergen control standards. Startups in functional beverages are driving demand for versatile, compact, and rapid-clean packaging machines.

  • Functional beverage startups use modular filling machines to maintain product integrity.
  • Cold-fill operations integrate ultra clean tech to avoid preservatives and additives.
  • Automation and traceability systems are bundled for GMP-certified facilities.

Sales Outlook for Ultra Clean Beverage Packaging Machines China

China is forecast to witness strong growth at a CAGR of 8.1%, driven by government-led food safety initiatives and expansion of the domestic health drink industry. OEMs are localizing ultra clean technologies with HEPA filtration, UV tunnels, and steam sterilization modules. Growth in cold-chain logistics further enables adoption of sterile filling lines across inland beverage manufacturing hubs.

  • Domestic producers adopt inline sterilization systems for herbal teas and energy drinks.
  • Government incentives promote clean technology in high-volume bottling plants.
  • OEMs offer locally assembled machines with modular sanitization features.

Growth Outlook for Ultra Clean Beverage Packaging Machines India

India is the fastest-growing market with a projected CAGR of 8.6%, underpinned by rapid expansion in health-based beverages, dairy, and probiotic drinks. Demand for packaging solutions with low microbial load is increasing due to rising export of ready-to-drink products. Small and medium manufacturers are shifting to closed aseptic systems to meet FSSAI and export standards.

  • Health drink startups integrate clean filling lines to meet extended shelf life demands.
  • Export-focused dairy processors invest in ultra clean solutions for compliance.
  • Automated dosing, filling, and capping machines dominate mid-scale plant installations.

Growth Outlook for Ultra Clean Beverage Packaging Machines Japan

Japan is projected to grow at a CAGR of 6.8%, with beverage manufacturers focusing on ultra clean packaging for nutraceuticals, enzyme drinks, and fermented beverages. Aging population demands sterile, low-acid beverage formats, driving investment in precision filling and HEPA-sealed systems. Innovation in packaging for personalized nutrition and functional wellness drinks supports sustained growth.

  • Nutraceutical bottlers use ultra clean packaging to ensure active ingredient stability.
  • RTD fermented drinks leverage aseptic and UV-based filling modules.
  • OEMs integrate vision inspection with precision clean filling nozzles.

Expansion Outlook for Ultra Clean Beverage Packaging Machines South Korea

South Korea’s market is expected to grow at a CAGR of 6.1%, led by demand in wellness drinks, ginseng-based beverages, and export-grade RTD teas. Ultra clean packaging ensures low bioburden, flavor integrity, and longer shelf stability. Korean manufacturers are combining packaging machines with smart control systems and cleanroom-grade filling lines.

  • Ginseng beverage makers install high-efficiency sterile lines for preservation.
  • Exporters of K-functional drinks demand ultra clean equipment for compliance.
  • OEMs supply compact clean modules with auto-adjusting sanitization cycles.

Competitive Landscape of Ultra Clean Beverage Packaging Machine Market

The ultra clean beverage packaging machine market is moderately fragmented, with global packaging system integrators, aseptic line specialists, and modular machine builders competing across dairy, juice, plant-based, and functional beverage applications.

Global leaders such as Krones AG, SIG, and KHS Group hold significant market share, driven by advanced aseptic filling technologies, HEPA-filtered environments, and packaging integrity systems that meet ISO 22000 and EHEDG hygiene standards. Their strategies increasingly emphasize high-speed performance, integrated CIP/SIP automation, and format-flexibility across PET, carton, and pouch platforms.

Established mid-sized players including IMA Group, Serac Group, and Coesia S.p.A. are supporting adoption of modular ultra clean lines featuring servo-driven capping, H2O2-based sterilization, and contactless filling nozzles. These companies are especially active in premium dairy, probiotic drinks, and meal replacement packaging, offering inline testing systems, laminar airflow units, and compatibility with low-acid beverages.

Specialized equipment providers such as SACMI GROUP, GEA Group, Elopak Group, and BW Packaging focus on tailored solutions for regional bottlers and mid-cap producers. Their strengths lie in modular customization, energy-efficient sterilization units, and integration with secondary packaging and robotics systems for tray packing and end-of-line automation.

Key Development of Ultra Clean Beverage Packaging Machine Market

  • November 27, 2024, In order to meet the growing demands of the beverage industry, KHS is continuously further modernizing its service solutions. The latest option addresses the challenges of filling thin-walled cans and maintains a high level of efficiency in line and machine operation.
  • 28 May 2024, Serac extends its range of services to packaging design, Serac has created 4 unique bottles featuring four different facial expressions allowing children to express their mood in the most delightful way. Serac thus offers dairy brands a unique packaging solution that stands out on supermarket shelves.

Key Companies

  • Krones AG
  • KHS Group
  • Coesia S.p.A.
  • SIG
  • IMA Group
  • Serac Group
  • SACMI GROUP
  • GEA Group
  • Elopak Group
  • BW Packaging

Scope of the Report

Item Value
Quantitative Units USD 3.1 Billion
By Machine Filling Machines, Sealing Machines, Capping Machines, Labelling Machines, Inspection & Quality Control Machines, and Complete Packaging Line
By Packaging Type Bottles (PET Bottles, Glass Bottles, HDPE Bottles), Cans (Aluminium, Steel), Cartons (Paper-Based Aseptic, Non-aseptic), Pouches (Single-layer Plastic Pouches, Multi-Layered Laminated Pouches), and Bag-in-Box Packaging (Plastic-Based Bag-in-Box, Aluminium -Lined Bag-in-Box)
By Beverage Type Dairy-Based Beverages (Milk, Flavoured Milk, Drinkable Yogurt, Lactose-Free Dairy Beverages), Juices & Nectars (Fresh Juices, Pasteurized & Aseptic Juices, Concentrated Juices), Plant-Based Beverages (Almond Milk, Soy Milk, Oat Milk, Coconut Milk, Rice Milk), Functional & Nutritional Beverages (Protein Shakes, Meal Replacement Drinks, Probiotic & Fermented Beverages), Carbonated Soft Drinks (CSDs) (Flavoured Sodas, Energy Drinks, Sports Drinks), and Bottled Water (Still Water, Sparkling Water, Flavoured Water)
By Capacity Up to 5,000 Bottles per Hour (BPH), 5,000-10,000 BPH, 10,000-20,000 BPH, and Above 20,000 BPH
Key Companies Profiled Krones AG, KHS Group, Coesia S.p.A., SIG, IMA Group, Serac Group, SACMI GROUP, GEA Group, Elopak Group, and BW Packaging
Additional Attributes Surge in demand for hygienic filling technologies in sensitive beverages, integration of inline quality inspection for aseptic assurance, use of HEPA filtration and UV sterilization systems in dairy packaging, widespread adoption of PET and multi-layer pouch formats in juice and functional drinks, growing demand for small-batch and lactose-free line configurations, automation in high-speed packaging lines for bottled water and CSDs, increasing use of modular systems for flexible format changes, rapid adoption in emerging markets for probiotic and oat-based beverages, expansion of cleanroom-compatible filling systems, and focus on sustainability via lightweight PET and aseptic carton technology

Key Segments

By Machine:

  • Filling Machines
  • Sealing Machines
  • Capping Machines
  • Labelling Machines
  • Inspection & Quality Control Machines
  • Complete Packaging Line

By Packaging Type:

  • Bottles
  • PET Bottles
  • Glass Bottles
  • HDPE Bottles
  • Cans
  • Aluminium
  • Steel
  • Cartons
  • Paper-Based Aseptic
  • Non-aseptic
  • Pouches
  • Single-layer Plastic Pouches
  • Multi-Layered Laminated Pouches
  • Bag-in-Box Packaging
  • Plastic-Based Bag-in-Box
  • Aluminium-Lined Bag-in-Box

By Beverage Type:

  • Dairy-Based Beverages
  • Milk
  • Flavoured Milk
  • Drinkable Yogurt
  • Lactose-Free Dairy Beverages
  • Juices & Nectars
  • Fresh Juices
  • Pasteurized & Aseptic Juices
  • Concentrated Juices
  • Plant-Based Beverages
  • Almond Milk
  • Soy Milk
  • Oat Milk
  • Coconut Milk
  • Rice Milk
  • Functional & Nutritional Beverages
  • Protein Shakes
  • Meal Replacement Drinks
  • Probiotic & Fermented Beverages
  • Carbonated Soft Drinks (CSDs)
  • Flavoured Sodas
  • Energy Drinks
  • Sports Drinks
  • Bottled Water
  • Still Water
  • Sparkling Water
  • Flavoured Water

By Capacity:

  • Up to 5,000 Bottles per Hour (BPH)
  • 5,000-10,000 BPH
  • 10,000-20,000 BPH
  • Above 20,000 BPH

By Region:

  • North America
  • Europe
  • Asia-Pacific
  • Latin America
  • Middle East & Africa

Table of Content

  1. Executive Summary
    • Global Market Outlook
    • Demand-side Trends
    • Supply-side Trends
    • Technology Roadmap Analysis
    • Analysis and Recommendations
  2. Market Overview
    • Market Coverage / Taxonomy
    • Market Definition / Scope / Limitations
  3. Market Background
    • Market Dynamics
      • Drivers
      • Restraints
      • Opportunity
      • Trends
    • Scenario Forecast
      • Demand in Optimistic Scenario
      • Demand in Likely Scenario
      • Demand in Conservative Scenario
    • Opportunity Map Analysis
    • Product Life Cycle Analysis
    • Supply Chain Analysis
      • Supply Side Participants and their Roles
        • Producers
        • Mid-Level Participants (Traders/ Agents/ Brokers)
        • Wholesalers and Distributors
      • Value Added and Value Created at Node in the Supply Chain
      • List of Raw Material Suppliers
      • List of Existing and Potential Buyer’s
    • Investment Feasibility Matrix
    • Value Chain Analysis
      • Profit Margin Analysis
      • Wholesalers and Distributors
      • Retailers
    • PESTLE and Porter’s Analysis
    • Regulatory Landscape
      • By Key Regions
      • By Key Countries
    • Regional Parent Market Outlook
    • Production and Consumption Statistics
    • Import and Export Statistics
  4. Global Market Analysis 2020 to 2024 and Forecast, 2025 to 2035
    • Historical Market Size Value (USD Million) & Volume (Units) Analysis, 2020 to 2024
    • Current and Future Market Size Value (USD Million) & Volume (Units) Projections, 2025 to 2035
      • Y-o-Y Growth Trend Analysis
      • Absolute $ Opportunity Analysis
  5. Global Market Pricing Analysis 2020 to 2024 and Forecast 2025 to 2035
  6. Global Market Analysis 2020 to 2024 and Forecast 2025 to 2035, By Machine
    • Introduction / Key Findings
    • Historical Market Size Value (USD Million) & Volume (Units) Analysis By Machine, 2020 to 2024
    • Current and Future Market Size Value (USD Million) & Volume (Units) Analysis and Forecast By Machine, 2025 to 2035
      • Filling Machines
      • Sealing Machines
      • Capping Machines
      • Labelling Machines
      • Inspection & Quality Control Machines
      • Complete Packaging Line
    • Y-o-Y Growth Trend Analysis By Machine, 2020 to 2024
    • Absolute $ Opportunity Analysis By Machine, 2025 to 2035
  7. Global Market Analysis 2020 to 2024 and Forecast 2025 to 2035, By Packaging Type
    • Introduction / Key Findings
    • Historical Market Size Value (USD Million) & Volume (Units) Analysis By Packaging Type, 2020 to 2024
    • Current and Future Market Size Value (USD Million) & Volume (Units) Analysis and Forecast By Packaging Type, 2025 to 2035
      • Bottles
        • PET Bottles
        • Glass Bottles
        • HDPE Bottles
      • Cans
        • Aluminium
        • Steel
      • Cartons
        • Paper-Based Aseptic
        • Non-aseptic
      • Pouches
        • Single-layer Plastic Pouches
        • Multi-Layered Laminated Pouches
      • Bag-in-Box Packaging
        • Plastic-Based Bag-in-Box
        • Aluminium-Lined Bag-in-Box
    • Y-o-Y Growth Trend Analysis By Packaging Type, 2020 to 2024
    • Absolute $ Opportunity Analysis By Packaging Type, 2025 to 2035
  8. Global Market Analysis 2020 to 2024 and Forecast 2025 to 2035, By Beverage Type
    • Introduction / Key Findings
    • Historical Market Size Value (USD Million) & Volume (Units) Analysis By Beverage Type, 2020 to 2024
    • Current and Future Market Size Value (USD Million) & Volume (Units) Analysis and Forecast By Beverage Type, 2025 to 2035
      • Dairy-Based Beverages
        • Milk
        • Flavoured Milk
        • Drinkable Yogurt
        • Lactose-Free Dairy Beverages
      • Juices & Nectars
        • Fresh Juices
        • Pasteurized & Aseptic Juices
        • Concentrated Juices
      • Plant-Based Beverages
        • Almond Milk
        • Soy Milk
        • Oat Milk
        • Coconut Milk
        • Rice Milk
      • Functional & Nutritional Beverages
        • Protein Shakes
        • Meal Replacement Drinks
        • Probiotic & Fermented Beverages
      • Carbonated Soft Drinks (CSDs)
        • Flavoured Sodas
        • Energy Drinks
        • Sports Drinks
        • Bottled Water
      • Still Water
        • Sparkling Water
        • Flavoured Water
    • Y-o-Y Growth Trend Analysis By Beverage Type, 2020 to 2024
    • Absolute $ Opportunity Analysis By Beverage Type, 2025 to 2035
  9. Global Market Analysis 2020 to 2024 and Forecast 2025 to 2035, By Capacity
    • Introduction / Key Findings
    • Historical Market Size Value (USD Million) & Volume (Units) Analysis By Capacity, 2020 to 2024
    • Current and Future Market Size Value (USD Million) & Volume (Units) Analysis and Forecast By Capacity, 2025 to 2035
      • Up to 5,000 Bottles per Hour (BPH)
      • 5,000-10,000 BPH
      • 10,000-20,000 BPH
      • Above 20,000 BPH
    • Y-o-Y Growth Trend Analysis By Capacity, 2020 to 2024
    • Absolute $ Opportunity Analysis By Capacity, 2025 to 2035
  10. Global Market Analysis 2020 to 2024 and Forecast 2025 to 2035, By Region
    • Introduction
    • Historical Market Size Value (USD Million) & Volume (Units) Analysis By Region, 2020 to 2024
    • Current Market Size Value (USD Million) & Volume (Units) Analysis and Forecast By Region, 2025 to 2035
      • North America
      • Latin America
      • Europe
      • East Asia
      • South Asia
      • Oceania
      • MEA
    • Market Attractiveness Analysis By Region
  11. North America Market Analysis 2020 to 2024 and Forecast 2025 to 2035, By Country
    • Historical Market Size Value (USD Million) & Volume (Units) Trend Analysis By Market Taxonomy, 2020 to 2024
    • Market Size Value (USD Million) & Volume (Units) Forecast By Market Taxonomy, 2025 to 2035
      • By Country
        • USA
        • Canada
      • By Machine
      • By Packaging Type
      • By Beverage Type
      • By Capacity
    • Market Attractiveness Analysis
      • By Country
      • By Machine
      • By Packaging Type
      • By Beverage Type
      • By Capacity
    • Key Takeaways
  12. Latin America Market Analysis 2020 to 2024 and Forecast 2025 to 2035, By Country
    • Historical Market Size Value (USD Million) & Volume (Units) Trend Analysis By Market Taxonomy, 2020 to 2024
    • Market Size Value (USD Million) & Volume (Units) Forecast By Market Taxonomy, 2025 to 2035
      • By Country
        • Brazil
        • Mexico
        • Argentina
        • Chile
        • Peru
        • Rest of Latin America
      • By Machine
      • By Packaging Type
      • By Beverage Type
      • By Capacity
    • Market Attractiveness Analysis
      • By Country
      • By Machine
      • By Packaging Type
      • By Beverage Type
      • By Capacity
    • Key Takeaways
  13. Europe Market Analysis 2020 to 2024 and Forecast 2025 to 2035, By Country
    • Historical Market Size Value (USD Million) & Volume (Units) Trend Analysis By Market Taxonomy, 2020 to 2024
    • Market Size Value (USD Million) & Volume (Units) Forecast By Market Taxonomy, 2025 to 2035
      • By Country
        • Germany
        • Italy
        • France
        • UK
        • Spain
        • Russia
        • BENELUX
        • Rest of Europe
      • By Machine
      • By Packaging Type
      • By Beverage Type
      • By Capacity
    • Market Attractiveness Analysis
      • By Country
      • By Machine
      • By Packaging Type
      • By Beverage Type
      • By Capacity
    • Key Takeaways
  14. East Asia Market Analysis 2020 to 2024 and Forecast 2025 to 2035, By Country
    • Historical Market Size Value (USD Million) & Volume (Units) Trend Analysis By Market Taxonomy, 2020 to 2024
    • Market Size Value (USD Million) & Volume (Units) Forecast By Market Taxonomy, 2025 to 2035
      • By Country
        • China
        • Japan
        • South Korea
      • By Machine
      • By Packaging Type
      • By Beverage Type
      • By Capacity
    • Market Attractiveness Analysis
      • By Country
      • By Machine
      • By Packaging Type
      • By Beverage Type
      • By Capacity
    • Key Takeaways
  15. South Asia Market Analysis 2020 to 2024 and Forecast 2025 to 2035, By Country
    • Historical Market Size Value (USD Million) & Volume (Units) Trend Analysis By Market Taxonomy, 2020 to 2024
    • Market Size Value (USD Million) & Volume (Units) Forecast By Market Taxonomy, 2025 to 2035
      • By Country
        • India
        • Thailand
        • Malaysia
        • Indonesia
        • Rest of South Asia
      • By Machine
      • By Packaging Type
      • By Beverage Type
      • By Capacity
    • Market Attractiveness Analysis
      • By Country
      • By Machine
      • By Packaging Type
      • By Beverage Type
      • By Capacity
    • Key Takeaways
  16. Oceania Market Analysis 2020 to 2024 and Forecast 2025 to 2035, By Country
    • Historical Market Size Value (USD Million) & Volume (Units) Trend Analysis By Market Taxonomy, 2020 to 2024
    • Market Size Value (USD Million) & Volume (Units) Forecast By Market Taxonomy, 2025 to 2035
      • By Country
        • Australia
        • New Zealand
      • By Machine
      • By Packaging Type
      • By Beverage Type
      • By Capacity
    • Market Attractiveness Analysis
      • By Country
      • By Machine
      • By Packaging Type
      • By Beverage Type
      • By Capacity
    • Key Takeaways
  17. MEA Market Analysis 2020 to 2024 and Forecast 2025 to 2035, By Country
    • Historical Market Size Value (USD Million) & Volume (Units) Trend Analysis By Market Taxonomy, 2020 to 2024
    • Market Size Value (USD Million) & Volume (Units) Forecast By Market Taxonomy, 2025 to 2035
      • By Country
        • GCC
        • Rest of MEA
      • By Machine
      • By Packaging Type
      • By Beverage Type
      • By Capacity
    • Market Attractiveness Analysis
      • By Country
      • By Machine
      • By Packaging Type
      • By Beverage Type
      • By Capacity
    • Key Takeaways
  18. Key Countries Market Analysis
    • USA
      • Pricing Analysis
      • Market Share Analysis, 2024
        • By Machine
        • By Packaging Type
        • By Beverage Type
        • By Capacity
    • Canada
      • Pricing Analysis
      • Market Share Analysis, 2024
        • By Machine
        • By Packaging Type
        • By Beverage Type
        • By Capacity
    • Brazil
      • Pricing Analysis
      • Market Share Analysis, 2024
        • By Machine
        • By Packaging Type
        • By Beverage Type
        • By Capacity
    • Mexico
      • Pricing Analysis
      • Market Share Analysis, 2024
        • By Machine
        • By Packaging Type
        • By Beverage Type
        • By Capacity
    • Argentina
      • Pricing Analysis
      • Market Share Analysis, 2024
        • By Machine
        • By Packaging Type
        • By Beverage Type
        • By Capacity
  19. Market Structure Analysis
    • Competition Dashboard
    • Competition Benchmarking
    • Market Share Analysis of Top Players
      • By Regional
      • By Machine
      • By Packaging Type
      • By Beverage Type
      • By Capacity
  20. Competition Analysis
    • Competition Deep Dive
      • Krones AG
        • Overview
        • Product Portfolio
        • Profitability by Market Segments (Product/Age /Sales Channel/Region)
        • Sales Footprint
        • Strategy Overview
          • Marketing Strategy
          • Product Strategy
          • Channel Strategy
      • KHS Group
        • Overview
        • Product Portfolio
        • Profitability by Market Segments (Product/Age /Sales Channel/Region)
        • Sales Footprint
        • Strategy Overview
          • Marketing Strategy
          • Product Strategy
          • Channel Strategy
      • Coesia S.p.A.
        • Overview
        • Product Portfolio
        • Profitability by Market Segments (Product/Age /Sales Channel/Region)
        • Sales Footprint
        • Strategy Overview
          • Marketing Strategy
          • Product Strategy
          • Channel Strategy
      • SIG
        • Overview
        • Product Portfolio
        • Profitability by Market Segments (Product/Age /Sales Channel/Region)
        • Sales Footprint
        • Strategy Overview
          • Marketing Strategy
          • Product Strategy
          • Channel Strategy
      • IMA Group
        • Overview
        • Product Portfolio
        • Profitability by Market Segments (Product/Age /Sales Channel/Region)
        • Sales Footprint
        • Strategy Overview
          • Marketing Strategy
          • Product Strategy
          • Channel Strategy
      • Serac Group
        • Overview
        • Product Portfolio
        • Profitability by Market Segments (Product/Age /Sales Channel/Region)
        • Sales Footprint
        • Strategy Overview
          • Marketing Strategy
          • Product Strategy
          • Channel Strategy
      • SACMI GROUP
        • Overview
        • Product Portfolio
        • Profitability by Market Segments (Product/Age /Sales Channel/Region)
        • Sales Footprint
        • Strategy Overview
          • Marketing Strategy
          • Product Strategy
          • Channel Strategy
      • GEA Group
        • Overview
        • Product Portfolio
        • Profitability by Market Segments (Product/Age /Sales Channel/Region)
        • Sales Footprint
        • Strategy Overview
          • Marketing Strategy
          • Product Strategy
          • Channel Strategy
      • Elopak Group
        • Overview
        • Product Portfolio
        • Profitability by Market Segments (Product/Age /Sales Channel/Region)
        • Sales Footprint
        • Strategy Overview
          • Marketing Strategy
          • Product Strategy
          • Channel Strategy
      • BW Packaging
        • Overview
        • Product Portfolio
        • Profitability by Market Segments (Product/Age /Sales Channel/Region)
        • Sales Footprint
        • Strategy Overview
          • Marketing Strategy
          • Product Strategy
          • Channel Strategy
  21. Assumptions & Acronyms Used
  22. Research Methodology

List of Tables

  • Table 1: Global Market Value (USD Million) Forecast by Region, 2020-2035
  • Table 2: Global Market Volume (Units) Forecast by Region, 2020-2035
  • Table 3: Global Market Value (USD Million) Forecast By Machine, 2020-2035
  • Table 4: Global Market Volume (Units) Forecast By Machine, 2020-2035
  • Table 5: Global Market Value (USD Million) Forecast By Packaging Type, 2020-2035
  • Table 6: Global Market Volume (Units) Forecast By Packaging Type, 2020-2035
  • Table 7: Global Market Value (USD Million) Forecast By Beverage Type, 2020-2035
  • Table 8: Global Market Volume (Units) Forecast By Beverage Type, 2020-2035
  • Table 9: Global Market Value (USD Million) Forecast By Capacity, 2020-2035
  • Table 10: Global Market Volume (Units) Forecast By Capacity, 2020-2035
  • Table 11: North America Market Value (USD Million) Forecast by Country, 2020-2035
  • Table 12: North America Market Volume (Units) Forecast by Country, 2020-2035
  • Table 13: North America Market Value (USD Million) Forecast By Machine, 2020-2035
  • Table 14: North America Market Volume (Units) Forecast By Machine, 2020-2035
  • Table 15: North America Market Value (USD Million) Forecast By Packaging Type, 2020-2035
  • Table 16: North America Market Volume (Units) Forecast By Packaging Type, 2020-2035
  • Table 17: North America Market Value (USD Million) Forecast By Beverage Type, 2020-2035
  • Table 18: North America Market Volume (Units) Forecast By Beverage Type, 2020-2035
  • Table 19: North America Market Value (USD Million) Forecast By Capacity, 2020-2035
  • Table 20: North America Market Volume (Units) Forecast By Capacity, 2020-2035
  • Table 21: Latin America Market Value (USD Million) Forecast by Country, 2020-2035
  • Table 22: Latin America Market Volume (Units) Forecast by Country, 2020-2035
  • Table 23: Latin America Market Value (USD Million) Forecast By Machine, 2020-2035
  • Table 24: Latin America Market Volume (Units) Forecast By Machine, 2020-2035
  • Table 25: Latin America Market Value (USD Million) Forecast By Packaging Type, 2020-2035
  • Table 26: Latin America Market Volume (Units) Forecast By Packaging Type, 2020-2035
  • Table 27: Latin America Market Value (USD Million) Forecast By Beverage Type, 2020-2035
  • Table 28: Latin America Market Volume (Units) Forecast By Beverage Type, 2020-2035
  • Table 29: Latin America Market Value (USD Million) Forecast By Capacity, 2020-2035
  • Table 30: Latin America Market Volume (Units) Forecast By Capacity, 2020-2035
  • Table 31: Europe Market Value (USD Million) Forecast by Country, 2020-2035
  • Table 32: Europe Market Volume (Units) Forecast by Country, 2020-2035
  • Table 33: Europe Market Value (USD Million) Forecast By Machine, 2020-2035
  • Table 34: Europe Market Volume (Units) Forecast By Machine, 2020-2035
  • Table 35: Europe Market Value (USD Million) Forecast By Packaging Type, 2020-2035
  • Table 36: Europe Market Volume (Units) Forecast By Packaging Type, 2020-2035
  • Table 37: Europe Market Value (USD Million) Forecast By Beverage Type, 2020-2035
  • Table 38: Europe Market Volume (Units) Forecast By Beverage Type, 2020-2035
  • Table 39: Europe Market Value (USD Million) Forecast By Capacity, 2020-2035
  • Table 40: Europe Market Volume (Units) Forecast By Capacity, 2020-2035
  • Table 41: East Asia Market Value (USD Million) Forecast by Country, 2020-2035
  • Table 42: East Asia Market Volume (Units) Forecast by Country, 2020-2035
  • Table 43: East Asia Market Value (USD Million) Forecast By Machine, 2020-2035
  • Table 44: East Asia Market Volume (Units) Forecast By Machine, 2020-2035
  • Table 45: East Asia Market Value (USD Million) Forecast By Packaging Type, 2020-2035
  • Table 46: East Asia Market Volume (Units) Forecast By Packaging Type, 2020-2035
  • Table 47: East Asia Market Value (USD Million) Forecast By Beverage Type, 2020-2035
  • Table 48: East Asia Market Volume (Units) Forecast By Beverage Type, 2020-2035
  • Table 49: East Asia Market Value (USD Million) Forecast By Capacity, 2020-2035
  • Table 50: East Asia Market Volume (Units) Forecast By Capacity, 2020-2035
  • Table 51: South Asia Market Value (USD Million) Forecast by Country, 2020-2035
  • Table 52: South Asia Market Volume (Units) Forecast by Country, 2020-2035
  • Table 53: South Asia Market Value (USD Million) Forecast By Machine, 2020-2035
  • Table 54: South Asia Market Volume (Units) Forecast By Machine, 2020-2035
  • Table 55: South Asia Market Value (USD Million) Forecast By Packaging Type, 2020-2035
  • Table 56: South Asia Market Volume (Units) Forecast By Packaging Type, 2020-2035
  • Table 57: South Asia Market Value (USD Million) Forecast By Beverage Type, 2020-2035
  • Table 58: South Asia Market Volume (Units) Forecast By Beverage Type, 2020-2035
  • Table 59: South Asia Market Value (USD Million) Forecast By Capacity, 2020-2035
  • Table 60: South Asia Market Volume (Units) Forecast By Capacity, 2020-2035
  • Table 61: Oceania Market Value (USD Million) Forecast by Country, 2020-2035
  • Table 62: Oceania Market Volume (Units) Forecast by Country, 2020-2035
  • Table 63: Oceania Market Value (USD Million) Forecast By Machine, 2020-2035
  • Table 64: Oceania Market Volume (Units) Forecast By Machine, 2020-2035
  • Table 65: Oceania Market Value (USD Million) Forecast By Packaging Type, 2020-2035
  • Table 66: Oceania Market Volume (Units) Forecast By Packaging Type, 2020-2035
  • Table 67: Oceania Market Value (USD Million) Forecast By Beverage Type, 2020-2035
  • Table 68: Oceania Market Volume (Units) Forecast By Beverage Type, 2020-2035
  • Table 69: Oceania Market Value (USD Million) Forecast By Capacity, 2020-2035
  • Table 70: Oceania Market Volume (Units) Forecast By Capacity, 2020-2035
  • Table 71: MEA Market Value (USD Million) Forecast by Country, 2020-2035
  • Table 72: MEA Market Volume (Units) Forecast by Country, 2020-2035
  • Table 73: MEA Market Value (USD Million) Forecast By Machine, 2020-2035
  • Table 74: MEA Market Volume (Units) Forecast By Machine, 2020-2035
  • Table 75: MEA Market Value (USD Million) Forecast By Packaging Type, 2020-2035
  • Table 76: MEA Market Volume (Units) Forecast By Packaging Type, 2020-2035
  • Table 77: MEA Market Value (USD Million) Forecast By Beverage Type, 2020-2035
  • Table 78: MEA Market Volume (Units) Forecast By Beverage Type, 2020-2035
  • Table 79: MEA Market Value (USD Million) Forecast By Capacity, 2020-2035
  • Table 80: MEA Market Volume (Units) Forecast By Capacity, 2020-2035

List of Figures

  • Figure 1: Global Market Volume (Units) Forecast 2020-2035
  • Figure 2: Global Market Pricing Analysis
  • Figure 3: Global Market Value (USD Million) Forecast 2020-2035
  • Figure 4: Global Market Value Share and BPS Analysis By Machine, 2025 and 2035
  • Figure 5: Global Market Y-o-Y Growth Comparison By Machine, 2025-2035
  • Figure 6: Global Market Attractiveness Analysis By Machine
  • Figure 7: Global Market Value Share and BPS Analysis By Packaging Type, 2025 and 2035
  • Figure 8: Global Market Y-o-Y Growth Comparison By Packaging Type, 2025-2035
  • Figure 9: Global Market Attractiveness Analysis By Packaging Type
  • Figure 10: Global Market Value Share and BPS Analysis By Beverage Type, 2025 and 2035
  • Figure 11: Global Market Y-o-Y Growth Comparison By Beverage Type, 2025-2035
  • Figure 12: Global Market Attractiveness Analysis By Beverage Type
  • Figure 13: Global Market Value Share and BPS Analysis By Capacity, 2025 and 2035
  • Figure 14: Global Market Y-o-Y Growth Comparison By Capacity, 2025-2035
  • Figure 15: Global Market Attractiveness Analysis By Capacity
  • Figure 16: Global Market Value (USD Million) Share and BPS Analysis by Region, 2025 and 2035
  • Figure 17: Global Market Y-o-Y Growth Comparison by Region, 2025-2035
  • Figure 18: Global Market Attractiveness Analysis by Region
  • Figure 19: North America Market Incremental $ Opportunity, 2025-2035
  • Figure 20: Latin America Market Incremental $ Opportunity, 2025-2035
  • Figure 21: Europe Market Incremental $ Opportunity, 2025-2035
  • Figure 22: East Asia Market Incremental $ Opportunity, 2025-2035
  • Figure 23: South Asia Market Incremental $ Opportunity, 2025-2035
  • Figure 24: Oceania Market Incremental $ Opportunity, 2025-2035
  • Figure 25: MEA Market Incremental $ Opportunity, 2025-2035
  • Figure 26: North America Market Value Share and BPS Analysis by Country, 2025 and 2035
  • Figure 27: North America Market Value Share and BPS Analysis By Machine, 2025 and 2035
  • Figure 28: North America Market Y-o-Y Growth Comparison By Machine, 2025-2035
  • Figure 29: North America Market Attractiveness Analysis By Machine
  • Figure 30: North America Market Value Share and BPS Analysis By Packaging Type, 2025 and 2035
  • Figure 31: North America Market Y-o-Y Growth Comparison By Packaging Type, 2025-2035
  • Figure 32: North America Market Attractiveness Analysis By Packaging Type
  • Figure 33: North America Market Value Share and BPS Analysis By Beverage Type, 2025 and 2035
  • Figure 34: North America Market Y-o-Y Growth Comparison By Beverage Type, 2025-2035
  • Figure 35: North America Market Attractiveness Analysis By Beverage Type
  • Figure 36: North America Market Value Share and BPS Analysis By Capacity, 2025 and 2035
  • Figure 37: North America Market Y-o-Y Growth Comparison By Capacity, 2025-2035
  • Figure 38: North America Market Attractiveness Analysis By Capacity
  • Figure 39: Latin America Market Value Share and BPS Analysis by Country, 2025 and 2035
  • Figure 40: Latin America Market Value Share and BPS Analysis By Machine, 2025 and 2035
  • Figure 41: Latin America Market Y-o-Y Growth Comparison By Machine, 2025-2035
  • Figure 42: Latin America Market Attractiveness Analysis By Machine
  • Figure 43: Latin America Market Value Share and BPS Analysis By Packaging Type, 2025 and 2035
  • Figure 44: Latin America Market Y-o-Y Growth Comparison By Packaging Type, 2025-2035
  • Figure 45: Latin America Market Attractiveness Analysis By Packaging Type
  • Figure 46: Latin America Market Value Share and BPS Analysis By Beverage Type, 2025 and 2035
  • Figure 47: Latin America Market Y-o-Y Growth Comparison By Beverage Type, 2025-2035
  • Figure 48: Latin America Market Attractiveness Analysis By Beverage Type
  • Figure 49: Latin America Market Value Share and BPS Analysis By Capacity, 2025 and 2035
  • Figure 50: Latin America Market Y-o-Y Growth Comparison By Capacity, 2025-2035
  • Figure 51: Latin America Market Attractiveness Analysis By Capacity
  • Figure 52: Europe Market Value Share and BPS Analysis by Country, 2025 and 2035
  • Figure 53: Europe Market Value Share and BPS Analysis By Machine, 2025 and 2035
  • Figure 54: Europe Market Y-o-Y Growth Comparison By Machine, 2025-2035
  • Figure 55: Europe Market Attractiveness Analysis By Machine
  • Figure 56: Europe Market Value Share and BPS Analysis By Packaging Type, 2025 and 2035
  • Figure 57: Europe Market Y-o-Y Growth Comparison By Packaging Type, 2025-2035
  • Figure 58: Europe Market Attractiveness Analysis By Packaging Type
  • Figure 59: Europe Market Value Share and BPS Analysis By Beverage Type, 2025 and 2035
  • Figure 60: Europe Market Y-o-Y Growth Comparison By Beverage Type, 2025-2035
  • Figure 61: Europe Market Attractiveness Analysis By Beverage Type
  • Figure 62: Europe Market Value Share and BPS Analysis By Capacity, 2025 and 2035
  • Figure 63: Europe Market Y-o-Y Growth Comparison By Capacity, 2025-2035
  • Figure 64: Europe Market Attractiveness Analysis By Capacity
  • Figure 65: East Asia Market Value Share and BPS Analysis by Country, 2025 and 2035
  • Figure 66: East Asia Market Value Share and BPS Analysis By Machine, 2025 and 2035
  • Figure 67: East Asia Market Y-o-Y Growth Comparison By Machine, 2025-2035
  • Figure 68: East Asia Market Attractiveness Analysis By Machine
  • Figure 69: East Asia Market Value Share and BPS Analysis By Packaging Type, 2025 and 2035
  • Figure 70: East Asia Market Y-o-Y Growth Comparison By Packaging Type, 2025-2035
  • Figure 71: East Asia Market Attractiveness Analysis By Packaging Type
  • Figure 72: East Asia Market Value Share and BPS Analysis By Beverage Type, 2025 and 2035
  • Figure 73: East Asia Market Y-o-Y Growth Comparison By Beverage Type, 2025-2035
  • Figure 74: East Asia Market Attractiveness Analysis By Beverage Type
  • Figure 75: East Asia Market Value Share and BPS Analysis By Capacity, 2025 and 2035
  • Figure 76: East Asia Market Y-o-Y Growth Comparison By Capacity, 2025-2035
  • Figure 77: East Asia Market Attractiveness Analysis By Capacity
  • Figure 78: South Asia Market Value Share and BPS Analysis by Country, 2025 and 2035
  • Figure 79: South Asia Market Value Share and BPS Analysis By Machine, 2025 and 2035
  • Figure 80: South Asia Market Y-o-Y Growth Comparison By Machine, 2025-2035
  • Figure 81: South Asia Market Attractiveness Analysis By Machine
  • Figure 82: South Asia Market Value Share and BPS Analysis By Packaging Type, 2025 and 2035
  • Figure 83: South Asia Market Y-o-Y Growth Comparison By Packaging Type, 2025-2035
  • Figure 84: South Asia Market Attractiveness Analysis By Packaging Type
  • Figure 85: South Asia Market Value Share and BPS Analysis By Beverage Type, 2025 and 2035
  • Figure 86: South Asia Market Y-o-Y Growth Comparison By Beverage Type, 2025-2035
  • Figure 87: South Asia Market Attractiveness Analysis By Beverage Type
  • Figure 88: South Asia Market Value Share and BPS Analysis By Capacity, 2025 and 2035
  • Figure 89: South Asia Market Y-o-Y Growth Comparison By Capacity, 2025-2035
  • Figure 90: South Asia Market Attractiveness Analysis By Capacity
  • Figure 91: Oceania Market Value Share and BPS Analysis by Country, 2025 and 2035
  • Figure 92: Oceania Market Value Share and BPS Analysis By Machine, 2025 and 2035
  • Figure 93: Oceania Market Y-o-Y Growth Comparison By Machine, 2025-2035
  • Figure 94: Oceania Market Attractiveness Analysis By Machine
  • Figure 95: Oceania Market Value Share and BPS Analysis By Packaging Type, 2025 and 2035
  • Figure 96: Oceania Market Y-o-Y Growth Comparison By Packaging Type, 2025-2035
  • Figure 97: Oceania Market Attractiveness Analysis By Packaging Type
  • Figure 98: Oceania Market Value Share and BPS Analysis By Beverage Type, 2025 and 2035
  • Figure 99: Oceania Market Y-o-Y Growth Comparison By Beverage Type, 2025-2035
  • Figure 100: Oceania Market Attractiveness Analysis By Beverage Type
  • Figure 101: Oceania Market Value Share and BPS Analysis By Capacity, 2025 and 2035
  • Figure 102: Oceania Market Y-o-Y Growth Comparison By Capacity, 2025-2035
  • Figure 103: Oceania Market Attractiveness Analysis By Capacity
  • Figure 104: MEA Market Value Share and BPS Analysis by Country, 2025 and 2035
  • Figure 105: MEA Market Value Share and BPS Analysis By Machine, 2025 and 2035
  • Figure 106: MEA Market Y-o-Y Growth Comparison By Machine, 2025-2035
  • Figure 107: MEA Market Attractiveness Analysis By Machine
  • Figure 108: MEA Market Value Share and BPS Analysis By Packaging Type, 2025 and 2035
  • Figure 109: MEA Market Y-o-Y Growth Comparison By Packaging Type, 2025-2035
  • Figure 110: MEA Market Attractiveness Analysis By Packaging Type
  • Figure 111: MEA Market Value Share and BPS Analysis By Beverage Type, 2025 and 2035
  • Figure 112: MEA Market Y-o-Y Growth Comparison By Beverage Type, 2025-2035
  • Figure 113: MEA Market Attractiveness Analysis By Beverage Type
  • Figure 114: MEA Market Value Share and BPS Analysis By Capacity, 2025 and 2035
  • Figure 115: MEA Market Y-o-Y Growth Comparison By Capacity, 2025-2035
  • Figure 116: MEA Market Attractiveness Analysis By Capacity
  • Figure 117: Global Market - Tier Structure Analysis
  • Figure 118: Global Market - Company Share Analysis

Frequently Asked Questions

How big is the ultra clean beverage packaging machine market in 2025?

The global ultra clean beverage packaging machine market is estimated to be valued at USD 3.1 billion in 2025.

What will be the size of the ultra clean beverage packaging machine market in 2035?

The market size for the ultra clean beverage packaging machine market is projected to reach USD 4.4 billion by 2035.

How much will be the ultra clean beverage packaging machine market growth between 2025 and 2035?

The ultra clean beverage packaging machine market is expected to grow at a CAGR of 3.6% between 2025 and 2035.

What are the key packaging types in the ultra clean beverage packaging machine market?

The key packaging types in the ultra clean beverage packaging machine market include bottles, cartons, pouches, and cans used across dairy, juice, and functional beverage industries.

Which packaging type segment is expected to contribute significant share in the ultra clean beverage packaging machine market in 2025?

The filling machines segment is expected to account for the highest share of 43.6% in the ultra clean beverage packaging machine market in 2025.

Explore Similar Insights

Future Market Insights

Ultra Clean Beverage Packaging Machines Market