The global ultra high precision power analyzers market is projected to grow from USD 164.5 million in 2025 to approximately USD 358.5 million by 2035, recording an absolute increase of USD 194.0 million over the forecast period. This translates into a total growth of 117.9%, with the market forecast to expand at a compound annual growth rate (CAGR) of 8% between 2025 and 2035. The market size is expected to grow by nearly 2.18X during the same period, supported by increasing demand for precise power measurement in electric vehicle development, growing emphasis on energy efficiency optimization in industrial applications, and expanding requirements for accurate power analysis in renewable energy systems.
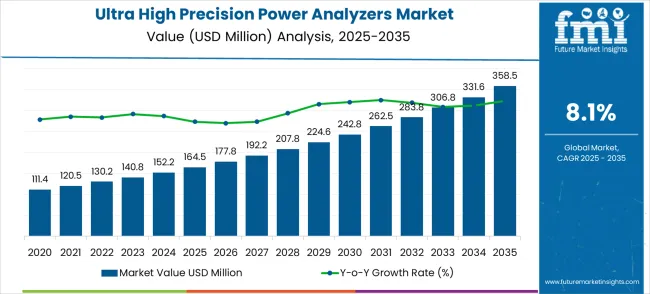
| Metric | Value |
|---|---|
| Estimated Value in (2025E) | USD 164.5 million |
| Forecast Value in (2035F) | USD 358.5 million |
| Forecast CAGR (2025 to 2035) | 8% |
The ultra high precision power analyzers market represents a significant and steadily increasing portion of the broader electrical measurement and instrumentation landscape. Its share is closely tied to the growth of the precision testing and calibration segment, accounting for nearly 35% of the parent market, while industrial automation and energy efficiency applications contribute about 27%. Additional influence comes from research and development laboratories at 18%, power grid monitoring and smart metering at 12%, and niche high-end electronics testing at 8%. The market’s expansion is driven by the rising demand for extremely accurate energy measurement, regulatory compliance in energy-intensive industries, and the need for advanced calibration tools that ensure minimal error margins.
The integration of digital connectivity, real-time monitoring capabilities, and enhanced data analysis functions has further strengthened its relevance across various applications, from renewable energy testing to high-performance industrial machinery. Manufacturers are focusing on improving device sensitivity, expanding frequency range, and supporting multi-parameter measurements, which are critical for clients requiring ultra-high accuracy. As industries increasingly rely on precise power data for efficiency and cost optimization, the ultra-high precision power analyzers market continues to carve out a larger footprint within the instrumentation ecosystem.
Market expansion is being supported by the increasing complexity of electric vehicle powertrains and energy systems that require extremely accurate power measurement for performance validation and regulatory compliance. Modern electric vehicles incorporate sophisticated power management systems, multiple power converters, and advanced battery technologies that demand precise measurement capabilities to optimize efficiency and ensure safety standards. Ultra high precision power analyzers provide the measurement accuracy necessary for validating electric vehicle components, testing charging systems, and verifying energy efficiency compliance across diverse operating conditions.
The growing emphasis on renewable energy integration and grid modernization is driving demand for precise power measurement instruments that can accurately characterize power quality, harmonic content, and energy efficiency in complex electrical systems. Smart grid development and energy storage system deployment require measurement tools that can provide detailed power analysis for system optimization, fault detection, and performance monitoring. The expansion of photovoltaic installations, wind energy systems, and advanced energy storage technologies creates significant opportunities for ultra high precision analyzers that can ensure optimal system performance and regulatory compliance.
The Ultra High Precision Power Analyzers market is entering a rapid growth phase, fueled by EV validation, photovoltaic certification, and precision laboratory applications. By 2035, these pathways together unlock USD 180–210 million in incremental revenue opportunities.
The market is segmented by precision level, application, and region. By precision level, the market is divided into 0.01% and 0.02%, 0.05%, and others. By application, the market is categorized into automotive, photovoltaic and energy storage, laboratory, and others. Regionally, the market is divided into North America, Europe, East Asia, South Asia & Pacific, Latin America, and Middle East & Africa.
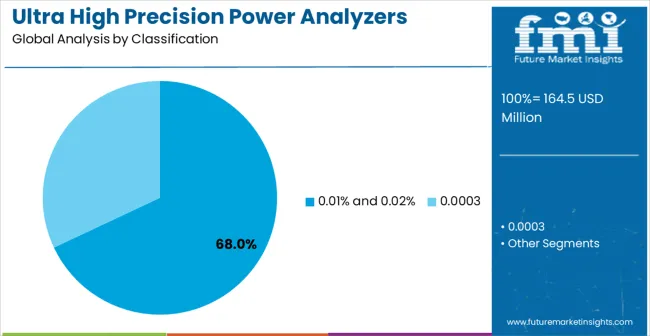
The 0.01% and 0.02% precision levels are projected to account for 68% of the ultra high precision power analyzers market in 2025, highlighting their dominant role in applications demanding exact power measurement. These precision specifications are critical for sectors where even minor deviations can compromise system performance, safety, or regulatory compliance. Electric vehicle (EV) powertrain testing, advanced power electronics development, and renewable energy system validation heavily rely on analyzers capable of such ultra-high accuracy to ensure reliable, repeatable results. By minimizing measurement uncertainty, these precision levels enable precise characterization of energy conversion efficiency, battery state-of-charge behavior, and inverter performance, directly impacting product quality and innovation cycles.
Manufacturers, testing laboratories, and R&D facilities prefer these analyzers due to their ability to maintain consistent performance across extended testing durations and varying environmental conditions. Instruments meeting 0.01% and 0.02% precision standards are indispensable for compliance with international standards such as IEC, IEEE, and ISO, offering traceable measurements for regulatory audits and certifications. These analyzers support fault detection, energy efficiency validation, and component optimization in high-stakes applications where reliability and repeatability are non-negotiable, creating strong adoption momentum in both established and emerging markets.
Key Drivers:
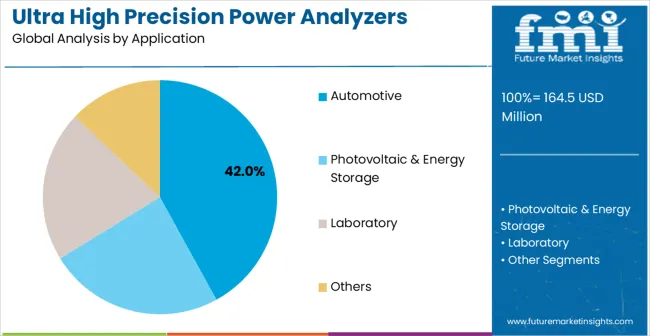
Automotive applications are projected to represent 42% of ultra high precision power analyzer demand in 2025, reflecting the increasing reliance on precise power measurement in electric and hybrid vehicle development. Modern EV powertrains comprise complex systems, including motor drives, onboard chargers, DC-DC converters, and battery management systems, all of which require highly accurate power characterization for optimization, efficiency validation, and regulatory compliance. Ultra high precision analyzers provide detailed insights into system efficiency, energy loss reduction, and thermal performance, allowing manufacturers to improve vehicle range, reduce energy consumption, and meet stringent global efficiency standards.
The segment is supported by the rapid growth of electric vehicle production and tightening government regulations regarding energy consumption and emissions. Testing laboratories and automotive manufacturers deploy these analyzers for component characterization, vehicle-level system testing, and charging infrastructure validation, ensuring products meet safety and efficiency standards. The growing emphasis on battery life optimization, regenerative braking efficiency, and charging cycle performance creates demand for high-accuracy analyzers capable of capturing minute variations in electrical parameters. These instruments also facilitate predictive maintenance, fault diagnosis, and advanced modeling for next-generation EV systems.
Key Drivers:
Photovoltaic (PV) and energy storage applications are projected to contribute 35% of the ultra high precision power analyzer market in 2025, establishing this segment as the second-largest application category. Solar inverter manufacturers and energy storage system developers depend on highly accurate power analyzers to validate system efficiency, ensure grid compliance, and optimize performance under fluctuating environmental conditions. Accurate power measurement is essential for commissioning PV installations, monitoring energy storage systems, and maintaining long-term operational reliability, particularly as renewable energy adoption accelerates globally.
The deployment of distributed energy resources, grid-scale solar plants, and advanced energy storage facilities requires precise characterization of power quality, efficiency, and grid interaction. Regulatory mandates and certification standards further drive the need for high-precision analyzers capable of validating inverter and storage system performance. Smart grid technologies and advanced energy management systems amplify the demand for detailed power analytics, supporting operational optimization, fault detection, and predictive maintenance. Consequently, ultra high precision analyzers become indispensable tools in ensuring both compliance and performance efficiency for the renewable energy ecosystem.
Key Drivers:
The ultra high precision power analyzers market is advancing rapidly due to increasing complexity in electric vehicle powertrains and growing demand for accurate power measurement in renewable energy applications. The market faces challenges including high instrument costs that limit adoption in cost-sensitive applications, technical complexity requiring specialized operator training, and competition from alternative measurement approaches. Innovation in measurement accuracy, connectivity features, and application-specific functionality continues to influence product development and market expansion patterns.
The growing deployment of electric vehicles is creating significant demand for ultra high precision power analyzers that can accurately characterize powertrain efficiency, charging system performance, and battery management system operation. EV development requires detailed power measurement across diverse operating conditions to optimize component design, validate system integration, and ensure regulatory compliance. Advanced testing protocols for electric vehicle components demand measurement instruments that can provide traceable accuracy and comprehensive power analysis capabilities for product development and regulatory approval processes.
Modern ultra high precision power analyzer manufacturers are incorporating advanced features, including real-time data analysis, automated test sequencing, and cloud connectivity to enhance measurement productivity and data management capabilities. These technologies improve measurement efficiency while providing comprehensive documentation and analysis tools for complex testing applications. Advanced measurement capabilities enable automated testing protocols, statistical analysis, and integration with existing laboratory information management systems that add value beyond basic power measurement functionality.
Specialized applications in electric vehicle testing, renewable energy validation, and advanced power electronics development are driving development of application-specific power analyzers with enhanced accuracy specifications and specialized measurement functions. Electric vehicle testing applications require instruments that can handle high-voltage, high-current measurements with precise timing resolution for motor efficiency analysis and charging system validation. These specialized markets support premium pricing while creating opportunities for manufacturers who can provide industry-specific functionality and technical support services.
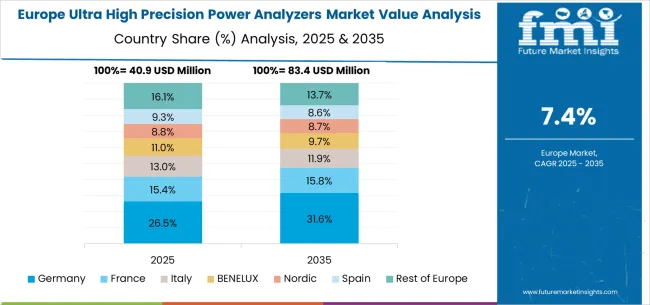
The ultra high precision power analyzer market in Europe demonstrates strong development across major industrial economies, with Germany showing leadership through its advanced automotive industry and emphasis on precision measurement technologies. German automotive manufacturers and testing laboratories leverage comprehensive power measurement systems for electric vehicle development and renewable energy applications requiring extreme measurement accuracy. The country benefits from established expertise in precision instrumentation and strong demand from automotive, renewable energy, and industrial automation sectors, utilizing sophisticated power analysis and validation systems.
France represents a significant market driven by its nuclear power industry and renewable energy development sector, both requiring specialized power measurement equipment for system validation and regulatory compliance. French companies have developed expertise in power system analysis and grid integration technologies where precise power measurement is essential for system optimization and safety verification. The UK exhibits considerable growth through its focus on electric vehicle development and offshore wind energy projects, with companies investing in advanced measurement systems for powertrain validation and renewable energy system optimization.
Italy and Spain show expanding interest in renewable energy testing and automotive electronics validation, particularly in applications requiring compliance with European energy efficiency standards and automotive regulations. BENELUX countries contribute through their focus on high-tech industrial applications and advanced manufacturing facilities requiring precision power measurement for quality control and regulatory compliance. Eastern Europe and Nordic regions display growing potential driven by industrial modernization and renewable energy development projects demanding reliable measurement technologies for system validation and performance monitoring.
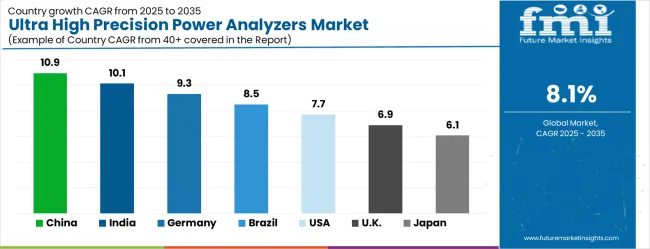
| Country | CAGR (2025-2035) |
|---|---|
| China | 10.9% |
| India | 10.1% |
| Germany | 9.3% |
| Brazil | 8.5% |
| USA | 7.7% |
| UK | 6.9% |
| Japan | 6.1% |
The ultra high precision power analyzers market is experiencing robust growth globally, with China leading at 10.9% CAGR through 2035, driven by massive electric vehicle production, renewable energy expansion, and industrial modernization requiring precise power measurement capabilities. India follows at 10.1%, supported by the growing automotive electronics industry, renewable energy development, and increasing emphasis on energy efficiency measurement. Germany records 9.3% growth, emphasizing precision measurement, automotive excellence, and renewable energy system validation. Brazil shows 8.5% expansion, driven by industrial development and renewable energy project growth.
The report covers an in-depth analysis of 40+ countries; seven top-performing countries are highlighted below.
Revenue from ultra high precision power analyzers in China is projected to exhibit the highest growth rate with a CAGR of 10.9% through 2035, driven by massive electric vehicle production expansion, renewable energy system deployment, and industrial modernization requiring extremely accurate power measurement capabilities. The country's leadership in electric vehicle manufacturing and battery technology development creates significant demand for precision measurement instruments that can validate component performance and ensure quality control standards. Major automotive manufacturers and testing laboratories are establishing comprehensive power measurement capabilities to support electric vehicle development and regulatory compliance requirements.
Government electric vehicle promotion policies and renewable energy development initiatives are mandating accurate power measurement for efficiency validation and regulatory compliance, driving demand for certified measurement instruments throughout major industrial regions. Manufacturing sector expansion and quality improvement programs are supporting increased adoption of precision measurement systems that can optimize production processes while ensuring product performance and regulatory compliance across diverse applications.
Revenue from ultra high precision power analyzers in India is expanding at a CAGR of 10.1%, supported by automotive electronics industry growth, renewable energy development, and increasing emphasis on energy efficiency measurement and regulatory compliance. The country's growing electric vehicle market and renewable energy sector create opportunities for precision measurement instruments that can support component development, system validation, and performance optimization. Testing laboratories and manufacturing facilities are gradually adopting advanced power measurement systems to ensure product quality and regulatory compliance requirements.
Industrial modernization programs and manufacturing capability improvement initiatives are driving demand for precision measurement instruments that can support advanced manufacturing processes and quality control systems. Automotive and electronics manufacturers are investing in power measurement capabilities to ensure product performance while meeting international quality and efficiency standards.
Demand for ultra high precision power analyzers in Germany is projected to grow at a CAGR of 9.3%, supported by the country's emphasis on automotive innovation, renewable energy system development, and precision measurement technology leadership. German automotive manufacturers prioritize measurement accuracy and system reliability, creating demand for ultra high precision instruments that can support electric vehicle development and advanced powertrain testing. The market is characterized by focus on technical excellence, comprehensive validation protocols, and compliance with stringent German quality and safety standards.
Renewable energy companies and research institutions implement advanced power measurement systems that require extremely accurate analysis capabilities for system optimization, grid integration studies, and regulatory compliance validation. The country's expertise in precision instrumentation and industrial automation creates opportunities for advanced power analyzers that can integrate with existing testing infrastructure while providing enhanced measurement capabilities and data analysis functions.
Revenue from ultra high precision power analyzers in Brazil is growing at a CAGR of 8.5%, driven by renewable energy project development, industrial modernization, and increasing emphasis on energy efficiency measurement in manufacturing applications. The country's expanding renewable energy sector and growing industrial automation adoption create demand for precision measurement instruments that can support system validation and performance monitoring. Manufacturing facilities are investing in power measurement systems that can ensure energy efficiency compliance while optimizing operational costs.
Renewable energy development and grid modernization projects require precision measurement capabilities for system commissioning, performance validation, and ongoing monitoring applications. Industrial facilities implement power measurement systems to comply with energy efficiency regulations while optimizing manufacturing processes and reducing operational costs through detailed power analysis and system optimization.
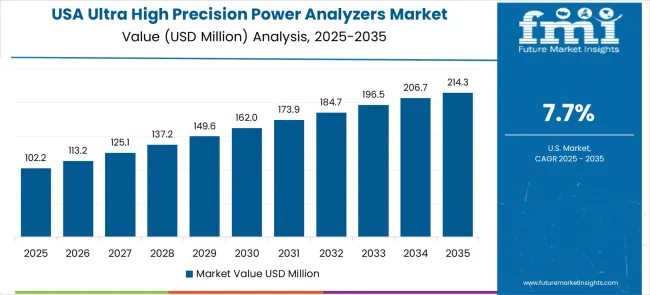
Demand for ultra high precision power analyzers in the USA is expanding at a CAGR of 7.7%, driven by electric vehicle development, renewable energy system deployment, and growing emphasis on energy efficiency validation and regulatory compliance. American automotive manufacturers and testing laboratories prioritize measurement accuracy and regulatory compliance, creating demand for ultra high precision instruments that can support vehicle development and component validation. The market benefits from established technical standards and industry requirements for precision measurement in critical applications.
Research institutions and national laboratories require instruments that meet stringent accuracy specifications while providing comprehensive measurement capabilities for advanced power electronics research and renewable energy system development. Industrial manufacturers implement power measurement systems that can ensure regulatory compliance while supporting operational efficiency improvement and quality assurance programs.
Revenue from ultra high precision power analyzers in the UK is projected to grow at a CAGR of 6.9% through 2035, supported by offshore wind energy development, electric vehicle industry growth, and emphasis on energy efficiency measurement and grid modernization. British energy companies are investing in advanced power measurement technologies for offshore wind system validation and grid integration studies that require extremely accurate power analysis capabilities. Automotive manufacturers and testing laboratories utilize precision measurement systems for electric vehicle development and component validation meeting regulatory standards.
Industrial facilities implement comprehensive power measurement systems that provide detailed energy analysis for efficiency optimization and regulatory compliance. Research institutions and testing laboratories require advanced measurement capabilities for renewable energy system development and power electronics research supporting grid modernization and energy storage applications.
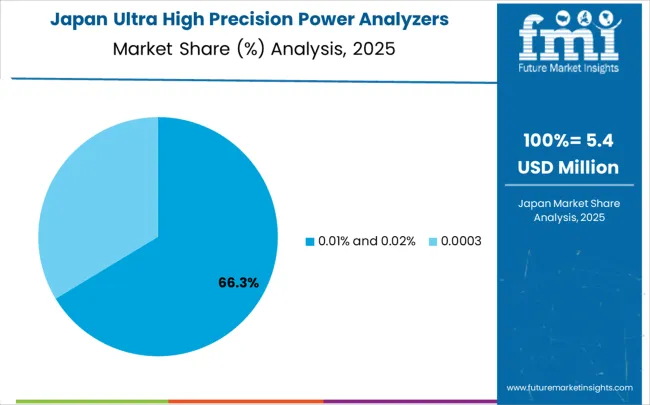
Revenue from ultra high precision power analyzers in Japan is projected to grow at a CAGR of 6.1% through 2035, driven by the country's focus on precision measurement technology, automotive electronics development, and advanced power electronics research. Japanese manufacturers prioritize measurement accuracy and instrument reliability while implementing comprehensive quality systems that require certified measurement equipment meeting strict performance specifications. The market is characterized by emphasis on technical excellence and continuous improvement in measurement technology and application development.
Automotive electronics manufacturers and research institutions require ultra-precise measurement instruments that can operate reliably under demanding conditions while providing traceable measurement documentation for quality assurance and regulatory compliance. Industrial automation systems incorporate advanced power measurement capabilities that support process optimization and predictive maintenance programs for enhanced operational efficiency.
The ultra high precision power analyzer market is characterized by competition among established test and measurement companies, specialized instrumentation manufacturers, and emerging technology providers. Companies are investing in measurement accuracy improvement, advanced connectivity features, application-specific functionality, and comprehensive customer support services to deliver reliable, accurate, and user-friendly power analysis solutions. Technical innovation, measurement precision, and application expertise are central to strengthening product portfolios and market presence in this specialized instrumentation segment.
Yokogawa Electric, Japan-based, leads the market with comprehensive ultra high precision power analyzer product lines and established customer relationships in automotive and renewable energy applications, leveraging advanced measurement technology and extensive technical support capabilities. Fluke, USA-based, provides reliable measurement instruments with a focus on industrial applications and field service requirements. Keysight Technologies, USA-based, offers advanced power measurement solutions with emphasis on automotive testing and research applications requiring extreme accuracy specifications.
Hioki, Japan-based, specializes in precision power measurement technologies for automotive and industrial applications with comprehensive technical support. Dewesoft, Slovenia-based, provides advanced measurement systems with integrated data acquisition and analysis capabilities. DEWETRON GmbH, Austria-based, offers specialized measurement solutions for demanding applications. Chroma ATE, Taiwan-based, focuses on automated test equipment and precision measurement for manufacturing applications. ZLG, Ainuo Instrument, ZES ZIMMER Electronic Systems, Newtons4th, and Vitrek represent diverse regional and specialized suppliers serving specific market segments with innovative measurement technologies and customer-focused solutions.
| Items | Values |
|---|---|
| Quantitative Units (2025) | USD 164.5 million |
| Precision Level | 0.01% and 0.02%, 0.05%, Others |
| Application | Automotive, Photovoltaic and Energy Storage, Laboratory, Others |
| Regions Covered | North America, Europe, East Asia, South Asia & Pacific, Latin America, Middle East & Africa |
| Countries Covered | United States, Canada, United Kingdom, Germany, France, China, Japan, South Korea, India, Brazil, Australia and 40+ countries |
| Key Companies Profiled | Yokogawa Electric, Fluke, Keysight Technologies, Hioki, Dewesoft, DEWETRON GmbH, Chroma ATE, ZLG, Ainuo Instrument, ZES ZIMMER Electronic Systems, Newtons4th, Vitrek |
| Additional Attributes | Dollar sales by precision level and measurement range specifications, regional demand trends across North America, Europe, and Asia-Pacific, competitive landscape with established measurement instrument manufacturers and emerging technology providers, buyer preferences for accuracy versus cost optimization, integration with automated test systems and laboratory information management platforms, innovations in measurement speed and connectivity capabilities, and adoption of specialized applications with enhanced calibration services and regulatory compliance features. |
The global ultra high precision power analyzers market is estimated to be valued at USD 164.5 million in 2025.
The market size for the ultra high precision power analyzers market is projected to reach USD 358.5 million by 2035.
The ultra high precision power analyzers market is expected to grow at a 8.1% CAGR between 2025 and 2035.
The key product types in ultra high precision power analyzers market are 0.01% and 0.02% and 0.0003.
In terms of application, automotive segment to command 42.0% share in the ultra high precision power analyzers market in 2025.


Our Research Products

The "Full Research Suite" delivers actionable market intel, deep dives on markets or technologies, so clients act faster, cut risk, and unlock growth.

The Leaderboard benchmarks and ranks top vendors, classifying them as Established Leaders, Leading Challengers, or Disruptors & Challengers.

Locates where complements amplify value and substitutes erode it, forecasting net impact by horizon

We deliver granular, decision-grade intel: market sizing, 5-year forecasts, pricing, adoption, usage, revenue, and operational KPIs—plus competitor tracking, regulation, and value chains—across 60 countries broadly.

Spot the shifts before they hit your P&L. We track inflection points, adoption curves, pricing moves, and ecosystem plays to show where demand is heading, why it is changing, and what to do next across high-growth markets and disruptive tech

Real-time reads of user behavior. We track shifting priorities, perceptions of today’s and next-gen services, and provider experience, then pace how fast tech moves from trial to adoption, blending buyer, consumer, and channel inputs with social signals (#WhySwitch, #UX).

Partner with our analyst team to build a custom report designed around your business priorities. From analysing market trends to assessing competitors or crafting bespoke datasets, we tailor insights to your needs.
Supplier Intelligence
Discovery & Profiling
Capacity & Footprint
Performance & Risk
Compliance & Governance
Commercial Readiness
Who Supplies Whom
Scorecards & Shortlists
Playbooks & Docs
Category Intelligence
Definition & Scope
Demand & Use Cases
Cost Drivers
Market Structure
Supply Chain Map
Trade & Policy
Operating Norms
Deliverables
Buyer Intelligence
Account Basics
Spend & Scope
Procurement Model
Vendor Requirements
Terms & Policies
Entry Strategy
Pain Points & Triggers
Outputs
Pricing Analysis
Benchmarks
Trends
Should-Cost
Indexation
Landed Cost
Commercial Terms
Deliverables
Brand Analysis
Positioning & Value Prop
Share & Presence
Customer Evidence
Go-to-Market
Digital & Reputation
Compliance & Trust
KPIs & Gaps
Outputs
Full Research Suite comprises of:
Market outlook & trends analysis
Interviews & case studies
Strategic recommendations
Vendor profiles & capabilities analysis
5-year forecasts
8 regions and 60+ country-level data splits
Market segment data splits
12 months of continuous data updates
DELIVERED AS:
PDF EXCEL ONLINE
Ultra-low Temperature Cooling Fan Market Size and Share Forecast Outlook 2025 to 2035
Ultra-low Temperature Air Source Heat Pump Units Market Size and Share Forecast Outlook 2025 to 2035
Ultrasound Conductivity Gels Market Size and Share Forecast Outlook 2025 to 2035
Ultra Short Base Line (USBL) Positioning Systems Market Size and Share Forecast Outlook 2025 to 2035
Ultra-Low Temperature Perfluoroelastomer Market Size and Share Forecast Outlook 2025 to 2035
Ultrasound Market Size and Share Forecast Outlook 2025 to 2035
Ultrasound Skin Tightening Devices Market Size and Share Forecast Outlook 2025 to 2035
Ultralight Aircraft Market Size and Share Forecast Outlook 2025 to 2035
Ultrasonic Jewelry Cleaning Machine Market Size and Share Forecast Outlook 2025 to 2035
Ultrasonic Sealing Machines Market Size and Share Forecast Outlook 2025 to 2035
Ultraviolet Transilluminator Imaging Systems Market Size and Share Forecast Outlook 2025 to 2035
Ultra-Fine Ath Market Size and Share Forecast Outlook 2025 to 2035
Ultra-thin Temperature Plate Market Size and Share Forecast Outlook 2025 to 2035
Ultrasonic NDT Equipment Market Size and Share Forecast Outlook 2025 to 2035
Ultra Wideband Anchor and Tags Market Size and Share Forecast Outlook 2025 to 2035
Ultrapure Water Market Size and Share Forecast Outlook 2025 to 2035
Ultrasonic Air Bubble Detectors Market Size and Share Forecast Outlook 2025 to 2035
Ultracapacitors Market Size and Share Forecast Outlook 2025 to 2035
Ultra-Low Temperature Freezers Market Size and Share Forecast Outlook 2025 to 2035
Ultrasonic Pouch Sealers Market Analysis Size and Share Forecast Outlook 2025 to 2035

Thank you!
You will receive an email from our Business Development Manager. Please be sure to check your SPAM/JUNK folder too.
Chat With
MaRIA