

- Market Size (2026)
- USD 280.0 Mn
- Forecast (2036)
- USD 8099.0 Mn
- CAGR (2026 to 2036)
- 40.0%
How big is the Vehicle Teleoperation Market in 2026?
USD 280.0 million in 2026 and USD 8,099.0 million by 2036 at a 40.0% CAGR.
Sales of vehicle teleoperation are estimated to rise at 40.0% CAGR from 2026 to 2036, increasing valuation from USD 280.0 million in 2026 to USD 8,099.0 million by 2036. Autonomous fleets require reliable support to handle unexpected road challenges. Remote fallback capacity preserves fleet continuity during blocked routes and uncertain road conditions. Centralized operator teams supervise vehicle exceptions based on secure video and control links. Real-world success proves the commercial viability of this remote assistance model. Vay reported in March 2026 surpassing 50,000 customer trips in Las Vegas, demonstrating sustained commercial use for remotely delivered vehicles. Repeated service activity further encourages investment in operator stations and fleet-control software.
Regional market dynamics significantly influence fleet operators to deploy teleoperation technology worldwide. United States and European Union operators prioritize safety records and dependable network handover. Fleets in China and Japan favor dense service zones and coordinated vehicle supervision. Expanding mobile coverage promotes new Indian programs across controlled logistics sites. Government rules directly shape such regional safety requirements. National Highway Traffic Safety Administration outlined 3 automated-vehicle framework principles in August 2025. These guidelines successfully direct attention toward transparent safety oversight across United States programs.
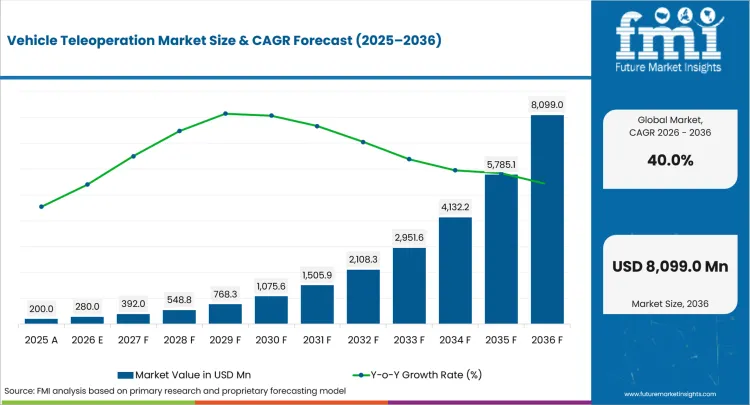
| Metric | Value |
|---|---|
| 2025 Market Size | USD 200.0 million |
| 2026 Market Size | USD 280.0 million |
| 2036 Market Size | USD 8,099.0 million |
| Forecast CAGR (2026-2036) | 40.0% |
| Pricing Model Focus | SaaS |
| SaaS Share (2026) | 44.0% |
| Deployment Focus | Cloud |
| Cloud Share (2026) | 42.0% |
| Technology Focus | Remote Driving Stations |
| Remote Driving Stations Share (2026) | 36.0% |
Summary of Vehicle Teleoperation Market
| Market Signal | Commercial Impact |
|---|---|
| Demand and Growth Drivers | Vehicle teleoperation selection progresses as autonomous fleets connect remote intervention with service continuity. Program decisions reflect latency evidence and operator readiness.
|
| Product and Segment View | Segment direction is led by SaaS, followed by cloud and remote driving stations. Specification review centers on network resilience and operator workload.
|
| Geography and Growth Outlook | Country movement differs due to autonomous fleet activity and communications coverage. Commercial progress reflects local approval paths and operating evidence.
|
| Competitive View | Competition centers on safe handover and dependable connectivity. Commercial progress favors companies providing operating evidence and fleet support.
|
| Analyst Perspective | Vehicle teleoperation supports commercial fleets facing incomplete autonomy across complex operating routes. Vendor progress reflects measured trials and documented operator procedures.
|
Source: Future Market Insights analysis, 2026.
How is vehicle teleoperation market segmented?
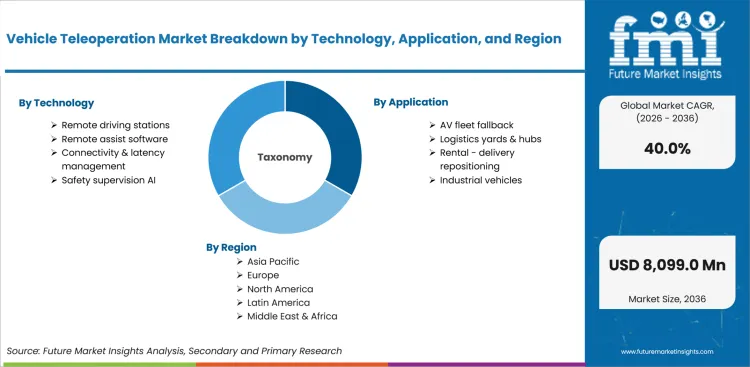
The vehicle teleoperation market is segmented by technology, application, deployment, end-use, pricing model and region.
The vehicle teleoperation sector is segmented by technology, application, deployment, end-use, pricing model and region. Technology assessment covers remote driving stations, remote assist software, connectivity management and safety supervision AI. Application review spans AV fleet fallback, logistics yards, vehicle repositioning and industrial vehicles. Deployment choices comprise cloud, hybrid and on-premise configurations. End-use analysis examines AV operators, logistics fleets, car-sharing providers and public transit agencies. Pricing models include SaaS, per-vehicle licenses, operations services and pilot programs. Geographic review covers United States, European Union, China, Japan and India.
Why do remote driving stations lead technology selection?
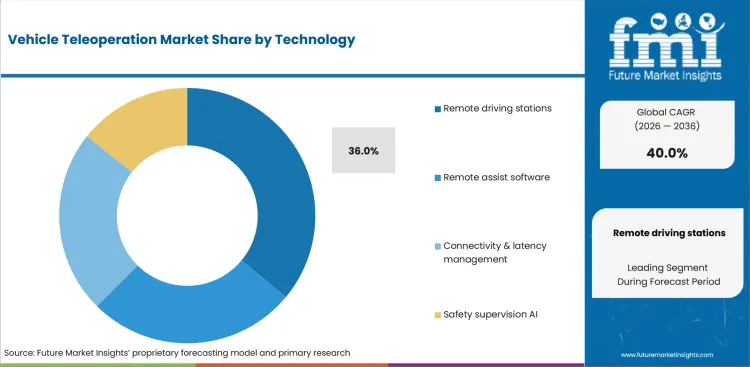
Vay reported in April 2026 expanding its Las Vegas fleet to 175 vehicles, increasing station-capacity requirements for remote delivery activity. Dedicated steering and pedal controls convert operator input into direct vehicle commands across public streets. Multi-screen video and audio feeds then provide spatial awareness across complex traffic situations. Safety supervision AI complements manual control by identifying hazards and operator attention risks across software defined vehicle programs.
- Remote driving stations are set to command 36.0% share in 2026, led by direct control and dedicated operator interfaces. Fleet teams assess control latency and camera coverage across complete intervention cycles.
- Remote assist software supports route guidance and exception resolution without continuous manual control. Connectivity and latency management maintains command quality across network transitions. Safety supervision AI reviews hazards and operator attention across prolonged shifts.
How does AV fleet fallback guide application demand?
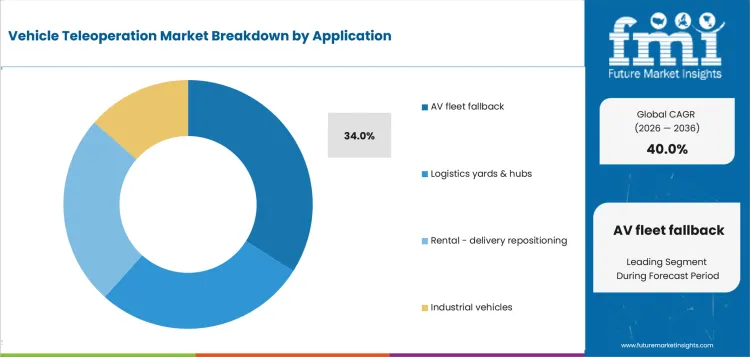
Commercial fleet scale increases the frequency of blocked lanes and unusual instructions requiring experienced judgment. Remote intervention addresses such exceptions without removing vehicles from active service areas. Predictable logistics-yard routes extend similar supervision to trailer and container movement. Rental repositioning and industrial vehicle programs further apply remote control across distributed or hazardous operating sites. Waymo reported in May 2025 providing more than 250,000 paid trips each week, expanding exception-handling requirements across commercial autonomous fleets.
- By application demand, AV fleet fallback is anticipated to secure 34.0% share in 2026 since being influenced by commercial autonomous services requiring human support during unusual operating events. Supervisors evaluate intervention frequency and response time across public-road routes.
- Logistics yards and hubs offer repeatable paths for remote tractor and container movement. Rental and delivery repositioning supports vehicle placement between trips across changing service zones. Industrial vehicles extend supervision across controlled work areas and hazardous assignments.
Why does cloud account for deployment leadership?
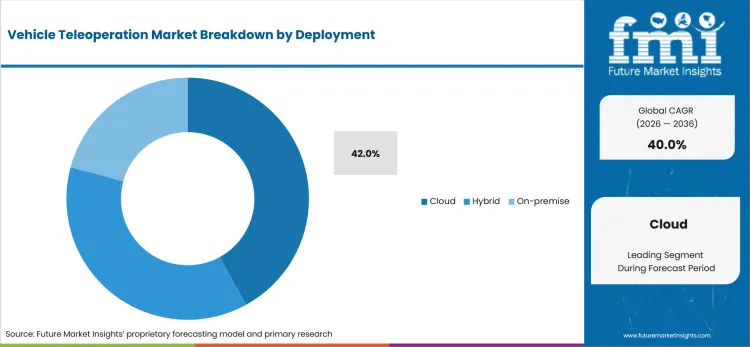
International Telecommunication Union reported in November 2025 estimating roughly 3 billion 5G subscriptions, influencing remote access across distributed vehicle operations. Expanding connectivity allows cloud systems to centralize fleet status and operator sessions depending on shared control infrastructure. Shared software updates then maintain consistent features across expanding fleets. Hybrid configurations preserve selected local processing during network degradation. On-premise systems address ports and industrial facilities requiring direct infrastructure control. Connected vehicle technology strengthens remote supervision through additional vehicle data exchange.
- In 2026, cloud is forecast to garner 42.0% share as it promotes centralized monitoring and recurring software access across multi-location fleets. Commercial teams compare session availability and regional network performance during deployment review.
- Hybrid deployment combines cloud coordination with selected local processing for operational continuity. On-premise systems support controlled sites requiring internal network management and restricted data access.
Why do AV operators lead end-use demand?
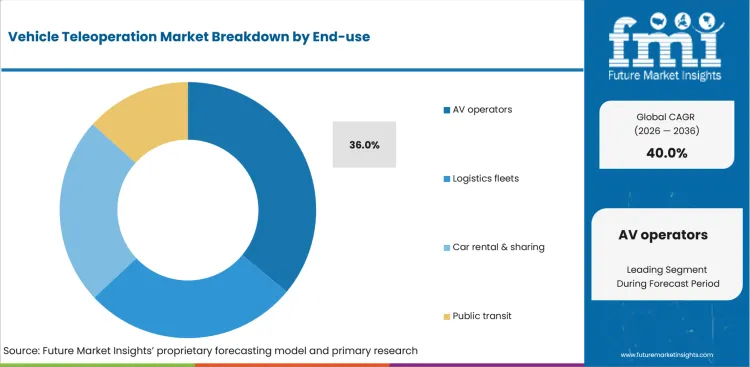
Driver monitoring system attracts operator attention review across each supervised service model. Logistics fleets apply remote control to yard movements and delivery exceptions across dispersed sites. Car rental and sharing providers use similar capabilities for vehicle repositioning between customer trips. Public transit programs extend supervision to autonomous shuttles and buses following fixed routes. Waymo reported in December 2025 serving more than 14 million trips during 2025, creating operating requirements for centralized fleet response and incident handling. AV operators manage such requirements across software-defined fleets serving public roads and commercial zones.
- AV operators are projected to represent 36.0% share of end-use in 2026, guided by commercial autonomous services requiring dependable fallback across public roads. Operating teams compare station staffing and intervention records across complete service periods.
- Logistics fleets emphasize yard movement and remote recovery across distributed assets. Car rental and sharing providers focus on repositioning convenience across changing customer zones. Public transit programs assess supervised autonomy across structured routes and scheduled passenger services.
How does SaaS retain pricing model strength?
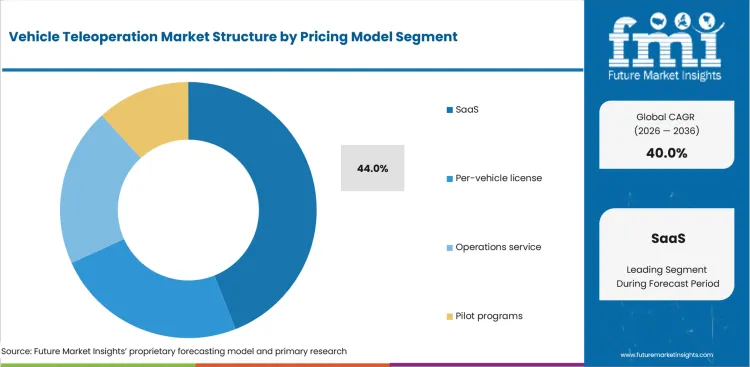
Elmo reported in March 2025 completing a 3,400 km remote drive, extending evidence for licensed teleoperation platforms across cross-border vehicle programs. Licensed platforms support SaaS pricing through recurring software access and continuing feature delivery across changing fleet sizes. Per-vehicle licenses provide predictable costs for defined vehicle groups requiring stable access terms. Operations services extend platform access led by trained remote drivers and dedicated station support. Pilot programs provide limited deployment periods for safety validation and operator training prior to commercial expansion. Commercial vehicle telematics complements each pricing approach through fleet data supporting service review.
- Based on pricing model, SaaS is estimated to hold 44.0% share in 2026 owing to recurring access and continuing software support across expanding vehicle fleets. Operators connect subscription decisions with system availability and defined service response.
- Per-vehicle licenses support fleet budgeting across fixed asset counts. Operations services add trained personnel and station management for continuing intervention coverage. Pilot programs support structured evaluation prior to commercial expansion.
What are drivers, restraints, and opportunities in vehicle teleoperation market?
Regulated remote fallback and fleet continuity support vehicle teleoperation review. Network interruptions and unsettled operating rules may delay wider deployment.
- Driver: Autonomous fleets need human intervention for blocked paths and uncertain road behavior across complex public-road settings. Remote control teams preserve service continuity through trained intervention and documented safe-stop procedures.
- Restraint: Network instability may interrupt video quality and control responsiveness during remote vehicle sessions. Uneven operating rules increase validation work across different jurisdictions.
- Opportunity: Ports and logistics yards offer controlled routes for early commercial programs using repeatable vehicle movements. Centralized supervision may extend skilled operator coverage across dispersed sites.
Germany’s remote-driving regulation is expected to convert local trials into licensed commercial programs serving public-road mobility operators. Vay reported in July 2025 recording over 17,000 Las Vegas trips, demonstrating operating evidence for remotely delivered mobility. Clear approval processes are anticipated to improve planning confidence across vehicle operators and technology providers.
International Telecommunication Union reported in November 2024 estimating 5G coverage at 51% of global population, exposing geographic limits for latency-sensitive supervision. Operators are projected to combine network redundancy with safe-stop procedures during coverage degradation. Reliable coverage is likely to remain uneven across cross-border routes and lower-density service zones.
Industrial sites are forecast to offer earlier operating paths through repeated routes and controlled access. Hitachi Construction Machinery Europe reported in July 2025 documenting one Teleo operator controlling 3 trucks from Munich across a Florida worksite, demonstrating long-distance supervision for production activity. Similar arrangements are anticipated to improve operator productivity across ports and yards.
How are country CAGRs aligned in vehicle teleoperation market?
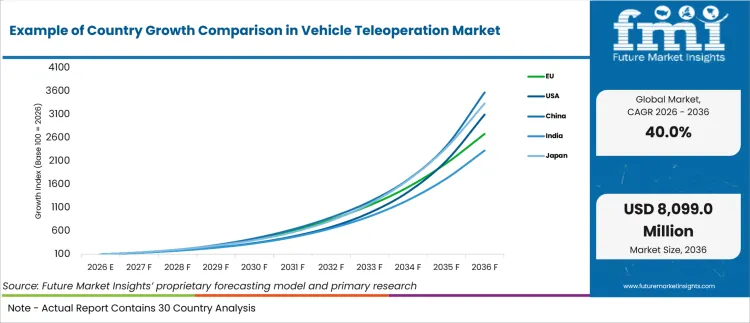
| Country or Market | CAGR |
|---|---|
| China | 43.0% |
| Japan | 42.0% |
| United States | 41.0% |
| European Union | 39.0% |
| India | 37.0% |
Source: Future Market Insights analysis, 2026.
How do country-level CAGRs compare in vehicle teleoperation market?
The country comparison shows a gradual step-down in growth across the markets covered. China and Japan sit at the upper end of the range. United States forms a closely positioned second tier. European Union follows with slightly lower growth. India remains at the lower end of the comparison. The six-point spread shows that these markets share a strong growth outlook, although their relative positions indicate different levels of market momentum. European Union figure represents a regional average, so individual member countries may record higher or lower growth.
- China and Japan lead the comparison and establish East Asia as the notable growth cluster among the markets shown.
- The United States follows closely, which indicates that it does not fall far behind the leading group.
- The European Union forms the next growth band and maintains a relatively small gap from the United States.
- India records the slowest growth among the listed markets, yet its forecast remains strong within the wider market context.
- The pattern resembles a gradual downward slope rather than a sharp separation between high-growth and low-growth markets.
Markets with broadly similar CAGRs can still present different entry conditions due to communications coverage and autonomous fleet readiness. The full report provides country-level analysis across North America, Latin America, Europe, East Asia, South Asia, Oceania and the Middle East and Africa.
Country-wise Analysis
- Vehicle teleoperation market in China is anticipated to rise at 43.0% CAGR from 2026 to 2036, backed by dense Robotaxi operations and network investment. Large urban fleets create recurring exception-handling needs across congested streets and mixed traffic. State Council of China reported in January 2026 recording 4.838 million 5G base stations during 2025, improving low-latency foundations for remote supervision.
- Ministry of Economy, Trade and Industry reported in June 2025 describing 3 remote-support requirement areas under ISO 7856, impacting structured equipment and communications assessment in Japan. Coordinated mobility programs provide operating evidence for control-room staffing and incident response. Adoption in Japan is projected to expand at 42.0% CAGR during the forecast period, guided by national mobility programs and structured safety review.
- State testing programs generate operating records for remote-response planning across public roads. United States activity is expected to progress at 41.0% CAGR during the study period, aided by commercial AV services and voluntary fallback investment. California Department of Motor Vehicles reported in February 2026 recording over 9 million autonomous test miles from December 1 2024 through November 30 2025, expanding the evidence for supervised fleet operations.
- European Union sales are forecast to progress at 39.0% CAGR from 2026 to 2036, helped by Germany’s dedicated remote-driving regulation. National approval differences encourage adaptable station procedures and locally documented safety controls. European Commission reported in August 2025 recording 94.3% household 5G coverage at year-end 2024, improving network foundations for connected vehicle programs.
- Press Information Bureau reported in December 2025 recording 508,000 5G base stations by October 31 2025, strengthening connectivity foundations for remote industrial vehicles. Controlled industrial sites provide practical settings for early AI in transportation trials. Vehicle teleoperation sector in India is estimated to scale at 37.0% CAGR during the assessment period, led by logistics pilots and improving cellular reach.
Who are notable companies in vehicle teleoperation market?
Vay supports public-road teledriving and remotely delivered vehicle services. Ottopia and DriveU.auto provide teleoperation software for automotive and industrial fleets. FERNRIDE and Einride serve logistics vehicles and freight operations. Elmo and TIER IV contribute remote-driving and fleet-supervision capabilities.
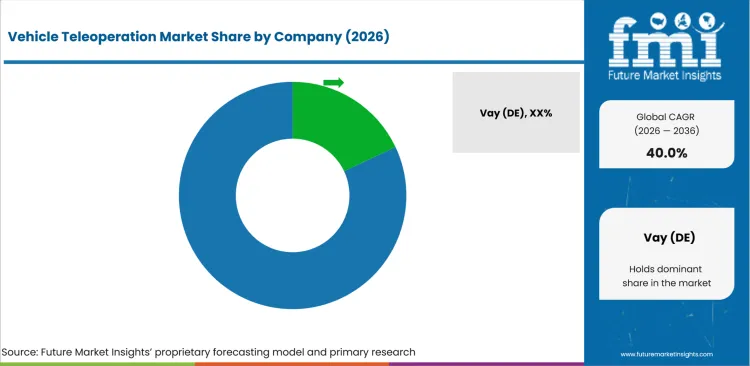
Vehicle teleoperation sector competition is anticipated to focus on safe handover and dependable connectivity. Fleet teams are likely to compare providers due to operating evidence and integration support. Vay and Elmo are expected to receive attention across public-road services. Ottopia and DriveU.auto are projected to support software-led automotive and industrial programs. FERNRIDE and Einride are anticipated to compete across ports and freight operations. Oxa and TIER IV are likely to strengthen autonomous fleet supervision.
- Vay and Elmo are expected to receive review attention across public-road remote-driving services. Fleet programs are likely to assess operator controls and safe-stop procedures.
- Ottopia and DriveU.auto are anticipated to compete based on software platforms supporting mixed vehicle fleets. Automotive teams are projected to compare integration effort and session continuity.
- FERNRIDE and Einride are forecast to support logistics vehicles across ports and freight facilities. Industrial operators are expected to value repeatable routes and centralized supervision.
- Oxa and TIER IV are likely to serve autonomous fleet and public-transit programs. Local engineering access is anticipated to influence validation and service response.
Competitive Benchmarking: Vehicle Teleoperation Market
| Company | Portfolio Depth | Vehicle Match | Service Support | Service Reach |
|---|---|---|---|---|
| Vay | High | High | High | Germany and United States |
| Ottopia | High | High | High | Israel and global |
| DriveU.auto | High | High | Medium | Israel and global |
| FERNRIDE | High | High | High | Germany and Europe |
| Elmo | Medium | High | Medium | Estonia and Europe |
| Einride | High | High | High | Sweden, Europe and United States |
| Oxa | High | High | High | United Kingdom and global |
| EasyMile | High | Medium | High | France and global |
| TIER IV | High | High | High | Japan and global |
| Aurrigo International plc | Medium | High | Medium | United Kingdom and global |
Source: Future Market Insights competitive analysis, 2026.
Key Developments in Vehicle Teleoperation Market
- In July 2025, FERNRIDE began driverless terminal-tractor operations at HHLA TK Estonia following TÜV SÜD certification. Certified transition extended human-assisted autonomy into live container movement, strengthening operating evidence for remote-supervised port logistics.
- In March 2026, Elmo and Upshift partnered to launch a remotely controlled car-subscription service in California. Elmo stated its road-legal teledriving platform would support doorstep delivery and remote vehicle repositioning without an onboard driver.
- In April 2026, DriveU.auto announced Ashdod Port investment following a live autonomous terminal-tractor proof of concept. Port operations cover approximately 80 terminal tractors, creating an operating base for retrofit and remote-support deployment.
Key Players in Vehicle Teleoperation Market
Public-road teledriving and vehicle delivery companies
- Vay
- Elmo
- Ottopia
- DriveU.auto
Logistics and industrial teleoperation specialists
- FERNRIDE
- Einride
- Teleo
- EasyMile
Autonomous fleet and remote-supervision providers
- Oxa
- TIER IV
- Aurrigo International plc
- Waymo
Vehicle Teleoperation Market Report Scope
| Coverage field | Report scope |
|---|---|
| Market breakdown | Vehicle teleoperation breakdown by technology, application, deployment, end-use, pricing model, and region. |
| Quantitative Units | USD million in 2026 to USD million by 2036 at a CAGR |
| Market Definition | Systems and services supporting remote driving, remote assistance, and centralized supervision of road or industrial vehicles. |
| Regions Covered | North America and Latin America beside Western Europe, Eastern Europe, East Asia, South Asia and Pacific, Middle East and Africa. |
| Countries Covered | United States, China, European Union, Japan, Russia, Canada, Brazil, Mexico, Germany, France, United Kingdom, Italy, Spain, Poland, India, ASEAN, Australia, New Zealand, GCC countries, South Africa and Türkiye. |
| Key Companies Profiled | Company profiles include Vay, Ottopia, DriveU.auto, FERNRIDE, Elmo, Einride, Oxa, EasyMile, TIER IV, and Aurrigo International plc. |
| Forecast Period | 2026 to 2036 |
| Approach | Supplied market values and segment shares are combined with primary interviews supporting forecast development. Desk research and evidence validation complete analysis across technology segments and profiled geographic areas. |
Source: Future Market Insights, 2026.
Vehicle Teleoperation Market - Research Methodology
| Method | Approach |
|---|---|
| Primary Research | FMI analysts gathered input from manufacturers, service providers, technology developers, distributors, end users, procurement teams, and subject-matter experts. Interviews examined purchasing decisions, product or service evaluation, adoption barriers, approval requirements, pricing considerations, and expectations for technical or commercial support. Respondents were also asked what evidence is required before a trial, pilot, or initial order develops into regular purchasing. |
| Desk Research | Desk research covered government statistics, regulatory publications, trade data, industry associations, technical literature, standards, company filings, product information, and official corporate announcements. Sources were reviewed for relevance, publication date, geographic coverage, and consistency with the defined market scope. Claims relating to performance, applications, approvals, capacity, investment, and commercial activity were retained only when supported by credible public evidence. |
| Market Sizing and Forecasting | The market model combined the baseline value with historical performance, segment structure, pricing and volume indicators, adoption levels, company participation, and country-level demand conditions. Forecast assumptions considered economic activity, investment trends, regulatory developments, technology adoption, purchasing cycles, supply availability, and barriers to wider market use. Segment and regional estimates were reconciled before the final market total was calculated. |
| Data Validation | Estimates were checked against multiple independent indicators, including public data, company activity, trade patterns, industry developments, and findings from primary interviews. Validation also tested whether products, services, applications, and company revenues fell within the defined market boundaries. Adjacent categories, unsupported claims, overlapping revenues, and activities without direct market relevance were excluded to reduce double counting and maintain consistency across segments and countries. |
Source: Future Market Insights analysis, 2026.
Vehicle Teleoperation Market by Segments
Vehicle Teleoperation Market segmented by Technology:
- Remote driving stations
- Remote assist software
- Connectivity and latency management
- Safety supervision AI
Vehicle Teleoperation Market segmented by Application:
- AV fleet fallback
- Logistics yards and hubs
- Rental and delivery repositioning
- Industrial vehicles
Vehicle Teleoperation Market segmented by Deployment:
- Cloud
- Hybrid
- On-premise
Vehicle Teleoperation Market segmented by End-use:
- AV operators
- Logistics fleets
- Car rental and sharing
- Public transit
Vehicle Teleoperation Market segmented by Pricing Model:
- SaaS
- Per-vehicle license
- Operations service
- Pilot programs
Vehicle Teleoperation Market segmented by Region:
- United States
- European Union
- China
- Japan
- India
Research Sources and Bibliography
- Vay Technology GmbH. (2026, March 26). In this edition: 50K trips, partnering with Nexar, events, and more!.
- National Highway Traffic Safety Administration. (2025, August 27). ITS World Congress plenary.
- Vay Technology GmbH. (2026, April 29). Vay accelerates Las Vegas growth with 175-vehicle fleet, new Remote Driving Center inside Zappos Campus, and partnership with Goodwrx.
- Waymo LLC. (2025, May 5). Scaling our fleet through USA manufacturing.
- International Telecommunication Union. (2025, November 17). Global number of Internet users increases, but disparities deepen key digital divides.
- Waymo LLC. (2025, December 10). Delivering more for our riders in a year of incredible growth.
- Elmo. (2025, March 3). Elmo pushes teledriving boundaries at Mobile World Congress with a record-breaking 3,400km remote drive.
- Vay Technology GmbH. (2025, July 28). Vay welcomes Germany’s remote driving regulation: A breakthrough in remote driving commercialization at scale.
- International Telecommunication Union. (2024, November 27). Global Internet use continues to rise but disparities remain, especially in low-income regions.
- Hitachi Construction Machinery (Europe) NV. (2025, July 9). Supervising multiple autonomous machines - from the comfort of an office.
- State Council of the People’s Republic of China. (2026, January 28). China’s 5G base stations top 4.83 million by end of 2025.
- Ministry of Economy, Trade and Industry. (2025, June 5). New international standard for remote support for low-speed automated driving systems issued based on contributions from Japan.
- California Department of Motor Vehicles. (2026, February 20). Autonomous vehicle permit holders in California logged more than 9 million test miles between December 1, 2024 and November 30, 2025.
- European Commission. (2025, August 12). 5G Observatory report 2025.
- Press Information Bureau. (2025, December 3). Hundred 5G labs established at academic institutions across India.
- FERNRIDE. (2025, July 10). FERNRIDE begins transition to driverless operations at HHLA TK Estonia following TÜV SÜD certification.
- Elmo. (2026, March 26). Elmo and Upshift partner to launch remote control car subscription service in California.
- DriveU.auto. (2026, April 14). DriveU.auto receives strategic investment from design partner Ashdod Port Company to accelerate autonomous terminal tractor development.
This bibliography is provided for reader reference and is not exhaustive. The full report contains the complete reference list and detailed citations.
This Report Answers
- How large is vehicle teleoperation during the forecast period?
- What influence does technology segmentation have on vehicle teleoperation selection?
- Why does AV fleet fallback influence application demand?
- How does cloud guide deployment decisions?
- What role does end-use activity have in commercial planning?
- Why does SaaS support pricing model use?
- How do country conditions influence expansion?
- Who competes across vehicle teleoperation programs?
- What restraints affect public-road deployment?
- Why do industrial sites create commercial opportunities?
Frequently Asked Questions
What supports demand in vehicle teleoperation market?
Autonomous fleet fallback is expected to support demand during blocked routes and unusual road events requiring human judgment. Logistics yards are anticipated to add controlled settings for remote vehicle supervision across repeatable industrial routes.
Who competes in vehicle teleoperation market?
Vay and Ottopia are projected to receive attention across public-road and automotive programs using remote intervention. DriveU.auto and FERNRIDE are likely to support industrial and logistics deployments across controlled operating sites.
How do network conditions restrain vehicle teleoperation market?
Network instability is expected to limit dependable video and control transfer across dispersed routes and changing coverage zones. Uneven operating rules are likely to increase validation work across public-road programs seeking commercial approval.
Why do executives track vehicle teleoperation market?
Executives are expected to track fleet continuity and staffing productivity across autonomous operations serving distributed geographic areas. Commercial review is likely to compare intervention performance with operating cost and documented safety evidence.
What business problem does vehicle teleoperation market solve?
Vehicle teleoperation is anticipated to resolve unusual events extending beyond autonomous system capability across public or industrial routes. Centralized operators are expected to restore movement without dispatching local staff to every disabled vehicle location.
How do account teams evaluate vendors prior to selection?
Account teams are projected to assess control latency and safe-stop behavior across operating conditions. Operating evidence and training support are likely to influence final vendor selection across multi-location fleet programs.
Why does return on investment face limits for purchasing teams?
Low intervention frequency may reduce station utilization across limited fleet deployments serving narrowly defined operating areas. Complex vehicle integration is expected to lengthen validation and raise program cost across mixed vehicle fleets.
How do vendors build long-term account confidence?
Vendors are anticipated to document handover performance and maintain dependable incident support across complete operating periods. Clear software updates and operator training are expected to strengthen account confidence across expanding commercial fleets.
Preview the report firsthand - request a free sample
Get SampleGet the brochure for pricing and purchase details.
Get PDFTable of Content
- Key Takeaways
- Market Size and CAGR
- Top Growth Driver
- Fastest Growing Segment
- Leading Region
- Key Companies
- Emerging Opportunities
- Executive Summary
- Global Market Outlook
- Demand-side Trends
- Supply-side Trends
- Technology Roadmap Analysis
- Analysis and Recommendations
- Analyst Perspective (What is happening? Why now? What should investors know?)
- Key Questions Answered
- How large is the market?
- What is the CAGR?
- What are key trends?
- Which region dominates?
- Who are the leaders?
- Market Overview
- Market Coverage / Taxonomy
- Market Definition / Scope / Limitations
- Research Methodology
- Chapter Orientation
- Analytical Lens and Working Hypotheses
- Market Structure, Signals, and Trend Drivers
- Benchmarking and Cross-market Comparability
- Market Sizing, Forecasting, and Opportunity Mapping
- Research Design and Evidence Framework
- Desk Research Programme (Secondary Evidence)
- Expert Input and Fieldwork (Primary Evidence)
- Tooling, Models, and Reference Databases
- Data Engineering and Model Build
- Quality Assurance and Audit Trail
- Market Background
- Market Dynamics (Drivers, Restraints, Opportunity, Trends)
- Scenario Forecast (Optimistic, Likely, Conservative)
- Impact Analysis
- AI Impact
- Sustainability Impact
- Regulatory Impact
- Technology Impact
- Consumer / Buyer Analysis
- Purchase Drivers
- Adoption Barriers
- Buyer Journey
- Opportunity Map Analysis
- Product Life Cycle Analysis
- Supply Chain Analysis
- Investment Feasibility Matrix
- Value Chain Analysis
- PESTLE and Porter's Analysis
- Regulatory Landscape
- Regional Parent Market Outlook
- Production and Consumption Statistics
- Import and Export Statistics
- Global Market Analysis and Forecast, 2021 to 2036
- Historical Market Size Value (USD Mn) Analysis, 2021 to 2025
- Current and Future Market Size Value (USD Mn) Projections, 2026 to 2036
- Y-o-Y Growth Trend Analysis
- Absolute $ Opportunity Analysis
- Global Market Pricing Analysis, 2021 to 2036
- Global Market Analysis and Forecast, By Technology, 2021 to 2036
- Introduction / Key Findings
- Historical Market Size Value (USD Mn) Analysis By Technology, 2021 to 2025
- Current and Future Market Size Value (USD Mn) Analysis and Forecast By Technology, 2026 to 2036
- Remote driving stations
- Remote assist software
- Connectivity & latency management
- Safety supervision AI
- Remote driving stations
- Y-o-Y Growth Trend Analysis By Technology, 2021 to 2025
- Absolute $ Opportunity Analysis By Technology, 2026 to 2036
- Global Market Analysis and Forecast, By Application, 2021 to 2036
- Introduction / Key Findings
- Historical Market Size Value (USD Mn) Analysis By Application, 2021 to 2025
- Current and Future Market Size Value (USD Mn) Analysis and Forecast By Application, 2026 to 2036
- AV fleet fallback
- Logistics yards & hubs
- Rental - delivery repositioning
- Industrial vehicles
- AV fleet fallback
- Y-o-Y Growth Trend Analysis By Application, 2021 to 2025
- Absolute $ Opportunity Analysis By Application, 2026 to 2036
- Global Market Analysis and Forecast, By Deployment, 2021 to 2036
- Introduction / Key Findings
- Historical Market Size Value (USD Mn) Analysis By Deployment, 2021 to 2025
- Current and Future Market Size Value (USD Mn) Analysis and Forecast By Deployment, 2026 to 2036
- Cloud
- Hybrid
- On-premise
- Cloud
- Y-o-Y Growth Trend Analysis By Deployment, 2021 to 2025
- Absolute $ Opportunity Analysis By Deployment, 2026 to 2036
- Global Market Analysis and Forecast, By End-use, 2021 to 2036
- Introduction / Key Findings
- Historical Market Size Value (USD Mn) Analysis By End-use, 2021 to 2025
- Current and Future Market Size Value (USD Mn) Analysis and Forecast By End-use, 2026 to 2036
- AV operators
- Logistics fleets
- Car rental & sharing
- Public transit
- AV operators
- Y-o-Y Growth Trend Analysis By End-use, 2021 to 2025
- Absolute $ Opportunity Analysis By End-use, 2026 to 2036
- Global Market Analysis and Forecast, By Pricing Model, 2021 to 2036
- Introduction / Key Findings
- Historical Market Size Value (USD Mn) Analysis By Pricing Model, 2021 to 2025
- Current and Future Market Size Value (USD Mn) Analysis and Forecast By Pricing Model, 2026 to 2036
- SaaS
- Per-vehicle license
- Operations service
- Pilot programs
- SaaS
- Y-o-Y Growth Trend Analysis By Pricing Model, 2021 to 2025
- Absolute $ Opportunity Analysis By Pricing Model, 2026 to 2036
- Global Market Analysis and Forecast, By Region, 2021 to 2036
- Introduction
- Historical Market Size Value (USD Mn) Analysis By Region, 2021 to 2025
- Current Market Size Value (USD Mn) Analysis and Forecast By Region, 2026 to 2036
- North America
- Latin America
- Western Europe
- Eastern Europe
- East Asia
- South Asia and Pacific
- Middle East & Africa
- Market Attractiveness Analysis By Region
- North America Market Analysis and Forecast, By Country, 2021 to 2036
- Historical Market Size Value (USD Mn) Trend Analysis By Market Taxonomy, 2021 to 2025
- Market Size Value (USD Mn) Forecast By Market Taxonomy, 2026 to 2036
- By Country
- USA
- Canada
- By Technology
- By Application
- By Deployment
- By End-use
- By Pricing Model
- By Country
- Market Attractiveness Analysis
- By Country
- By Technology
- By Application
- By Deployment
- By End-use
- By Pricing Model
- Key Takeaways
- Latin America Market Analysis and Forecast, By Country
- Historical Market Size Value (USD Mn) Trend Analysis By Market Taxonomy, 2021 to 2025
- Market Size Value (USD Mn) Forecast By Market Taxonomy, 2026 to 2036
- By Country
- Brazil
- Mexico
- Chile
- Rest of Latin America
- By Technology
- By Application
- By Deployment
- By End-use
- By Pricing Model
- By Country
- Market Attractiveness Analysis
- By Country
- By Technology
- By Application
- By Deployment
- By End-use
- By Pricing Model
- Key Takeaways
- Western Europe Market Analysis and Forecast, By Country
- Historical Market Size Value (USD Mn) Trend Analysis By Market Taxonomy, 2021 to 2025
- Market Size Value (USD Mn) Forecast By Market Taxonomy, 2026 to 2036
- By Country
- Germany
- UK
- Italy
- Spain
- France
- Nordic
- BENELUX
- Rest of Western Europe
- By Technology
- By Application
- By Deployment
- By End-use
- By Pricing Model
- By Country
- Market Attractiveness Analysis
- By Country
- By Technology
- By Application
- By Deployment
- By End-use
- By Pricing Model
- Key Takeaways
- Eastern Europe Market Analysis and Forecast, By Country
- Historical Market Size Value (USD Mn) Trend Analysis By Market Taxonomy, 2021 to 2025
- Market Size Value (USD Mn) Forecast By Market Taxonomy, 2026 to 2036
- By Country
- Russia
- Poland
- Hungary
- Balkan & Baltic
- Rest of Eastern Europe
- By Technology
- By Application
- By Deployment
- By End-use
- By Pricing Model
- By Country
- Market Attractiveness Analysis
- By Country
- By Technology
- By Application
- By Deployment
- By End-use
- By Pricing Model
- Key Takeaways
- East Asia Market Analysis and Forecast, By Country
- Historical Market Size Value (USD Mn) Trend Analysis By Market Taxonomy, 2021 to 2025
- Market Size Value (USD Mn) Forecast By Market Taxonomy, 2026 to 2036
- By Country
- China
- Japan
- South Korea
- By Technology
- By Application
- By Deployment
- By End-use
- By Pricing Model
- By Country
- Market Attractiveness Analysis
- By Country
- By Technology
- By Application
- By Deployment
- By End-use
- By Pricing Model
- Key Takeaways
- South Asia and Pacific Market Analysis and Forecast, By Country
- Historical Market Size Value (USD Mn) Trend Analysis By Market Taxonomy, 2021 to 2025
- Market Size Value (USD Mn) Forecast By Market Taxonomy, 2026 to 2036
- By Country
- India
- ASEAN
- Australia & New Zealand
- Rest of South Asia and Pacific
- By Technology
- By Application
- By Deployment
- By End-use
- By Pricing Model
- By Country
- Market Attractiveness Analysis
- By Country
- By Technology
- By Application
- By Deployment
- By End-use
- By Pricing Model
- Key Takeaways
- Middle East & Africa Market Analysis and Forecast, By Country
- Historical Market Size Value (USD Mn) Trend Analysis By Market Taxonomy, 2021 to 2025
- Market Size Value (USD Mn) Forecast By Market Taxonomy, 2026 to 2036
- By Country
- Kingdom of Saudi Arabia
- Other GCC Countries
- Türkiye
- South Africa
- Other African Union
- Rest of Middle East & Africa
- By Technology
- By Application
- By Deployment
- By End-use
- By Pricing Model
- By Country
- Market Attractiveness Analysis
- By Country
- By Technology
- By Application
- By Deployment
- By End-use
- By Pricing Model
- Key Takeaways
- Key Countries Market Analysis
- USA
- Pricing Analysis
- Market Share Analysis, 2025
- By Technology
- By Application
- By Deployment
- By End-use
- By Pricing Model
- Canada
- Pricing Analysis
- Market Share Analysis, 2025
- By Technology
- By Application
- By Deployment
- By End-use
- By Pricing Model
- Mexico
- Pricing Analysis
- Market Share Analysis, 2025
- By Technology
- By Application
- By Deployment
- By End-use
- By Pricing Model
- Brazil
- Pricing Analysis
- Market Share Analysis, 2025
- By Technology
- By Application
- By Deployment
- By End-use
- By Pricing Model
- Chile
- Pricing Analysis
- Market Share Analysis, 2025
- By Technology
- By Application
- By Deployment
- By End-use
- By Pricing Model
- Germany
- Pricing Analysis
- Market Share Analysis, 2025
- By Technology
- By Application
- By Deployment
- By End-use
- By Pricing Model
- UK
- Pricing Analysis
- Market Share Analysis, 2025
- By Technology
- By Application
- By Deployment
- By End-use
- By Pricing Model
- Italy
- Pricing Analysis
- Market Share Analysis, 2025
- By Technology
- By Application
- By Deployment
- By End-use
- By Pricing Model
- Spain
- Pricing Analysis
- Market Share Analysis, 2025
- By Technology
- By Application
- By Deployment
- By End-use
- By Pricing Model
- France
- Pricing Analysis
- Market Share Analysis, 2025
- By Technology
- By Application
- By Deployment
- By End-use
- By Pricing Model
- India
- Pricing Analysis
- Market Share Analysis, 2025
- By Technology
- By Application
- By Deployment
- By End-use
- By Pricing Model
- ASEAN
- Pricing Analysis
- Market Share Analysis, 2025
- By Technology
- By Application
- By Deployment
- By End-use
- By Pricing Model
- Australia & New Zealand
- Pricing Analysis
- Market Share Analysis, 2025
- By Technology
- By Application
- By Deployment
- By End-use
- By Pricing Model
- China
- Pricing Analysis
- Market Share Analysis, 2025
- By Technology
- By Application
- By Deployment
- By End-use
- By Pricing Model
- Japan
- Pricing Analysis
- Market Share Analysis, 2025
- By Technology
- By Application
- By Deployment
- By End-use
- By Pricing Model
- South Korea
- Pricing Analysis
- Market Share Analysis, 2025
- By Technology
- By Application
- By Deployment
- By End-use
- By Pricing Model
- Russia
- Pricing Analysis
- Market Share Analysis, 2025
- By Technology
- By Application
- By Deployment
- By End-use
- By Pricing Model
- Poland
- Pricing Analysis
- Market Share Analysis, 2025
- By Technology
- By Application
- By Deployment
- By End-use
- By Pricing Model
- Hungary
- Pricing Analysis
- Market Share Analysis, 2025
- By Technology
- By Application
- By Deployment
- By End-use
- By Pricing Model
- Kingdom of Saudi Arabia
- Pricing Analysis
- Market Share Analysis, 2025
- By Technology
- By Application
- By Deployment
- By End-use
- By Pricing Model
- Türkiye
- Pricing Analysis
- Market Share Analysis, 2025
- By Technology
- By Application
- By Deployment
- By End-use
- By Pricing Model
- South Africa
- Pricing Analysis
- Market Share Analysis, 2025
- By Technology
- By Application
- By Deployment
- By End-use
- By Pricing Model
- USA
- Market Structure Analysis
- Competition Dashboard
- Competition Benchmarking
- Market Share Analysis of Top Players
- By Regional
- By Technology
- By Application
- By Deployment
- By End-use
- By Pricing Model
- Emerging Startups
- Innovation Benchmarking
- Competition Analysis
- Competition Deep Dive
- Vay (DE)
- Overview
- Product Portfolio
- Profitability by Market Segments
- Sales Footprint
- Strategy Overview
- Marketing Strategy
- Product Strategy
- Channel Strategy
- Ottopia (IL)
- DriveU.auto (IL)
- Fernride (DE)
- Vay (DE)
- Case Studies
- Success Stories
- Recent Developments
- Competition Deep Dive
- Assumptions & Acronyms Used


