

- Market Size (2026)
- USD 800 Mn
- Forecast (2036)
- USD 2400 Mn
- CAGR (2026 to 2036)
- 11.5%
How big is Virtual Biopsy Market in 2026?
USD 800 million in 2026 and USD 2400 million by 2036 at an 11.5% CAGR.
Sales of virtual biopsy solutions are set to close 2026 at USD 800 million, with the market advancing at an 11.5% CAGR through 2036 to reach USD 2400 million. This trajectory reflects a shift already underway in oncology and radiology departments, where clinicians are treating non-invasive tissue characterization as a companion to, and in select cases a substitute for, physical biopsy procedures. The growth curve is steep but not linear across geographies or care settings, and understanding why requires looking past the topline number into what is actually pulling hospitals toward adoption and what continues to hold segments of the market back.
On the demand side, rising cancer incidence, patient preference for reduced procedural risk, and the maturing accuracy of radiomics and AI-assisted image analysis are the clearest pull factors. Oncology networks are increasingly comfortable using quantitative imaging to guide biopsy targeting and monitor treatment response, which shortens diagnostic timelines and reduces repeat invasive sampling. Counterbalancing this, regulatory documentation burdens tied to software lifecycle management, uneven scanner compatibility across hospital fleets, and reimbursement ambiguity in several markets continue to slow purchasing decisions, particularly among smaller or resource-constrained facilities.
Opportunity is concentrating around integration, vendors who can embed virtual biopsy tools directly into existing imaging and clinical decision support workflows are best positioned to convert interest into purchase orders. Segment-level activity spans imaging modality, application area, end-user type, and technology approach, each with distinct adoption curves. Regionally, North America leads on regulatory clarity and reimbursement infrastructure, while parts of Asia Pacific are emerging as high-growth territory on the back of expanding oncology care capacity.
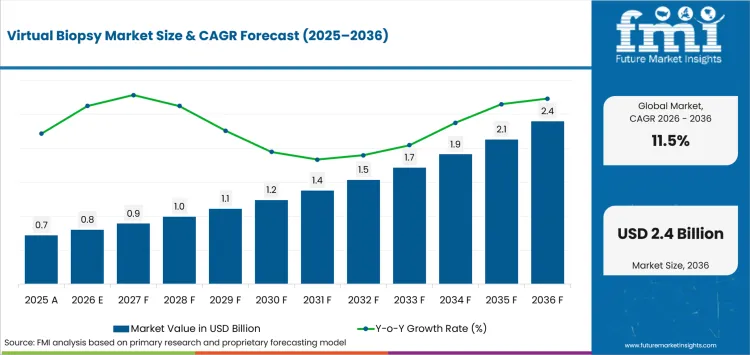
Key Takeaways of Virtual Biopsy Market
- Whole-lesion characterization supports biopsy targeting and treatment-response review through measurements drawn from complete medical images.
- Oncological disorders are projected to represent 52.0% of target therapeutic area demand in 2026 through tumor-focused imaging workflows.
- Magnetic resonance imaging is estimated to account for 38.0% of imaging technology demand in 2026 through multiparametric tissue assessment.
- Cancer diagnosis is forecast to capture 46.0% of application demand in 2026 through tumor detection and characterization requirements.
- Scanner variation and inconsistent acquisition protocols restrain adoption by weakening confidence in image features across clinical sites.
- Siemens Healthineers, GE HealthCare, Philips, Canon Medical, Fujifilm, Samsung Medison, Perspectum, and QUIBIM compete through imaging platforms and quantitative biomarkers.
Analyst Perspective
"Virtual biopsy earns clinical value through measurements that reflect disease instead of scanner protocol differences. Hospitals should connect each result to one decision and reject tools that fail reproducibility during follow-up."
- Anurag Sharma, Principal Consultant, Future Market Insights
How is the Virtual Biopsy Market segmented?
The virtual biopsy industry is segmented by target therapeutic area, cancer targeted, imaging technology, end user, application and region.
Target therapeutic area covers oncological, neurological, cardiovascular, and gastrointestinal disorders across organ-specific diagnosis and monitoring pathways. Cancer targeted includes solid malignancies plus breast, lung, and prostate cancer while imaging technology covers MRI, CT, ultrasound, and X-ray. End users include hospitals and clinics, research institutes and diagnostic centers, and other end users while applications cover cancer diagnosis, disease monitoring, personalized medicine, and early disease detection.
Why do oncological disorders lead the target therapeutic area category?
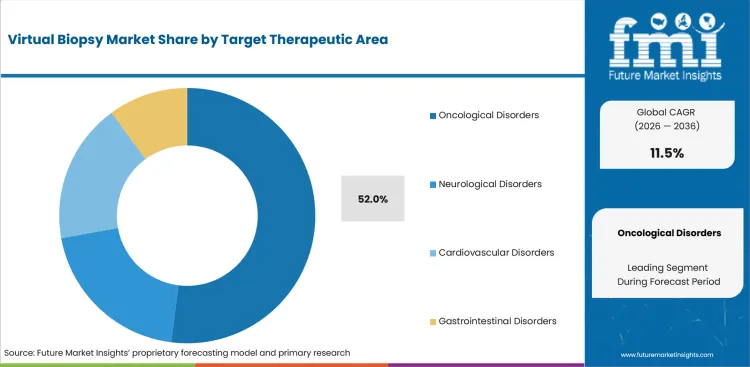
Oncology requires whole-lesion assessment as one tissue sample represents a limited location within a heterogeneous tumor during diagnosis and response monitoring. Precision cancer imaging compares spatial variation across repeated examinations without adding an invasive procedure for every clinical review.
- The target therapeutic area category is forecast to be led by oncological disorders at 52.0% share in 2026 due to tumor-focused diagnosis and monitoring across specialist services.
- Cancer centers expand use once multi-site validation confirms stable output across scanner models and representative patient groups. Clinical teams need explicit rules that connect quantitative results with cancer diagnosis or treatment planning.
Why do solid malignancies lead the cancer targeted category?
Solid tumors show measurable variation in morphology and perfusion within one mass or across several lesions. In November 2025 QUIBIM launched an oncology platform that connected prostate image acquisition with lesion review and follow-up reporting. The integrated workflow gives oncology teams a route for preserving lesion context across repeated examinations.
- Solid malignancies are set to lead the cancer targeted category with 31.0% share in 2026 due to whole-tumor characterization across imaging pathways.
- Oncology departments select oncology imaging software that preserves measurements across follow-up studies and routine reporting. Unstable reconstruction or segmentation can weaken comparisons between treatment reviews and reduce confidence in targeted sampling decisions.
Why does MRI lead the imaging technology category?
Magnetic resonance imaging combines structural and functional sequences for detailed soft-tissue assessment without ionizing radiation during repeated examinations. Multiparametric protocols measure diffusion and related tissue properties while preserving anatomical context for specialist interpretation.
- By imaging technology, MRI is forecast to represent 38.0% in 2026 driven by multiparametric and diffusion-weighted workflows across hospital oncology applications.
- Radiology teams test quantitative models through algorithm validation platforms during deployment planning across mixed scanner fleets. In February 2026 Siemens Healthineers and Mayo Clinic expanded collaboration on AI-enabled MRI protocols intended to minimize prostate biopsies. The collaboration links protocol development with a defined clinical decision instead of a stand-alone image score.
Why do hospitals and clinics lead the end user category?
Hospitals control scanner access and specialist interpretation alongside multidisciplinary review and treatment decisions throughout the clinical pathway. Their deployment process also covers cybersecurity ownership with integration and post-market monitoring across departments and clinical sites.
- Hospitals and clinics are projected to hold 51.0% share in 2026 owing to tertiary-care capacity and specialist imaging infrastructure across regional clinical pathways.
- Deployment advances once virtual biopsy output enters radiology information systems without duplicate data entry or separate review queues. Financial approval remains difficult unless clinical teams demonstrate a named decision change or reduced procedure burden during routine purchasing reviews.
What are the drivers, restraints and opportunities in the Virtual Biopsy Market?
Driver: Whole-lesion analysis supports diagnosis without sampling every disease site. Restraint: Scanner hardware and inconsistent protocols can destabilize quantitative features across hospitals. Opportunity: Harmonized acquisition and automated checks can support longitudinal biomarkers across clinical networks.
- Driver: Radiologists compare image-derived phenotypes across repeated examinations to decide whether another tissue sample would change patient management.
- Restraint: Reconstruction differences and inconsistent segmentation can change model output across scanners serving the same clinical pathway.
- Opportunity: Standardized acquisition protocols can support comparable longitudinal biomarkers across hospital networks and multi-site clinical research.
Radiologists compare image-derived phenotypes with digital pathology during validation programs that test the value of repeated tissue sampling. Demand strengthens once a measurement answers a defined diagnostic or treatment-response question across serial examinations.
Scanner hardware and reconstruction choices can alter radiomic features within the same disease pathway across clinical sites. Developers need representative validation data and controlled update plans for every hospital software deployment environment.
Harmonized MRI and computed tomography protocols give hospital networks comparable longitudinal measurements across repeated examinations. Automated acquisition checks and consistent segmentation reduce unusable studies while protecting confidence in each reported biomarker.
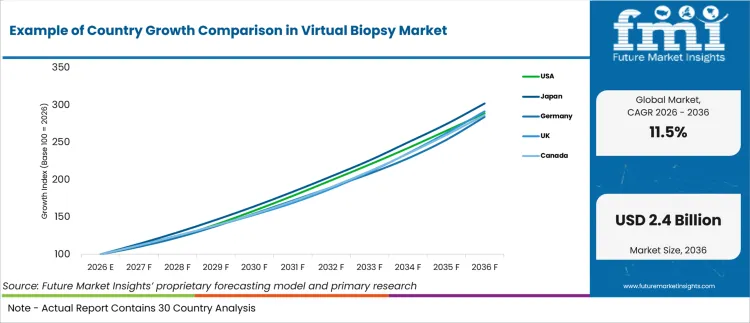
Which country CAGRs are profiled in the Virtual Biopsy Market?
| Country | CAGR |
|---|---|
| South Korea | 12.4% |
| Japan | 11.7% |
| Australia | 11.5% |
| United Kingdom | 11.3% |
| United States | 11.2% |
How do country-level CAGRs compare in the Virtual Biopsy Market?
The displayed CAGRs span 1.2 percentage points across countries facing similar software-validation pressures and different commercial conditions.
CAGR variation describes expected expansion without representing current market size or installed adoption in each country.
- South Korea differs through joint clinical-trial principles that provide a defined evidence route for machine-learning medical devices.
- Japan and Australia form a close group although consultation systems and sponsor obligations create different implementation requirements.
- The United Kingdom connects regulatory sandbox learning with NHS pathway assessment across hospital trusts and specialist services.
- The United States supports broad multi-site evaluation although health systems apply separate cybersecurity and integration reviews.
Comparable CAGRs can produce different market entry conditions across regulatory systems and hospital purchasing environments. The full report provides country-level CAGR analysis across North America, Latin America, Europe, East Asia, South Asia and Pacific, and the Middle East and Africa.
Country-wise Analysis
- South Korean developers work through a defined medical-device pathway that supports local clinical study planning for machine-learning diagnostic software and structured evidence submission. In December 2024 MFDS and Singapore’s HSA published joint principles for clinical trials involving machine-learning medical devices across regulated diagnostic studies and participating institutions. South Korea is estimated to post 12.4% CAGR over the forecast period, supported by domestic engineering capacity and clearer expectations for clinical-study design. Major academic hospitals provide specialist training and integration support although Korean patient validation and mixed scanner fleets complicate dependable maintenance coverage across regional care networks outside Seoul and other major centers.
- Japanese imaging developers use a consultation system that supports software classification and approval planning across local deployment programs that require clinical performance documentation and accountable sponsor support. PMDA released updated SaMD seminar materials on March 17, 2025 covering consultation routes and approval review for developers and manufacturers. Adoption of virtual biopsy in Japan is estimated to expand at 11.7% CAGR through 2036, reinforced by established imaging manufacturers and hospital engineering networks. Established engineering networks support equipment servicing and specialist training although Japanese-language workflows and domestic protocol evidence remain necessary across installed scanner generations and regional hospital systems during routine service planning.
- Australian sponsors need national registration for regulated medical-device software supplied to public and private hospital imaging networks under a stated intended purpose and accountable local sponsorship. The TGA clarified manufacturer and sponsor responsibilities for AI-enabled medical-device software in updated guidance dated February 5, 2026. The Australian virtual biopsy sector is projected to record 11.5% CAGR during the assessment period, shaped by concentrated metropolitan imaging networks and specialist trial capacity. Public hospital groups support multi-site evaluation although long service distances require dependable maintenance training and cybersecurity support for regional facilities beyond major coastal centers with smaller engineering teams and specialist staffing.
- United Kingdom developers can combine regulatory engagement with NHS pathway evaluation during the introduction of AI-enabled imaging software across hospital trusts and specialist diagnostic services and local commissioning decisions. The MHRA published its second AI Airlock report on June 9, 2026 with seven case studies from real-world medical-device scenarios that identified regulatory and technical lessons. Virtual biopsy sales in the United Kingdom are forecast to expand at 11.3% CAGR by 2036, aided by coordinated imaging networks and national clinical evaluation programs. National evaluation programs support evidence development although separate trust-level data governance and integration reviews can extend purchasing timelines across existing hospital infrastructure.
- United States health systems provide large multi-site imaging networks that support external validation across diverse scanners and patient populations across academic and community facilities ahead of scaled purchasing. In August 2025 the FDA finalized recommendations for predetermined change control plans covering planned updates to AI-enabled device software functions. Virtual biopsy demand in the United States is forecast to rise at 11.2% CAGR over the forecast period, driven by academic evaluation capacity and specialist training. Independent hospital groups offer broad clinical datasets although separate cybersecurity reviews and integration requirements can delay deployment across regional networks and specialty centers with different purchasing systems.
Who are the notable companies in the Virtual Biopsy Market?
Siemens Healthineers AG, GE HealthCare Technologies Inc., Koninklijke Philips N.V., Canon Medical Systems Corporation, Fujifilm Holdings Corporation, Samsung Medison Co., Ltd., Perspectum Ltd. and QUIBIM S.L. are the notable companies serving this market.
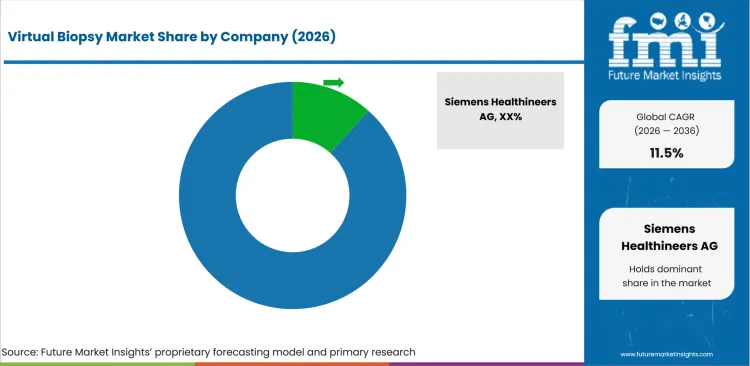
The market is concentrated among global imaging groups at the acquisition-platform level and more fragmented among organ-specific biomarker developers. Entry requires regulated software evidence plus multi-site reproducibility and hospital integration across existing radiology systems, limiting participation by general-purpose analytics companies.
- Siemens Healthineers AG, GE HealthCare Technologies Inc. and Koninklijke Philips N.V. compete through broad MRI and CT platforms with enterprise service coverage.
- Canon Medical Systems Corporation, Fujifilm Holdings Corporation and Samsung Medison Co., Ltd. compete through imaging hardware, workflow software and modality-specific clinical support.
- Perspectum Ltd. and QUIBIM S.L. compete through quantitative biomarkers and disease-specific software linked to liver or prostate imaging decisions.
Competitive Benchmarking: Virtual Biopsy Market
| Company | Imaging Platform Breadth | Quantitative Biomarker Capability | Clinical Validation and Workflow Support | Geographic Reach |
|---|---|---|---|---|
| Siemens Healthineers AG | High | High | High | Global |
| GE HealthCare Technologies Inc. | High | High | Medium | Global |
| Koninklijke Philips N.V. | High | High | Medium | Global |
| Canon Medical Systems Corporation | High | Medium | Medium | Global |
| Fujifilm Holdings Corporation | High | Medium | Medium | Global |
| Samsung Medison Co., Ltd. | Medium | Medium | Medium | Global |
| Perspectum Ltd. | Low | High | High | North America and Europe |
| QUIBIM S.L. | Low | High | High | Global |
Key Developments in the Virtual Biopsy Market
- In April 2026, Koninklijke Philips N.V. received USA FDA 510(k) clearance for Verida spectral CT, which provides conventional and spectral results from one acquisition for tissue characterization.
- In March 2026, GE HealthCare Technologies Inc. received USA FDA 510(k) clearance for Photonova Spectra photon-counting CT, supporting energy-resolved tissue analysis and spectral biomarker research.
- In February 2026, Siemens Healthineers AG expanded its Mayo Clinic collaboration to study AI-enabled MRI pathways intended to reduce unnecessary prostate biopsies and improve patient monitoring.
Virtual Biopsy Market - Report Scope
| Coverage field | Report scope |
|---|---|
| Market breakdown | By target therapeutic area, cancer targeted, imaging technology, end user, application and region. |
| Quantitative Units | Revenue in USD Millions and CAGR in %. |
| Market Definition | Virtual biopsy software uses quantitative imaging and AI-assisted analysis to characterize tissue across clinical workflows. |
| Regions Covered | North America, Latin America, Europe, East Asia, South Asia and Pacific and Middle East and Africa. |
| Countries Covered | South Korea, Japan, Australia, United Kingdom and United States. |
| Key Companies Profiled | Siemens Healthineers AG, GE HealthCare Technologies Inc., Koninklijke Philips N.V., Canon Medical Systems Corporation, Fujifilm Holdings Corporation, Samsung Medison Co., Ltd., Perspectum Ltd. and QUIBIM S.L. |
| Forecast Period | 2026 to 2036. |
| Approach | Primary and secondary research with market triangulation. |
Virtual Biopsy Market - Research Methodology
| Method | Approach |
|---|---|
| Primary Research | FMI analysts gathered input from manufacturers, service providers, technology developers, distributors, end users, procurement teams, and subject-matter experts. Interviews examined purchasing decisions, product or service evaluation, adoption barriers, approval requirements, pricing considerations, and expectations for technical or commercial support. Respondents were also asked what evidence is required before a trial, pilot, or initial order develops into regular purchasing. |
| Desk Research | Desk research covered government statistics, regulatory publications, trade data, industry associations, technical literature, standards, company filings, product information, and official corporate announcements. Sources were reviewed for relevance, publication date, geographic coverage, and consistency with the defined market scope. Claims relating to performance, applications, approvals, capacity, investment, and commercial activity were retained only when supported by credible public evidence. |
| Market Sizing and Forecasting | The market model combined the baseline value with historical performance, segment structure, pricing and volume indicators, adoption levels, company participation, and country-level demand conditions. Forecast assumptions considered economic activity, investment trends, regulatory developments, technology adoption, purchasing cycles, supply availability, and barriers to wider market use. Segment and regional estimates were reconciled before the final market total was calculated. |
| Data Validation | Estimates were checked against multiple independent indicators, including public data, company activity, trade patterns, industry developments, and findings from primary interviews. Validation also tested whether products, services, applications, and company revenues fell within the defined market boundaries. Adjacent categories, unsupported claims, overlapping revenues, and activities without direct market relevance were excluded to reduce double counting and maintain consistency across segments and countries. |
Virtual Biopsy Market by Segments
Virtual Biopsy Market segmented by Target Therapeutic Area:
- Oncological Disorders
- Breast Cancer
- Lung Cancer
- Neurological Disorders
- Brain Tumors
- Neurodegenerative Disorders
- Cardiovascular Disorders
- Cardiac Disease
- Vascular Disorders
- Gastrointestinal Disorders
- Liver Disease
- Gastrointestinal Tumors
Virtual Biopsy Market segmented by Cancer Targeted:
- Solid Malignancies
- Tumor Characterization
- Tumor Heterogeneity Analysis
- Breast Cancer
- Breast Tumor Detection
- Breast Lesion Characterization
- Lung Cancer
- Lung Nodule Analysis
- Lung Tumor Characterization
- Prostate Cancer
- Prostate Tumor Detection
- Prostate Tissue Characterization
Virtual Biopsy Market segmented by Imaging Technology:
- Magnetic Resonance Imaging (MRI)
- Multiparametric MRI
- Diffusion-Weighted MRI
- Computed Tomography (CT)
- High-Resolution CT
- Contrast-Enhanced CT
- Ultrasound
- Contrast-Enhanced Ultrasound
- Elastography
- X-Ray
- Digital X-Ray
- Advanced X-Ray Imaging
Virtual Biopsy Market segmented by End User:
- Hospitals & Clinics
- Tertiary Care Hospitals
- Specialty Clinics
- Research Institutes & Diagnostic Centers
- Research Institutes
- Diagnostic Imaging Centers
- Other End Users
- Academic Institutions
- Specialized Medical Centers
Virtual Biopsy Market segmented by Application:
- Cancer Diagnosis
- Tumor Detection
- Tumor Characterization
- Disease Monitoring
- Treatment Response Monitoring
- Disease Progression Assessment
- Personalized Medicine
- Patient Stratification
- Therapy Selection
- Early Disease Detection
- Screening
- Risk Assessment
Virtual Biopsy Market by Region:
- North America
- United States
- Canada
- Latin America
- Brazil
- Chile
- Mexico
- Rest of Latin America
- Western Europe
- Germany
- United Kingdom
- Italy
- Spain
- France
- Nordics
- Benelux
- Rest of Western Europe
- Eastern Europe
- Russia
- Poland
- Hungary
- Balkan and Baltic States
- Rest of Eastern Europe
- East Asia
- China
- Japan
- South Korea
- South Asia and Pacific
- India
- ASEAN
- Australia and New Zealand
- Rest of South Asia and Pacific
- Middle East and Africa
- Kingdom of Saudi Arabia
- Other GCC Countries
- Türkiye
- South Africa
- Other African Union Countries
- Rest of Middle East and Africa
Research Sources and Bibliography
- USA Food and Drug Administration. (2025, January 6). FDA Issues Comprehensive Draft Guidance for Developers of Artificial Intelligence-Enabled Medical Devices.
- QUIBIM S.L. (2025, November 21). Quibim Unveils Next-Generation Oncology Ecosystem Platform at RSNA 2025.
- Siemens Healthineers AG. (2026, February 12). Siemens Healthineers and Mayo Clinic Expand Strategic Collaboration to Enhance Patient Care Through Advanced Technology.
- Ministry of Food and Drug Safety. (2024, December 11). Guiding Principles for conducting Clinical Trial for Machine Learning-enabled MDs.
- Pharmaceuticals and Medical Devices Agency. (2025, March 17). Software as a Medical Device (SaMD).
- Therapeutic Goods Administration. (2026, February 5). Artificial intelligence (AI) and medical device software regulation.
- Medicines and Healthcare products Regulatory Agency. (2026, June 9). AI Airlock Sandbox Phase 2 Programme Report.
- USA Food and Drug Administration. (2025, August). Marketing Submission Recommendations for a Predetermined Change Control Plan for Artificial Intelligence-Enabled Device Software Functions.
- GE HealthCare Technologies Inc. (2026, March 23). GE HealthCare’s Photonova Spectra photon-counting CT receives FDA clearance.
- Koninklijke Philips N.V. (2026, April 16). Philips receives FDA 510(k) clearance for Verida, the world’s first AI-powered detector-based spectral CT*, advancing diagnostic precision across clinical applications.
- Canon Medical Systems Corporation. (2026, April 9).
- FUJIFILM Healthcare Americas Corporation. (2025, May 12). Fujifilm Strengthens Partnership with the National Rural Health Association to Improve Access to Medical Imaging in Rural Communities.
- Samsung Electronics Co., Ltd. (2025, December 1). Samsung Introduces R20 Ultrasound System, Elevating Imaging Performance and Precision at RSNA 2025.
- Perspectum Ltd. (2025, March 18). New Multinational Study Shows MRI is Cost-Effective in the Diagnosis and Management of Steatotic Liver Disease.
- QUIBIM S.L. (2025, June 26). Quibim Enhances Flagship QP Prostate® Product with The Launch of AI-QUAL™: Industry-First AI Tool for Automated Prostate MRI Image Quality Assessment Based on PI-QUAL.
This bibliography is provided for reader reference and is not exhaustive. The full report contains the complete reference list and detailed citations.
This Report Answers
- How large is the virtual biopsy market in 2026 and 2036?
- Which clinical mechanisms support non-invasive tissue characterization across virtual biopsy workflows?
- Which target therapeutic area accounts for the significant share during 2026?
- How does imaging technology shape virtual biopsy deployment across hospital networks?
- Which operating conditions limit reproducibility across scanners and clinical sites?
- How do profiled country growth rates differ through the 2036 forecast?
- Which companies support quantitative imaging and non-invasive biomarker workflows?
- What evidence requirements shape regulated virtual biopsy adoption across hospitals?
Frequently Asked Questions
How big is the virtual biopsy market in 2026?
The virtual biopsy market is estimated at USD 800 million in 2026 and forecast at USD 2400 million by 2036. Hospital adoption depends on reproducible measurements that support defined diagnostic or monitoring decisions across routine clinical pathways.
What is the CAGR of the virtual biopsy market from 2026 to 2036?
The virtual biopsy market is projected to expand at 11.5% CAGR between 2026 and 2036. Growth depends on multi-site validation and controlled updates that preserve measurements across scanner models and clinical networks.
Which target therapeutic area is projected to account for 52.0% of the virtual biopsy market?
Oncological disorders are projected to account for 52.0% of target therapeutic area demand in 2026. Whole-lesion characterization supports oncology workflows although hospitals require stable biomarkers across representative patients and scanner configurations.
Which imaging technology is projected to account for 38.0% of the virtual biopsy market?
MRI is projected to account for 38.0% of total imaging technology demand in 2026. Multiparametric sequences support tissue characterization although hospitals need harmonized acquisition and reconstruction protocols across scanner models and clinical sites.
Which end-user segment is projected to account for 51.0% of the virtual biopsy market?
Hospitals and clinics are projected to account for 51.0% of end-user demand in 2026. Their position reflects control of scanners and specialist interpretation with responsibility for integration and post-market monitoring across clinical departments.
Which companies are active in the virtual biopsy market?
Active virtual biopsy companies include Siemens Healthineers and GE HealthCare with Philips and Canon Medical. Fujifilm and Samsung Medison provide imaging platforms while Perspectum and QUIBIM focus on quantitative biomarkers and disease-specific workflows.
Preview the report firsthand - request a free sample
Get SampleGet the brochure for pricing and purchase details.
Get PDFTable of Content
- Key Takeaways
- Market Size and CAGR
- Top Growth Driver
- Fastest Growing Segment
- Leading Region
- Key Companies
- Emerging Opportunities
- Executive Summary
- Global Market Outlook
- Demand-side Trends
- Supply-side Trends
- Technology Roadmap Analysis
- Analysis and Recommendations
- Analyst Perspective (What is happening? Why now? What should investors know?)
- Key Questions Answered
- How large is the market?
- What is the CAGR?
- What are key trends?
- Which region dominates?
- Who are the leaders?
- Market Overview
- Market Coverage / Taxonomy
- Market Definition / Scope / Limitations
- Research Methodology
- Chapter Orientation
- Analytical Lens and Working Hypotheses
- Market Structure, Signals, and Trend Drivers
- Benchmarking and Cross-market Comparability
- Market Sizing, Forecasting, and Opportunity Mapping
- Research Design and Evidence Framework
- Desk Research Programme (Secondary Evidence)
- Expert Input and Fieldwork (Primary Evidence)
- Tooling, Models, and Reference Databases
- Data Engineering and Model Build
- Quality Assurance and Audit Trail
- Market Background
- Market Dynamics (Drivers, Restraints, Opportunity, Trends)
- Scenario Forecast (Optimistic, Likely, Conservative)
- Impact Analysis
- AI Impact
- Sustainability Impact
- Regulatory Impact
- Technology Impact
- Consumer / Buyer Analysis
- Purchase Drivers
- Adoption Barriers
- Buyer Journey
- Opportunity Map Analysis
- Product Life Cycle Analysis
- Supply Chain Analysis
- Investment Feasibility Matrix
- Value Chain Analysis
- PESTLE and Porter's Analysis
- Regulatory Landscape
- Regional Parent Market Outlook
- Production and Consumption Statistics
- Import and Export Statistics
- Global Market Analysis and Forecast, 2021 to 2036
- Historical Market Size Value (USD Billion) Analysis, 2021 to 2025
- Current and Future Market Size Value (USD Billion) Projections, 2026 to 2036
- Y-o-Y Growth Trend Analysis
- Absolute $ Opportunity Analysis
- Global Market Pricing Analysis, 2021 to 2036
- Global Market Analysis and Forecast, By Target Therapeutic Area, 2021 to 2036
- Introduction / Key Findings
- Historical Market Size Value (USD Billion) Analysis By Target Therapeutic Area, 2021 to 2025
- Current and Future Market Size Value (USD Billion) Analysis and Forecast By Target Therapeutic Area, 2026 to 2036
- Oncological Disorders
- Breast Cancer
- Lung Cancer
- Neurological Disorders
- Brain Tumors
- Neurodegenerative Disorders
- Cardiovascular Disorders
- Cardiac Disease
- Vascular Disorders
- Gastrointestinal Disorders
- Liver Disease
- Gastrointestinal Tumors
- Oncological Disorders
- Y-o-Y Growth Trend Analysis By Target Therapeutic Area, 2021 to 2025
- Absolute $ Opportunity Analysis By Target Therapeutic Area, 2026 to 2036
- Global Market Analysis and Forecast, By Cancer Targeted, 2021 to 2036
- Introduction / Key Findings
- Historical Market Size Value (USD Billion) Analysis By Cancer Targeted, 2021 to 2025
- Current and Future Market Size Value (USD Billion) Analysis and Forecast By Cancer Targeted, 2026 to 2036
- Solid Malignancies
- Tumor Characterization
- Tumor Heterogeneity Analysis
- Breast Cancer
- Breast Tumor Detection
- Breast Lesion Characterization
- Lung Cancer
- Lung Nodule Analysis
- Lung Tumor Characterization
- Prostate Cancer
- Prostate Tumor Detection
- Prostate Tissue Characterization
- Solid Malignancies
- Y-o-Y Growth Trend Analysis By Cancer Targeted, 2021 to 2025
- Absolute $ Opportunity Analysis By Cancer Targeted, 2026 to 2036
- Global Market Analysis and Forecast, By Imaging Technology, 2021 to 2036
- Introduction / Key Findings
- Historical Market Size Value (USD Billion) Analysis By Imaging Technology, 2021 to 2025
- Current and Future Market Size Value (USD Billion) Analysis and Forecast By Imaging Technology, 2026 to 2036
- Magnetic Resonance Imaging (MRI)
- Multiparametric MRI
- Diffusion-Weighted MRI
- Computed Tomography (CT)
- High-Resolution CT
- Contrast-Enhanced CT
- Ultrasound
- Contrast-Enhanced Ultrasound
- Elastography
- X-Ray
- Digital X-Ray
- Advanced X-Ray Imaging
- Magnetic Resonance Imaging (MRI)
- Y-o-Y Growth Trend Analysis By Imaging Technology, 2021 to 2025
- Absolute $ Opportunity Analysis By Imaging Technology, 2026 to 2036
- Global Market Analysis and Forecast, By End User, 2021 to 2036
- Introduction / Key Findings
- Historical Market Size Value (USD Billion) Analysis By End User, 2021 to 2025
- Current and Future Market Size Value (USD Billion) Analysis and Forecast By End User, 2026 to 2036
- Hospitals & Clinics
- Tertiary Care Hospitals
- Specialty Clinics
- Research Institutes & Diagnostic Centers
- Research Institutes
- Diagnostic Imaging Centers
- Other End Users
- Academic Institutions
- Specialized Medical Centers
- Hospitals & Clinics
- Y-o-Y Growth Trend Analysis By End User, 2021 to 2025
- Absolute $ Opportunity Analysis By End User, 2026 to 2036
- Global Market Analysis and Forecast, By Application, 2021 to 2036
- Introduction / Key Findings
- Historical Market Size Value (USD Billion) Analysis By Application, 2021 to 2025
- Current and Future Market Size Value (USD Billion) Analysis and Forecast By Application, 2026 to 2036
- Cancer Diagnosis
- Tumor Detection
- Tumor Characterization
- Disease Monitoring
- Treatment Response Monitoring
- Disease Progression Assessment
- Personalized Medicine
- Patient Stratification
- Therapy Selection
- Early Disease Detection
- Screening
- Risk Assessment
- Cancer Diagnosis
- Y-o-Y Growth Trend Analysis By Application, 2021 to 2025
- Absolute $ Opportunity Analysis By Application, 2026 to 2036
- Global Market Analysis and Forecast, By Region, 2021 to 2036
- Introduction
- Historical Market Size Value (USD Billion) Analysis By Region, 2021 to 2025
- Current Market Size Value (USD Billion) Analysis and Forecast By Region, 2026 to 2036
- North America
- Latin America
- Western Europe
- Eastern Europe
- East Asia
- South Asia and Pacific
- Middle East & Africa
- Market Attractiveness Analysis By Region
- North America Market Analysis and Forecast, By Country, 2021 to 2036
- Historical Market Size Value (USD Billion) Trend Analysis By Market Taxonomy, 2021 to 2025
- Market Size Value (USD Billion) Forecast By Market Taxonomy, 2026 to 2036
- By Country
- USA
- Canada
- By Target Therapeutic Area
- By Cancer Targeted
- By Imaging Technology
- By End User
- By Application
- By Country
- Market Attractiveness Analysis
- By Country
- By Target Therapeutic Area
- By Cancer Targeted
- By Imaging Technology
- By End User
- By Application
- Key Takeaways
- Latin America Market Analysis and Forecast, By Country
- Historical Market Size Value (USD Billion) Trend Analysis By Market Taxonomy, 2021 to 2025
- Market Size Value (USD Billion) Forecast By Market Taxonomy, 2026 to 2036
- By Country
- Brazil
- Mexico
- Chile
- Rest of Latin America
- By Target Therapeutic Area
- By Cancer Targeted
- By Imaging Technology
- By End User
- By Application
- By Country
- Market Attractiveness Analysis
- By Country
- By Target Therapeutic Area
- By Cancer Targeted
- By Imaging Technology
- By End User
- By Application
- Key Takeaways
- Western Europe Market Analysis and Forecast, By Country
- Historical Market Size Value (USD Billion) Trend Analysis By Market Taxonomy, 2021 to 2025
- Market Size Value (USD Billion) Forecast By Market Taxonomy, 2026 to 2036
- By Country
- Germany
- UK
- Italy
- Spain
- France
- Nordic
- BENELUX
- Rest of Western Europe
- By Target Therapeutic Area
- By Cancer Targeted
- By Imaging Technology
- By End User
- By Application
- By Country
- Market Attractiveness Analysis
- By Country
- By Target Therapeutic Area
- By Cancer Targeted
- By Imaging Technology
- By End User
- By Application
- Key Takeaways
- Eastern Europe Market Analysis and Forecast, By Country
- Historical Market Size Value (USD Billion) Trend Analysis By Market Taxonomy, 2021 to 2025
- Market Size Value (USD Billion) Forecast By Market Taxonomy, 2026 to 2036
- By Country
- Russia
- Poland
- Hungary
- Balkan & Baltic
- Rest of Eastern Europe
- By Target Therapeutic Area
- By Cancer Targeted
- By Imaging Technology
- By End User
- By Application
- By Country
- Market Attractiveness Analysis
- By Country
- By Target Therapeutic Area
- By Cancer Targeted
- By Imaging Technology
- By End User
- By Application
- Key Takeaways
- East Asia Market Analysis and Forecast, By Country
- Historical Market Size Value (USD Billion) Trend Analysis By Market Taxonomy, 2021 to 2025
- Market Size Value (USD Billion) Forecast By Market Taxonomy, 2026 to 2036
- By Country
- China
- Japan
- South Korea
- By Target Therapeutic Area
- By Cancer Targeted
- By Imaging Technology
- By End User
- By Application
- By Country
- Market Attractiveness Analysis
- By Country
- By Target Therapeutic Area
- By Cancer Targeted
- By Imaging Technology
- By End User
- By Application
- Key Takeaways
- South Asia and Pacific Market Analysis and Forecast, By Country
- Historical Market Size Value (USD Billion) Trend Analysis By Market Taxonomy, 2021 to 2025
- Market Size Value (USD Billion) Forecast By Market Taxonomy, 2026 to 2036
- By Country
- India
- ASEAN
- Australia & New Zealand
- Rest of South Asia and Pacific
- By Target Therapeutic Area
- By Cancer Targeted
- By Imaging Technology
- By End User
- By Application
- By Country
- Market Attractiveness Analysis
- By Country
- By Target Therapeutic Area
- By Cancer Targeted
- By Imaging Technology
- By End User
- By Application
- Key Takeaways
- Middle East & Africa Market Analysis and Forecast, By Country
- Historical Market Size Value (USD Billion) Trend Analysis By Market Taxonomy, 2021 to 2025
- Market Size Value (USD Billion) Forecast By Market Taxonomy, 2026 to 2036
- By Country
- Kingdom of Saudi Arabia
- Other GCC Countries
- Türkiye
- South Africa
- Other African Union
- Rest of Middle East & Africa
- By Target Therapeutic Area
- By Cancer Targeted
- By Imaging Technology
- By End User
- By Application
- By Country
- Market Attractiveness Analysis
- By Country
- By Target Therapeutic Area
- By Cancer Targeted
- By Imaging Technology
- By End User
- By Application
- Key Takeaways
- Key Countries Market Analysis
- USA
- Pricing Analysis
- Market Share Analysis, 2025
- By Target Therapeutic Area
- By Cancer Targeted
- By Imaging Technology
- By End User
- By Application
- Canada
- Pricing Analysis
- Market Share Analysis, 2025
- By Target Therapeutic Area
- By Cancer Targeted
- By Imaging Technology
- By End User
- By Application
- Mexico
- Pricing Analysis
- Market Share Analysis, 2025
- By Target Therapeutic Area
- By Cancer Targeted
- By Imaging Technology
- By End User
- By Application
- Brazil
- Pricing Analysis
- Market Share Analysis, 2025
- By Target Therapeutic Area
- By Cancer Targeted
- By Imaging Technology
- By End User
- By Application
- Chile
- Pricing Analysis
- Market Share Analysis, 2025
- By Target Therapeutic Area
- By Cancer Targeted
- By Imaging Technology
- By End User
- By Application
- Germany
- Pricing Analysis
- Market Share Analysis, 2025
- By Target Therapeutic Area
- By Cancer Targeted
- By Imaging Technology
- By End User
- By Application
- UK
- Pricing Analysis
- Market Share Analysis, 2025
- By Target Therapeutic Area
- By Cancer Targeted
- By Imaging Technology
- By End User
- By Application
- Italy
- Pricing Analysis
- Market Share Analysis, 2025
- By Target Therapeutic Area
- By Cancer Targeted
- By Imaging Technology
- By End User
- By Application
- Spain
- Pricing Analysis
- Market Share Analysis, 2025
- By Target Therapeutic Area
- By Cancer Targeted
- By Imaging Technology
- By End User
- By Application
- France
- Pricing Analysis
- Market Share Analysis, 2025
- By Target Therapeutic Area
- By Cancer Targeted
- By Imaging Technology
- By End User
- By Application
- India
- Pricing Analysis
- Market Share Analysis, 2025
- By Target Therapeutic Area
- By Cancer Targeted
- By Imaging Technology
- By End User
- By Application
- ASEAN
- Pricing Analysis
- Market Share Analysis, 2025
- By Target Therapeutic Area
- By Cancer Targeted
- By Imaging Technology
- By End User
- By Application
- Australia & New Zealand
- Pricing Analysis
- Market Share Analysis, 2025
- By Target Therapeutic Area
- By Cancer Targeted
- By Imaging Technology
- By End User
- By Application
- China
- Pricing Analysis
- Market Share Analysis, 2025
- By Target Therapeutic Area
- By Cancer Targeted
- By Imaging Technology
- By End User
- By Application
- Japan
- Pricing Analysis
- Market Share Analysis, 2025
- By Target Therapeutic Area
- By Cancer Targeted
- By Imaging Technology
- By End User
- By Application
- South Korea
- Pricing Analysis
- Market Share Analysis, 2025
- By Target Therapeutic Area
- By Cancer Targeted
- By Imaging Technology
- By End User
- By Application
- Russia
- Pricing Analysis
- Market Share Analysis, 2025
- By Target Therapeutic Area
- By Cancer Targeted
- By Imaging Technology
- By End User
- By Application
- Poland
- Pricing Analysis
- Market Share Analysis, 2025
- By Target Therapeutic Area
- By Cancer Targeted
- By Imaging Technology
- By End User
- By Application
- Hungary
- Pricing Analysis
- Market Share Analysis, 2025
- By Target Therapeutic Area
- By Cancer Targeted
- By Imaging Technology
- By End User
- By Application
- Kingdom of Saudi Arabia
- Pricing Analysis
- Market Share Analysis, 2025
- By Target Therapeutic Area
- By Cancer Targeted
- By Imaging Technology
- By End User
- By Application
- Türkiye
- Pricing Analysis
- Market Share Analysis, 2025
- By Target Therapeutic Area
- By Cancer Targeted
- By Imaging Technology
- By End User
- By Application
- South Africa
- Pricing Analysis
- Market Share Analysis, 2025
- By Target Therapeutic Area
- By Cancer Targeted
- By Imaging Technology
- By End User
- By Application
- USA
- Market Structure Analysis
- Competition Dashboard
- Competition Benchmarking
- Market Share Analysis of Top Players
- By Regional
- By Target Therapeutic Area
- By Cancer Targeted
- By Imaging Technology
- By End User
- By Application
- Emerging Startups
- Innovation Benchmarking
- Competition Analysis
- Competition Deep Dive
- Siemens Healthineers AG
- Overview
- Product Portfolio
- Profitability by Market Segments
- Sales Footprint
- Strategy Overview
- Marketing Strategy
- Product Strategy
- Channel Strategy
- GE HealthCare Technologies Inc.
- Koninklijke Philips N.V.
- Canon Medical Systems Corporation
- Fujifilm Holdings Corporation
- Samsung Medison Co., Ltd.
- Perspectum Ltd.
- QUIBIM S.L.
- ImageBiopsy Lab GmbH
- Deep Bio Inc.
- Others
- Siemens Healthineers AG
- Case Studies
- Success Stories
- Recent Developments
- Competition Deep Dive
- Assumptions & Acronyms Used


