Workplace Management Tools Market Outlook (2023 to 2033)

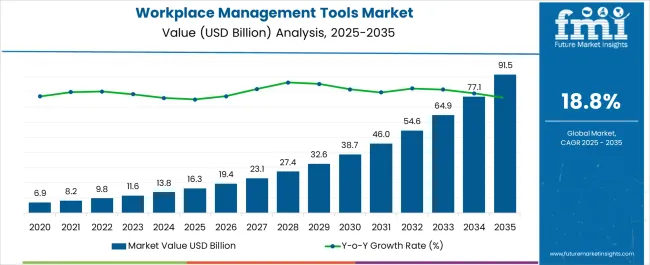
The global workplace management tools market size is anticipated to exceed US$ 11,583.6 million in 2023 and is projected to reach US$ 65,046.7 million by 2033, indexing a CAGR of 18.8% by the end of the forecast period. Companies use workplace management applications to create employees' best-fit schedules, track time and attendance, manage tasks, HR management, and manage their employees' absences and leaves.

Attributes Details
Market Share (2022) US$ 9,883.6 million
Market Share (2023) US$ 11,583.6 million
Market Share (2033) US$ 65,046.7 million
Market Share (2023 to 2033) 18.8%

Workplace management application features vary from industry to industry. The manufacturing industry has been a strong adopter of workplace management solutions as it helps them to measure employee productivity as well as manage and retain high-performing employees. Whereas in the IT sector, human resources software is paired with workforce management tools that are integrated with biometric recognition.

In addition, factors such as workforce optimization, increasing cloud deployments, and compliance with regulatory mandates are responsible for driving the market growth. Various end-user industries are anticipating an increase in demand for workplace management systems, as well as connectivity and unified enterprise solutions.

However, there is a lack of awareness of workplace management solutions in the corporate sector, and the shortage of expert staff has limited the growth of the workplace management tools market. Other factors, such as the rise in smart and sustainable buildings, corporate social responsibility (CSR), and the growth in sustainable and smart buildings, are also expected to provide lucrative growth opportunities for the global workplace management tools market.

Don't pay for what you don't need

Customize your report by selecting specific countries or regions and save 30%!

What Are the Market Dynamics for Workplace Management Tools?

Drivers:

  • Introduction of New Technologies: The introduction of new technologies like AI, IoT, and machine learning and their increasing adoption in workplace management systems may drive the workplace management tools market.
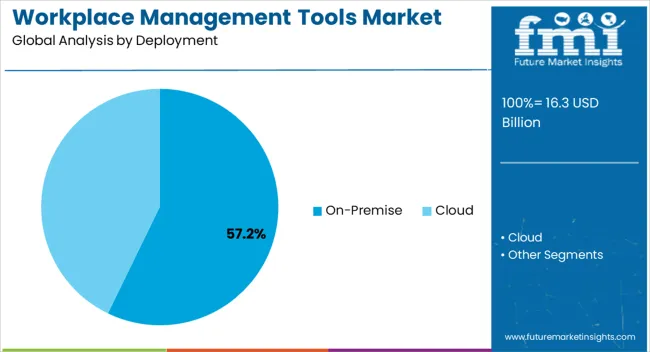
  • Increasing Cloud-Computing Application Deployments: The trend is shifting from complex on-premises deployments to cloud-computing (SaaS-model) deployments. The SaaS-based implementation of IWMS enables more granular, less costly, and resource-intensive projects.
  • Costs Effective: A low cost of deployment and implementation of workplace management tools like cloud services makes cloud computing attractive to small companies. Platforms on the cloud provide a cost-effective and easily deployable alternative, eliminating the need for small companies to build their data centers.
  • Multiple Benefits: Several benefits are offered in the workplace management tools, including real-time tracking, integrated processes, reduced energy consumption, safety and security, disaster recovery, and consolidation of data centers. For Instance, the use of mobile devices and cloud technology has made it much easier for facility managers to send alerts anywhere, anytime, to employees in remote locations.
  • Lack of Awareness & Unexplored Benefits: The biggest impediment in the market is the lack of awareness and its importance in organizations. People are not fully aware of the changes in products and services, even though workplace management is an imperative aspect of organizations. This has made this department equally as crucial as other core business processes.

Regional Insights

How North America is Dominating Workplace Management Tools Market?

North America is experiencing a rapid increase in the workspace management tools market. In 2022, North America held a market share of 28.1% due to higher adoption and installation of workspace tools on virtual desktops by enterprises.

Currently, the United States holds a massive share due to increasing developments in smart building projects in the region. Most leading market players, such as Oracle, IBM, Trimble, Accruent, and Archibus, have headquarters in this region.

Also, advanced developments and establishments in the real estate and infrastructure sector increase the demand for workplace management tools in North America. Hence, North America is expected to dominate the market in the coming years.
How is Europe Performing in the Workplace Management Tools Market?

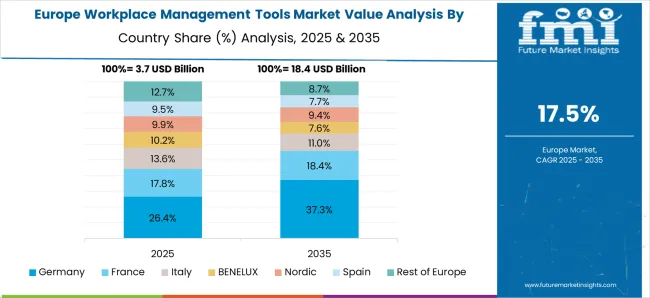
In 2022, a significant share of 25.1% was occupied by the workplace management tools market in Europe due to a decrease in the total ownership costs of workspace management tools in the region. Within the European Union, continuous technological advancements are occurring throughout the region, such as in Norway, Finland, Sweden, Denmark, the Netherlands, Switzerland, and the United Kingdom, which holds a strong position in national technological strength.

Sudip Saha
Sudip Saha

Principal Consultant

Talk to Analyst

Find your sweet spots for generating winning opportunities in this market.

Start-up Ecosystem

How is the Start-up Ecosystem in the Workplace Management Tools Market?

The workplace management tools market survey explains that various business models are emerging all the time, sometimes due to market changes and sometimes due to technological advancements, culminating in brand-new and exciting trends. It is becoming increasingly common for start-ups to focus on innovation, merge and acquire, and develop the appropriate frameworks and architectures.
  • In 2022, organizations all around the world are expected to have an average of 35 AI projects in place. Moreover, 45 percent of companies use machine learning, artificial intelligence, or data analysis tools for addressing data quality issues.
  • Eden's Performance Management product launches the company's People Success software suite, complementing its flexible Office suite of tools.
  • Start-up companies are focusing on creating a full-stack solution as DEX software. DEX management tools support that strategy by aggregating usage and performance data, dissecting that data, and providing insights that help companies make better choices for their technology, fuelling the overall sales of workplace management tools.

Competitive Landscape

Workplace Management Tools Market: Key Contracts/ Agreements/ Acquisitions

Most workplace management tools market competitors adopted partnerships as a key strategy to expand their geographical footprint and upgrade their product technologies.

  • In March 2021, Cisco enabled trusted workplaces and safe returns to the office through Webex and collaboration devices that use sensors, alerts, and artificial intelligence (AI).

Recent Developments in the Workplace Management Tools Market

Due to the competitive environment, organizations increasingly require workplace management tools to keep their workers motivated and organized. This ensures optimal productivity to stay abreast of the changing times. Companies like SISQUAL, Oracle, NICE Systems, and Infor are introducing a wide range of innovative workplace management tools with advanced capabilities and features. These solutions address the traditional needs of contact centers, back offices, and branches.

  • Asana: Work management platform Asana launched a new set of tools and product liaisons in October 2022 with the goal of automatically providing company executives with a comprehensive view of progress toward important projects to guide resource allocation and planning. The newest products from Asana are designed to assist businesses in quickly shifting priorities when their needs alter. They also seek to reduce waste costs and duplication of effort by reducing cross-functional work through an integrated tech stack and scaling up worldwide security through enterprise security capabilities.
  • Atlassian Corporation: A renowned provider of team collaboration and productivity software, Atlassian Corporation Plc, launched a new work management solution called Atlassian Together in September 2022, along with several new product features. These new offerings from Atlassian are intended to facilitate the alignment of autonomous teams' work practices and the technologies they select to support organizations' attempts to become digital.
  • Authority Software: Authority Software announced the launch of Authority Workforce Management on April 16th, which includes quality recording management, customer relationship management, and rapid application development.
  • TRAX: TRAX partnered with Blue Yonder in January 2021 to launch workforce management software for retailers and fulfillment centers that track real-time demand visibility and employ a flexible, skilled workforce to solve store issues quickly and effectively.
  • Dell Technology: In April 2019, Dell Technologies introduced Unified Workspace, which offers workers a ready-to-work experience that simplifies IT's entire device lifecycle.

Get the data you need at a Fraction of the cost

Personalize your report by choosing insights you need
and save 40%!

Key Players in the Global Market

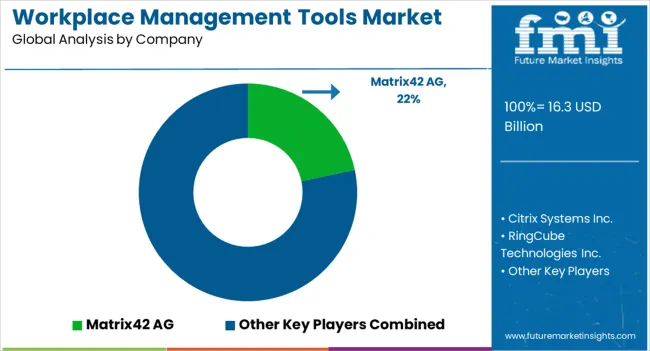
  • Matrix42 AG
  • Citrix Systems Inc.
  • RingCube Technologies Inc.
  • Cisco Systems Inc.
  • Ivanti Software Inc.
  • Dell Inc.
  • VMware Inc.
  • Microsoft Corporation
  • Bitrix Inc.
  • Atlantis Computing Inc.

Scope of the Report

Attribute Details
Forecast Period 2023 to 2033
Historical Data Available for 2018 to 2022
Market Analysis US$ million for Value
Key Regions Covered North America; Latin America; Europe; Asia Pacific; The Middle East & Africa (MEA)
Key Countries Covered United States, Canada, Germany, United Kingdom, Nordic, Russia, BENELUX, Poland, France, Spain, Italy, Czech Republic, Hungary, Rest of EMEAI, Brazil, Peru, Argentina, Mexico, South Africa, Northern Africa, GCC Countries, China, Japan, South Korea, India, ASEAN, Thailand, Malaysia, Indonesia, Australia, New Zealand, Others
Key Segments Covered Deployment, Component, Organization Size, Industry Vertical, Region
Report Coverage Market Forecast, Company Share Analysis, Competition Intelligence, Trend Analysis, Market Dynamics and Challenges, and Strategic Growth Initiatives

Workplace Management Tools Market Segmentation

By Deployment:

  • On-premise
  • Cloud

By Component:

  • Solution
  • Services

By Organization Size:

  • Large Enterprises
  • Small Enterprises
  • Medium Enterprises

By Industry Vertical:

  • Manufacturing
  • Healthcare
  • Government
  • BFSI
  • Retail & E-commerce
  • IT & Telecom
  • Education
  • Others

By Region:

  • North America
  • Latin America
  • Europe
  • Asia Pacific
  • The Middle East & Africa (MEA)

Frequently Asked Questions

What is the Current Estimated Valuation of the Workplace Management Tools Market?

The workplace management tools market is set to reach US$ 11,583.6 million in 2023.

What Size is the Workplace Management Tools Market Expected to Reach by 2033?

The global workplace management tools market is poised to achieve a revenue milestone of US$ 65,046.7 million by 2033.

What is the CAGR Forecast for the Workplace Management Tools Market?

A CAGR of 18.8% is predicted for the workplace management tools market through 2033.

Which Region Reveals Substantial Profit Opportunities for Workplace Management Tools?

North America, with a 28.1% global revenue share in 2022, offers substantial profit prospects for workplace management tools driven by remote work trends.

Which is the Top Trend in the Workplace Management Tools Market?

The prominent trend shaping the workplace management tools market involves leveraging AI and IoT integration to elevate operational efficiency.

Table of Content
1. Executive Summary
    1.1. Global Market Outlook
    1.2. Demand-side Trends
    1.3. Supply-side Trends
    1.4. Technology Roadmap Analysis
    1.5. Analysis and Recommendations
2. Market Overview
    2.1. Market Coverage / Taxonomy
    2.2. Market Definition / Scope / Limitations
3. Market Background
    3.1. Market Dynamics
        3.1.1. Drivers
        3.1.2. Restraints
        3.1.3. Opportunity
        3.1.4. Trends
    3.2. Scenario Forecast
        3.2.1. Demand in Optimistic Scenario
        3.2.2. Demand in Likely Scenario
        3.2.3. Demand in Conservative Scenario
    3.3. Opportunity Map Analysis
    3.4. Investment Feasibility Matrix
    3.5. PESTLE and Porter’s Analysis
    3.6. Regulatory Landscape
        3.6.1. By Key Regions
        3.6.2. By Key Countries
    3.7. Regional Parent Market Outlook
4. Global Market Analysis 2018 to 2022 and Forecast, 2023 to 2033
    4.1. Historical Market Size Value (US$ Million) Analysis, 2018 to 2022
    4.2. Current and Future Market Size Value (US$ Million) Projections, 2023 to 2033
        4.2.1. Y-o-Y Growth Trend Analysis
        4.2.2. Absolute $ Opportunity Analysis
5. Global Market Analysis 2018 to 2022 and Forecast 2023 to 2033, By Deployment
    5.1. Introduction / Key Findings
    5.2. Historical Market Size Value (US$ Million) Analysis By Deployment, 2018 to 2022
    5.3. Current and Future Market Size Value (US$ Million) Analysis and Forecast By Deployment, 2023 to 2033
        5.3.1. On-Premise
        5.3.2. Cloud
    5.4. Y-o-Y Growth Trend Analysis By Deployment, 2018 to 2022
    5.5. Absolute $ Opportunity Analysis By Deployment, 2023 to 2033
6. Global Market Analysis 2018 to 2022 and Forecast 2023 to 2033, By Component
    6.1. Introduction / Key Findings
    6.2. Historical Market Size Value (US$ Million) Analysis By Component, 2018 to 2022
    6.3. Current and Future Market Size Value (US$ Million) Analysis and Forecast By Component, 2023 to 2033
        6.3.1. Solution
        6.3.2. Services
    6.4. Y-o-Y Growth Trend Analysis By Component, 2018 to 2022
    6.5. Absolute $ Opportunity Analysis By Component, 2023 to 2033
7. Global Market Analysis 2018 to 2022 and Forecast 2023 to 2033, By Organization Size
    7.1. Introduction / Key Findings
    7.2. Historical Market Size Value (US$ Million) Analysis By Organization Size, 2018 to 2022
    7.3. Current and Future Market Size Value (US$ Million) Analysis and Forecast By Organization Size, 2023 to 2033
        7.3.1. Large Enterprises
        7.3.2. Small Enterprises
        7.3.3. Medium Enterprises
    7.4. Y-o-Y Growth Trend Analysis By Organization Size, 2018 to 2022
    7.5. Absolute $ Opportunity Analysis By Organization Size, 2023 to 2033
8. Global Market Analysis 2018 to 2022 and Forecast 2023 to 2033, By Industry Vertical
    8.1. Introduction / Key Findings
    8.2. Historical Market Size Value (US$ Million) Analysis By Industry Vertical, 2018 to 2022
    8.3. Current and Future Market Size Value (US$ Million) Analysis and Forecast By Industry Vertical, 2023 to 2033
        8.3.1. Manufacturing
        8.3.2. Healthcare
        8.3.3. Government
        8.3.4. BFSI
        8.3.5. Retail & E-Commerce
        8.3.6. IT & Telecom
        8.3.7. Education
        8.3.8. Others
    8.4. Y-o-Y Growth Trend Analysis By Industry Vertical, 2018 to 2022
    8.5. Absolute $ Opportunity Analysis By Industry Vertical, 2023 to 2033
9. Global Market Analysis 2018 to 2022 and Forecast 2023 to 2033, By Region
    9.1. Introduction
    9.2. Historical Market Size Value (US$ Million) Analysis By Region, 2018 to 2022
    9.3. Current Market Size Value (US$ Million) Analysis and Forecast By Region, 2023 to 2033
        9.3.1. North America
        9.3.2. Latin America
        9.3.3. Western Europe
        9.3.4. Eastern Europe
        9.3.5. South Asia and Pacific
        9.3.6. East Asia
        9.3.7. Middle East and Africa
    9.4. Market Attractiveness Analysis By Region
10. North America Market Analysis 2018 to 2022 and Forecast 2023 to 2033, By Country
    10.1. Historical Market Size Value (US$ Million) Trend Analysis By Market Taxonomy, 2018 to 2022
    10.2. Market Size Value (US$ Million) Forecast By Market Taxonomy, 2023 to 2033
        10.2.1. By Country
            10.2.1.1. USA
            10.2.1.2. Canada
        10.2.2. By Deployment
        10.2.3. By Component
        10.2.4. By Organization Size
        10.2.5. By Industry Vertical
    10.3. Market Attractiveness Analysis
        10.3.1. By Country
        10.3.2. By Deployment
        10.3.3. By Component
        10.3.4. By Organization Size
        10.3.5. By Industry Vertical
    10.4. Key Takeaways
11. Latin America Market Analysis 2018 to 2022 and Forecast 2023 to 2033, By Country
    11.1. Historical Market Size Value (US$ Million) Trend Analysis By Market Taxonomy, 2018 to 2022
    11.2. Market Size Value (US$ Million) Forecast By Market Taxonomy, 2023 to 2033
        11.2.1. By Country
            11.2.1.1. Brazil
            11.2.1.2. Mexico
            11.2.1.3. Rest of Latin America
        11.2.2. By Deployment
        11.2.3. By Component
        11.2.4. By Organization Size
        11.2.5. By Industry Vertical
    11.3. Market Attractiveness Analysis
        11.3.1. By Country
        11.3.2. By Deployment
        11.3.3. By Component
        11.3.4. By Organization Size
        11.3.5. By Industry Vertical
    11.4. Key Takeaways
12. Western Europe Market Analysis 2018 to 2022 and Forecast 2023 to 2033, By Country
    12.1. Historical Market Size Value (US$ Million) Trend Analysis By Market Taxonomy, 2018 to 2022
    12.2. Market Size Value (US$ Million) Forecast By Market Taxonomy, 2023 to 2033
        12.2.1. By Country
            12.2.1.1. Germany
            12.2.1.2. UK
            12.2.1.3. France
            12.2.1.4. Spain
            12.2.1.5. Italy
            12.2.1.6. Rest of Western Europe
        12.2.2. By Deployment
        12.2.3. By Component
        12.2.4. By Organization Size
        12.2.5. By Industry Vertical
    12.3. Market Attractiveness Analysis
        12.3.1. By Country
        12.3.2. By Deployment
        12.3.3. By Component
        12.3.4. By Organization Size
        12.3.5. By Industry Vertical
    12.4. Key Takeaways
13. Eastern Europe Market Analysis 2018 to 2022 and Forecast 2023 to 2033, By Country
    13.1. Historical Market Size Value (US$ Million) Trend Analysis By Market Taxonomy, 2018 to 2022
    13.2. Market Size Value (US$ Million) Forecast By Market Taxonomy, 2023 to 2033
        13.2.1. By Country
            13.2.1.1. Poland
            13.2.1.2. Russia
            13.2.1.3. Czech Republic
            13.2.1.4. Romania
            13.2.1.5. Rest of Eastern Europe
        13.2.2. By Deployment
        13.2.3. By Component
        13.2.4. By Organization Size
        13.2.5. By Industry Vertical
    13.3. Market Attractiveness Analysis
        13.3.1. By Country
        13.3.2. By Deployment
        13.3.3. By Component
        13.3.4. By Organization Size
        13.3.5. By Industry Vertical
    13.4. Key Takeaways
14. South Asia and Pacific Market Analysis 2018 to 2022 and Forecast 2023 to 2033, By Country
    14.1. Historical Market Size Value (US$ Million) Trend Analysis By Market Taxonomy, 2018 to 2022
    14.2. Market Size Value (US$ Million) Forecast By Market Taxonomy, 2023 to 2033
        14.2.1. By Country
            14.2.1.1. India
            14.2.1.2. Bangladesh
            14.2.1.3. Australia
            14.2.1.4. New Zealand
            14.2.1.5. Rest of South Asia and Pacific
        14.2.2. By Deployment
        14.2.3. By Component
        14.2.4. By Organization Size
        14.2.5. By Industry Vertical
    14.3. Market Attractiveness Analysis
        14.3.1. By Country
        14.3.2. By Deployment
        14.3.3. By Component
        14.3.4. By Organization Size
        14.3.5. By Industry Vertical
    14.4. Key Takeaways
15. East Asia Market Analysis 2018 to 2022 and Forecast 2023 to 2033, By Country
    15.1. Historical Market Size Value (US$ Million) Trend Analysis By Market Taxonomy, 2018 to 2022
    15.2. Market Size Value (US$ Million) Forecast By Market Taxonomy, 2023 to 2033
        15.2.1. By Country
            15.2.1.1. China
            15.2.1.2. Japan
            15.2.1.3. South Korea
        15.2.2. By Deployment
        15.2.3. By Component
        15.2.4. By Organization Size
        15.2.5. By Industry Vertical
    15.3. Market Attractiveness Analysis
        15.3.1. By Country
        15.3.2. By Deployment
        15.3.3. By Component
        15.3.4. By Organization Size
        15.3.5. By Industry Vertical
    15.4. Key Takeaways
16. Middle East and Africa Market Analysis 2018 to 2022 and Forecast 2023 to 2033, By Country
    16.1. Historical Market Size Value (US$ Million) Trend Analysis By Market Taxonomy, 2018 to 2022
    16.2. Market Size Value (US$ Million) Forecast By Market Taxonomy, 2023 to 2033
        16.2.1. By Country
            16.2.1.1. GCC Countries
            16.2.1.2. South Africa
            16.2.1.3. Israel
            16.2.1.4. Rest of MEA
        16.2.2. By Deployment
        16.2.3. By Component
        16.2.4. By Organization Size
        16.2.5. By Industry Vertical
    16.3. Market Attractiveness Analysis
        16.3.1. By Country
        16.3.2. By Deployment
        16.3.3. By Component
        16.3.4. By Organization Size
        16.3.5. By Industry Vertical
    16.4. Key Takeaways
17. Key Countries Market Analysis
    17.1. USA
        17.1.1. Pricing Analysis
        17.1.2. Market Share Analysis, 2022
            17.1.2.1. By Deployment
            17.1.2.2. By Component
            17.1.2.3. By Organization Size
            17.1.2.4. By Industry Vertical
    17.2. Canada
        17.2.1. Pricing Analysis
        17.2.2. Market Share Analysis, 2022
            17.2.2.1. By Deployment
            17.2.2.2. By Component
            17.2.2.3. By Organization Size
            17.2.2.4. By Industry Vertical
    17.3. Brazil
        17.3.1. Pricing Analysis
        17.3.2. Market Share Analysis, 2022
            17.3.2.1. By Deployment
            17.3.2.2. By Component
            17.3.2.3. By Organization Size
            17.3.2.4. By Industry Vertical
    17.4. Mexico
        17.4.1. Pricing Analysis
        17.4.2. Market Share Analysis, 2022
            17.4.2.1. By Deployment
            17.4.2.2. By Component
            17.4.2.3. By Organization Size
            17.4.2.4. By Industry Vertical
    17.5. Germany
        17.5.1. Pricing Analysis
        17.5.2. Market Share Analysis, 2022
            17.5.2.1. By Deployment
            17.5.2.2. By Component
            17.5.2.3. By Organization Size
            17.5.2.4. By Industry Vertical
    17.6. UK
        17.6.1. Pricing Analysis
        17.6.2. Market Share Analysis, 2022
            17.6.2.1. By Deployment
            17.6.2.2. By Component
            17.6.2.3. By Organization Size
            17.6.2.4. By Industry Vertical
    17.7. France
        17.7.1. Pricing Analysis
        17.7.2. Market Share Analysis, 2022
            17.7.2.1. By Deployment
            17.7.2.2. By Component
            17.7.2.3. By Organization Size
            17.7.2.4. By Industry Vertical
    17.8. Spain
        17.8.1. Pricing Analysis
        17.8.2. Market Share Analysis, 2022
            17.8.2.1. By Deployment
            17.8.2.2. By Component
            17.8.2.3. By Organization Size
            17.8.2.4. By Industry Vertical
    17.9. Italy
        17.9.1. Pricing Analysis
        17.9.2. Market Share Analysis, 2022
            17.9.2.1. By Deployment
            17.9.2.2. By Component
            17.9.2.3. By Organization Size
            17.9.2.4. By Industry Vertical
    17.10. Poland
        17.10.1. Pricing Analysis
        17.10.2. Market Share Analysis, 2022
            17.10.2.1. By Deployment
            17.10.2.2. By Component
            17.10.2.3. By Organization Size
            17.10.2.4. By Industry Vertical
    17.11. Russia
        17.11.1. Pricing Analysis
        17.11.2. Market Share Analysis, 2022
            17.11.2.1. By Deployment
            17.11.2.2. By Component
            17.11.2.3. By Organization Size
            17.11.2.4. By Industry Vertical
    17.12. Czech Republic
        17.12.1. Pricing Analysis
        17.12.2. Market Share Analysis, 2022
            17.12.2.1. By Deployment
            17.12.2.2. By Component
            17.12.2.3. By Organization Size
            17.12.2.4. By Industry Vertical
    17.13. Romania
        17.13.1. Pricing Analysis
        17.13.2. Market Share Analysis, 2022
            17.13.2.1. By Deployment
            17.13.2.2. By Component
            17.13.2.3. By Organization Size
            17.13.2.4. By Industry Vertical
    17.14. India
        17.14.1. Pricing Analysis
        17.14.2. Market Share Analysis, 2022
            17.14.2.1. By Deployment
            17.14.2.2. By Component
            17.14.2.3. By Organization Size
            17.14.2.4. By Industry Vertical
    17.15. Bangladesh
        17.15.1. Pricing Analysis
        17.15.2. Market Share Analysis, 2022
            17.15.2.1. By Deployment
            17.15.2.2. By Component
            17.15.2.3. By Organization Size
            17.15.2.4. By Industry Vertical
    17.16. Australia
        17.16.1. Pricing Analysis
        17.16.2. Market Share Analysis, 2022
            17.16.2.1. By Deployment
            17.16.2.2. By Component
            17.16.2.3. By Organization Size
            17.16.2.4. By Industry Vertical
    17.17. New Zealand
        17.17.1. Pricing Analysis
        17.17.2. Market Share Analysis, 2022
            17.17.2.1. By Deployment
            17.17.2.2. By Component
            17.17.2.3. By Organization Size
            17.17.2.4. By Industry Vertical
    17.18. China
        17.18.1. Pricing Analysis
        17.18.2. Market Share Analysis, 2022
            17.18.2.1. By Deployment
            17.18.2.2. By Component
            17.18.2.3. By Organization Size
            17.18.2.4. By Industry Vertical
    17.19. Japan
        17.19.1. Pricing Analysis
        17.19.2. Market Share Analysis, 2022
            17.19.2.1. By Deployment
            17.19.2.2. By Component
            17.19.2.3. By Organization Size
            17.19.2.4. By Industry Vertical
    17.20. South Korea
        17.20.1. Pricing Analysis
        17.20.2. Market Share Analysis, 2022
            17.20.2.1. By Deployment
            17.20.2.2. By Component
            17.20.2.3. By Organization Size
            17.20.2.4. By Industry Vertical
    17.21. GCC Countries
        17.21.1. Pricing Analysis
        17.21.2. Market Share Analysis, 2022
            17.21.2.1. By Deployment
            17.21.2.2. By Component
            17.21.2.3. By Organization Size
            17.21.2.4. By Industry Vertical
    17.22. South Africa
        17.22.1. Pricing Analysis
        17.22.2. Market Share Analysis, 2022
            17.22.2.1. By Deployment
            17.22.2.2. By Component
            17.22.2.3. By Organization Size
            17.22.2.4. By Industry Vertical
    17.23. Israel
        17.23.1. Pricing Analysis
        17.23.2. Market Share Analysis, 2022
            17.23.2.1. By Deployment
            17.23.2.2. By Component
            17.23.2.3. By Organization Size
            17.23.2.4. By Industry Vertical
18. Market Structure Analysis
    18.1. Competition Dashboard
    18.2. Competition Benchmarking
    18.3. Market Share Analysis of Top Players
        18.3.1. By Regional
        18.3.2. By Deployment
        18.3.3. By Component
        18.3.4. By Organization Size
        18.3.5. By Industry Vertical
19. Competition Analysis
    19.1. Competition Deep Dive
        19.1.1. Matrix42 AG
            19.1.1.1. Overview
            19.1.1.2. Product Portfolio
            19.1.1.3. Profitability by Market Segments
            19.1.1.4. Sales Footprint
            19.1.1.5. Strategy Overview
                19.1.1.5.1. Marketing Strategy
        19.1.2. Citrix Systems, Inc
            19.1.2.1. Overview
            19.1.2.2. Product Portfolio
            19.1.2.3. Profitability by Market Segments
            19.1.2.4. Sales Footprint
            19.1.2.5. Strategy Overview
                19.1.2.5.1. Marketing Strategy
        19.1.3. RingCube Technologies Inc
            19.1.3.1. Overview
            19.1.3.2. Product Portfolio
            19.1.3.3. Profitability by Market Segments
            19.1.3.4. Sales Footprint
            19.1.3.5. Strategy Overview
                19.1.3.5.1. Marketing Strategy
        19.1.4. Cisco Systems Inc
            19.1.4.1. Overview
            19.1.4.2. Product Portfolio
            19.1.4.3. Profitability by Market Segments
            19.1.4.4. Sales Footprint
            19.1.4.5. Strategy Overview
                19.1.4.5.1. Marketing Strategy
        19.1.5. Ivanti Software Inc
            19.1.5.1. Overview
            19.1.5.2. Product Portfolio
            19.1.5.3. Profitability by Market Segments
            19.1.5.4. Sales Footprint
            19.1.5.5. Strategy Overview
                19.1.5.5.1. Marketing Strategy
        19.1.6. Dell Inc
            19.1.6.1. Overview
            19.1.6.2. Product Portfolio
            19.1.6.3. Profitability by Market Segments
            19.1.6.4. Sales Footprint
            19.1.6.5. Strategy Overview
                19.1.6.5.1. Marketing Strategy
        19.1.7. VMware Inc
            19.1.7.1. Overview
            19.1.7.2. Product Portfolio
            19.1.7.3. Profitability by Market Segments
            19.1.7.4. Sales Footprint
            19.1.7.5. Strategy Overview
                19.1.7.5.1. Marketing Strategy
        19.1.8. Microsoft Corporation
            19.1.8.1. Overview
            19.1.8.2. Product Portfolio
            19.1.8.3. Profitability by Market Segments
            19.1.8.4. Sales Footprint
            19.1.8.5. Strategy Overview
                19.1.8.5.1. Marketing Strategy
        19.1.9. Bitrix Inc
            19.1.9.1. Overview
            19.1.9.2. Product Portfolio
            19.1.9.3. Profitability by Market Segments
            19.1.9.4. Sales Footprint
            19.1.9.5. Strategy Overview
                19.1.9.5.1. Marketing Strategy
        19.1.10. Atlantis Computing Inc
            19.1.10.1. Overview
            19.1.10.2. Product Portfolio
            19.1.10.3. Profitability by Market Segments
            19.1.10.4. Sales Footprint
            19.1.10.5. Strategy Overview
                19.1.10.5.1. Marketing Strategy
20. Assumptions & Acronyms Used
21. Research Methodology
Recommendations

Technology

IT Service Management Tools Market

September 2022

REP-GB-4973

300 pages

Explore Technology Insights

View Reports
Future Market Insights

Workplace Management Tools Market

Schedule a Call