Wash-Off Label Market Size and Share Forecast Outlook 2025 to 2035

The wash-off label market will expand from USD 1.3 billion in 2025 to USD 2.5 billion by 2035, reflecting a CAGR of 6.6%. This growth is supported by rising demand for recyclable packaging, strict sustainability regulations, and brand focus on clean-label packaging. Wash-off labels enable effective recycling and reuse of containers, reducing waste across food, beverage, personal care, and pharmaceutical sectors.
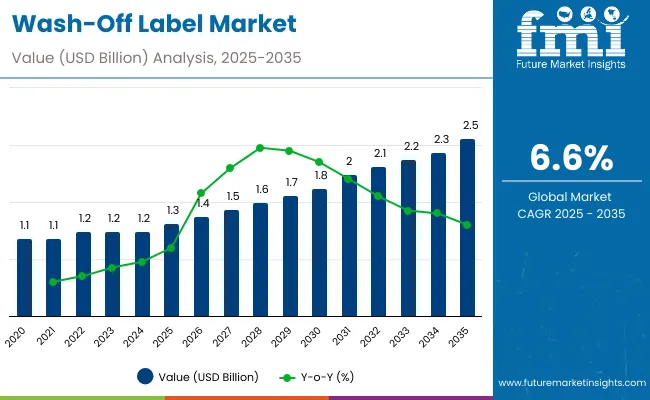
Quick Stats for Wash-Off Label Market

  • Market Value (2025): USD 1.3 billion
  • Market Forecast Value (2035): USD 2.5 billion
  • Market Forecast CAGR: 6.6%
  • Leading Segment in 2025: Water-based adhesives (42.6%)
  • Key Growth Regions: Asia-Pacific, led by Japan at 7.3% CAGR
  • Top Companies: CCL Label, UPM Raflatac, HERMA Labels, Adcraft Labels, ViraTek Inc., Scanvaegt Labels, Avery Dennison Corporation, GFB Solutions, Jinya Label

Wash Off Label Market

Metric Value
Industry Size (2025E) USD 1.3 billion
Industry Value (2035F) USD 2.5 billion
CAGR (2025 to 2035) 6.6%

Between 2025 and 2030, the market will add USD 0.4 billion, largely driven by beverage and food packaging adoption. From 2030 to 2035, expansion of USD 0.8 billion will stem from healthcare, cosmetics, and e-commerce applications. Key growth drivers include polypropylene films, water-based adhesives, and flexographic printing technology, while automation-ready label production enhances scalability for global brands and retailers.

From 2020 to 2024, wash-off labels gained significant traction as recycling regulations strengthened across Europe and North America. Beverage companies introduced wash-off solutions to support container reuse systems, while food and personal care brands piloted paper-based and biodegradable materials. The technology enabled clean recycling of PET bottles, improving yield and compliance.

By 2035, the market will grow to USD 2.5 billion at a CAGR of 6.6%. Polypropylene films, combined with water-based adhesives, will dominate due to durability and recyclability. Flexographic printing will retain leadership, while digital adoption expands for short runs. Asia-Pacific will deliver the highest growth, led by Japan and South Korea, while Europe emphasizes circularity and North America drives scale with beverage packaging.

Why is the Wash-Off Label Market Growing?

The wash-off label market is expanding as industries adopt recyclable packaging systems aligned with circular economy policies. Food and beverage companies are leading demand, using wash-off solutions to facilitate container reuse and meet Extended Producer Responsibility (EPR) targets. PET recycling efficiencies further reinforce adoption.

Healthcare and cosmetics also adopt wash-off labels for sterilizable, clean-label solutions. Consumer demand for eco-friendly products drives brand adoption, while advances in adhesives and printing extend performance. With global regulations tightening, wash-off labels are positioned as essential for sustainable packaging across food, beverage, healthcare, and personal care markets.

Segmental Overview

The wash-off label market is segmented by material type, adhesive type, printing technology, application, end-use industry, and region. Material types include PP, PET, PE, paper-based, and biodegradable labels. Adhesive types cover water-based, hot-melt, solvent-based, and acrylic. Printing technologies include flexographic, digital, offset, and gravure. Applications span beverage bottles, food jars, cosmetics, pharmaceuticals, and household packaging. End-use industries include food and beverages, pharmaceuticals, cosmetics, cleaning, and e-commerce across global regions.
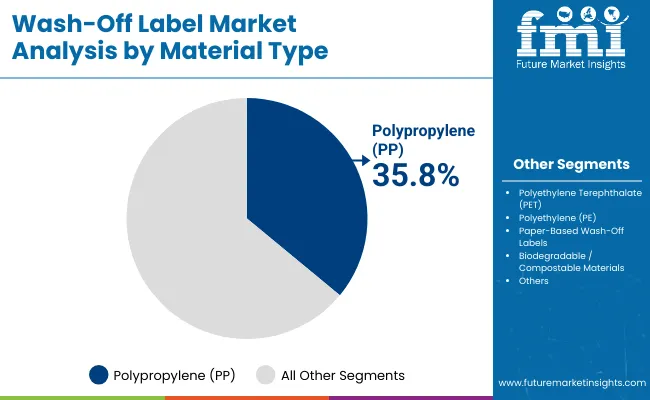
Polypropylene Leads in Material Type

Wash Off Label Market By Material

Polypropylene will hold 35.8% share in 2025, driven by its durability, print quality, and compatibility with recycling systems. Beverage and personal care sectors favor PP wash-off labels for clarity, branding, and clean removal during recycling. Adoption is reinforced by low cost and regulatory acceptance.

Growth is supported by integration with biodegradable coatings and compatibility with water-based adhesives. PP-based labels deliver high moisture resistance and adaptability across automated labeling lines. By 2035, polypropylene will remain dominant due to scalability and alignment with circular economy initiatives.
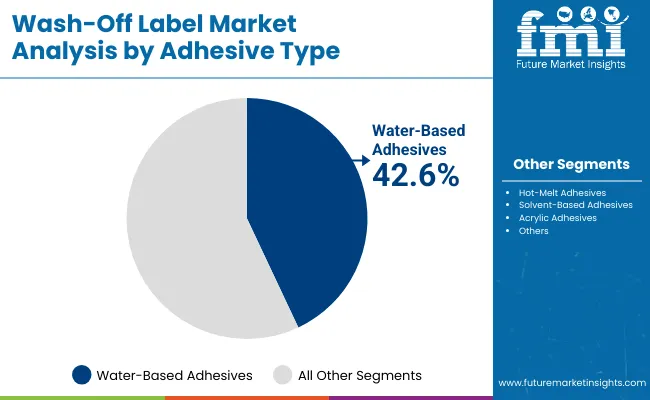
Water-Based Adhesives Dominate Adhesive Types

Wash Off Label Market By Adhesive

Water-based adhesives will capture 42.6% share in 2025, favored for recyclability, low VOC emissions, and safe processing. Beverage and food applications prefer water-based adhesives for reliable performance and compliance with food-contact regulations.

Advancements in wash-off technologies enhance adhesive removal, ensuring high PET recycling yields. Expansion into healthcare and cosmetics further supports adoption. As sustainability and regulatory standards tighten, water-based adhesives will remain the adhesive type of choice for wash-off labels.
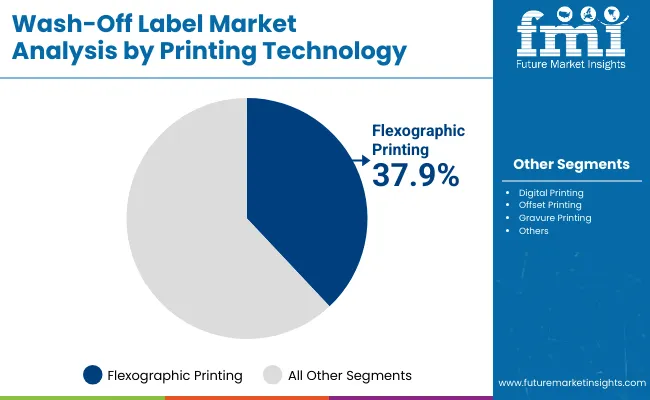
Flexographic Printing Retains Leadership

Wash Off Label Market By Printing

Flexographic printing will hold 37.9% share in 2025, offering high-quality output, efficiency, and versatility across substrates. Beverage and FMCG brands rely on flexo for mass-volume labeling due to cost efficiency and durability.

Growth continues as innovations in inks improve recyclability and compostability. Flexo remains critical for large-scale adoption, while short-run printing shifts to digital. By 2035, flexographic printing will anchor global production capacity for wash-off labels.
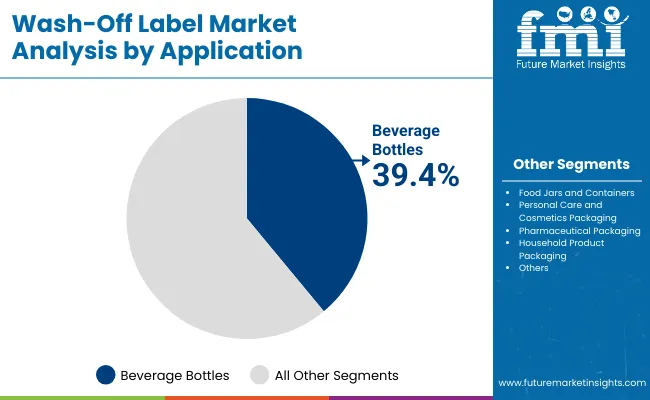
Beverage Bottles Lead Applications

Wash Off Label Market By Application

Beverage bottles will account for 39.4% share in 2025, making them the leading application segment. Wash-off labels are widely used by water, soda, and beer companies to support PET recycling and container reuse. Global beverage giants increasingly adopt wash-off solutions to align with EPR mandates and sustainability goals.

Future adoption extends into premium packaging and returnable bottle systems. Wash-off labels enhance branding while ensuring recyclability, positioning beverages as the largest driver of demand through 2035.
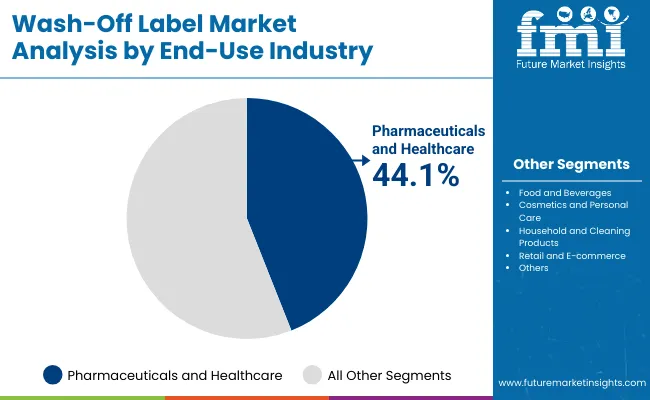
Food and Beverages Dominate End-Use Industry

Wash Off Label Market By End Use

Food and beverages will represent 44.1% share in 2025, cementing their role as the largest end-use sector. Wash-off labels are used on bottles, jars, trays, and pouches to ensure recyclability and consumer appeal. Strict food safety and sustainability policies reinforce adoption.

Growth is supported by demand for reusable containers, meal kits, and eco-friendly grocery packaging. As consumer preference for recyclable packaging rises, food and beverages will anchor global demand through 2035.

Drivers, Restraints, Opportunities, and Key Trends

Wash-off label demand is fueled by sustainability mandates, PET recycling systems, and EPR compliance. Beverage and FMCG companies lead adoption, while adhesives and printing innovations improve recyclability. Consumer demand for clean-label, eco-friendly packaging strengthens growth.Challenges include higher costs compared to conventional labels, limited recycling infrastructure in developing regions, and technical complexity in adhesive removal. Performance consistency under humidity and sterilization also limits applications.

Healthcare, cosmetics, and premium beverages present opportunities for expansion. Functional innovations such as antimicrobial coatings and smart tracking enhance value. Regional adoption in Latin America and Asia-Pacific grows with policy alignment.

Trends include rapid development of biodegradable label films, PFAS-free adhesives, and water-efficient recycling processes. Digital printing adoption grows for customization. Retailers emphasize circularity and recyclability claims, making wash-off labels key in sustainable packaging strategies.
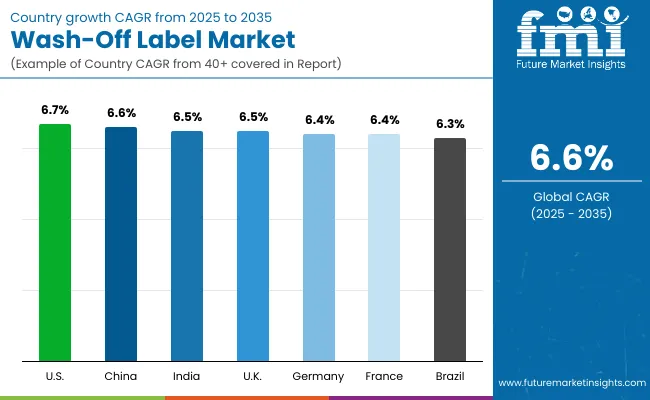
Analysis of Wash-Off Label Market by Key Countries

Wash Off Label Market By Country

The wash-off label market is growing worldwide as sustainability mandates and consumer demand converge. Asia-Pacific is expected to lead growth, particularly in Japan and South Korea. Europe enforces strict EPR and recyclability standards, while North America drives adoption through large-scale beverage packaging programs. Latin America and the Middle East & Africa strengthen demand through agriculture and food exports.
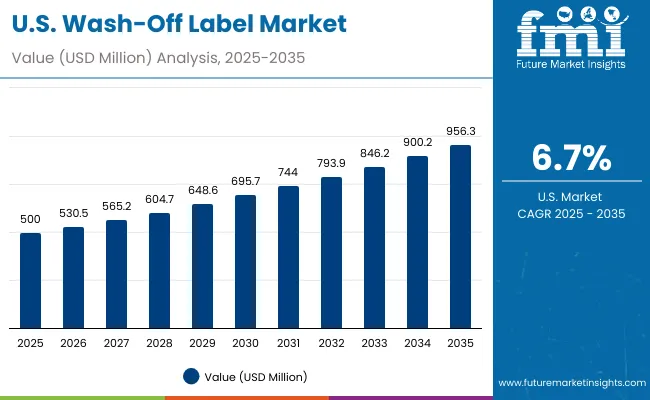
United States Sales Outlook

Wash Off Label Market Usa

The USA market is forecast to grow at 6.7% CAGR, fueled by large beverage brands transitioning to sustainable adhesive formats and the rapid expansion of e-commerce packaging. FDA-approved water-based adhesives are increasingly adopted across cartons, labels, and pouches, enhancing consumer trust through safety and compliance. Recycling initiatives further reinforce PET label compliance, aligning with circular economy targets. The combination of beverage packaging dominance, FDA-backed safety, and recycling-driven adoption makes the USA a leader in sustainable adhesive uptake.
  • Beverage packaging dominates demand.
  • FDA approvals enhance safety.
  • Recycling drives compliance.

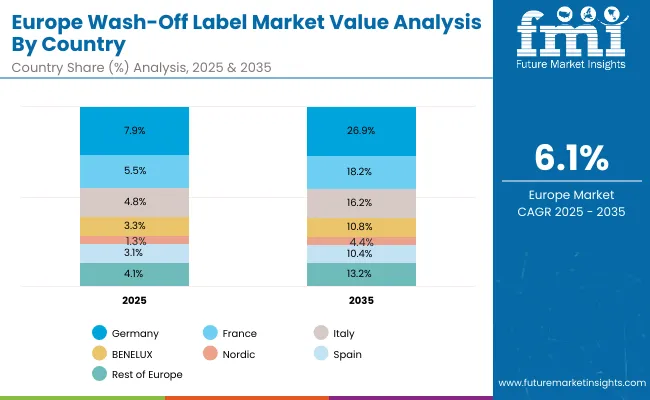
Germany Growth Outlook

Wash Off Label Market Europe

Germany will expand at 6.4% CAGR, supported by strict VerpackG laws that reinforce recyclability standards across all packaging formats. Food, beverage, and cosmetics companies are leading adopters, particularly as premium brands seek sustainable labeling options. Local recycling infrastructure offers a strong foundation, ensuring scalability and compliance with EU-wide directives. Industrial-scale usage is being supported by fiber-based adoption mandates, ensuring sustainability across key applications. As a result, Germany remains a central hub for eco-friendly adhesive packaging innovation and expansion.

  • Packaging laws mandate fiber adoption.
  • Food and beverages anchor demand.
  • Cosmetics add premium use cases.

United Kingdom Expansion Outlook

The UK is projected to grow at 6.5% CAGR, with growth driven by Extended Producer Responsibility (EPR) and Plastic Tax schemes. Beverage bottles and food jars dominate demand, with grocers rapidly adopting recyclable labels to comply with stricter regulations. Healthcare pilots are also gaining traction, testing adhesives in sensitive medical packaging applications. The shift toward circular compliance has created opportunities for compostable and water-based adhesives. These drivers are reinforcing both mass retail usage and specialized adoption in healthcare packaging.

  • Plastic taxes accelerate adoption.
  • Grocers deploy recyclable labels.
  • Healthcare packaging trials grow.

China Sales Outlook

China is set to expand at 6.6% CAGR, supported by high demand from packaged food and beverages alongside robust export-driven packaging adoption. Large-scale production capacity ensures affordability, driving adoption across FMCG brands and industrial exporters. Compliance with EU and USA trade rules is boosting PLA-based adhesive demand, aligning local products with international market standards. Beverage exports and electronics packaging are strengthening applications. With its massive scale and manufacturing edge, China is becoming a pivotal global player in adhesive adoption.

  • Packaged food leads demand.
  • Beverage exports adopt labels.
  • Export rules drive compliance.

India Growth Outlook

India will grow at 6.5% CAGR, driven by agriculture, beverages, and the retail sector. Nationwide plastic bans are enforcing transitions to compostable adhesives, particularly in food and beverage packaging. Export alignment with EU and USA compliance standards has increased demand from manufacturers seeking international certifications. Rapid retail expansion, combined with quick-commerce and consumer-driven sustainability, reinforces large-scale adoption. Agriculture remains a vital driver, using bio-based adhesives for packaging fresh produce and supply chain operations, ensuring eco-friendly compliance nationwide.

  • Agriculture drives packaging demand.
  • Plastic bans enforce transitions.
  • Exports boost adoption.

Japan Outlook

Japan will lead global expansion with a 7.3% CAGR, driven by premium beverage, healthcare, and cosmetics packaging. Its advanced recycling systems reinforce adoption, enabling recovery and reuse of compostable adhesives effectively. Premium brands are opting for high-quality, water-based adhesives that align with consumer preference for safety and sustainability. Healthcare applications are increasing, with sterile medical packaging gaining traction. With an emphasis on both premium quality and environmental responsibility, Japan is shaping global benchmarks in adhesive packaging.

  • Premium beverages drive adoption.
  • Healthcare expands usage.
  • Recycling ensures compliance.

South Korea Expansion Outlook

South Korea will grow at 7.2% CAGR, with expansion fueled by e-commerce packaging, personal care, and beverages. Export-driven adoption is rising as manufacturers emphasize recyclable solutions to meet global trade requirements. Bio-based adhesives are gaining popularity in cosmetics packaging, reflecting consumer preference for eco-friendly products. Electronics and online retail growth further strengthen market usage. By integrating innovation with export competitiveness, South Korea is emerging as a regional leader in sustainable adhesive packaging adoption.
  • E-commerce accelerates usage.
  • Cosmetics drive bio-based adoption.
  • Export packaging strengthens growth.

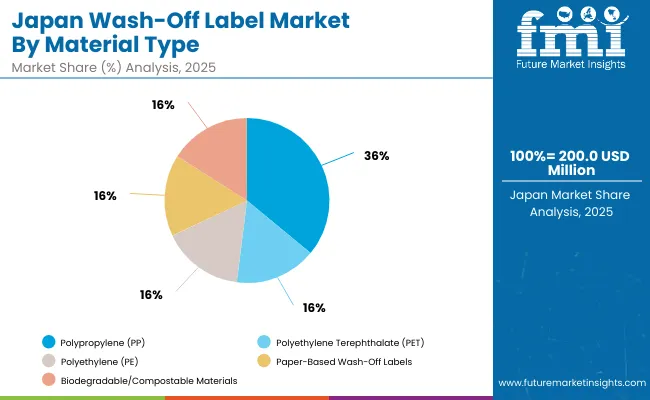
Analysis of Japan by Material Type

Wash Off Label Market Japan

Japan’s wash-off label market, valued at USD 200 million in 2025, is led by polypropylene (PP), holding 37.4% share due to its durability, recyclability, and widespread use in beverage and personal care packaging. Polyethylene terephthalate (PET) follows with 20%, supported by premium branding needs in food and drinks. Polyethylene (PE) contributes 18.1%, favored for flexibility and cost-effectiveness. Paper-based wash-off labels, accounting for 15.8%, gain demand from eco-friendly packaging. Biodegradable and compostable materials, at 8.7%, reflect Japan’s gradual pivot toward sustainability. This segmentation underscores the balance between established plastic substrates and rising adoption of green alternatives, driven by circular economy policies.
Analysis of South Korea by Adhesive Type

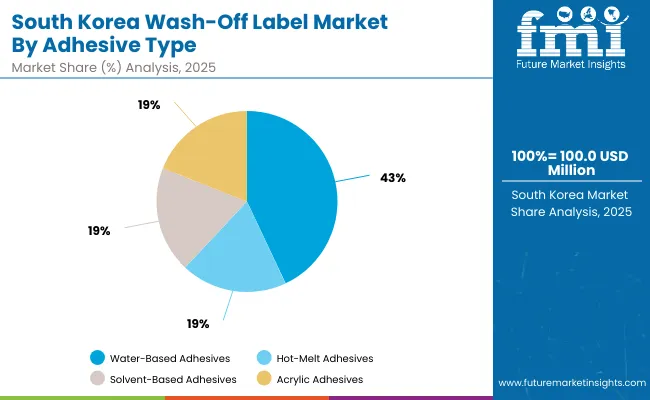
Wash Off Label Market South Korea

South Korea’s wash-off label market, valued at USD 100 million in 2025, is dominated by water-based adhesives, which capture 42.6% share, driven by their recyclability and ease of removal in glass and PET bottles. Hot-melt adhesives follow with 18.2%, offering strong adhesion for high-speed labeling processes. Solvent-based adhesives, at 16%, are still applied in heavy-duty packaging but face regulatory pressure. Acrylic adhesives account for 14.1%, supporting durable, weather-resistant labeling. This segmentation reflects South Korea’s strong emphasis on water-based formats aligned with global recycling initiatives, highlighting innovation in adhesive formulations to support sustainability goals and compliance with strict waste-management standards.
Competitive Landscape of Wash-Off Label Market

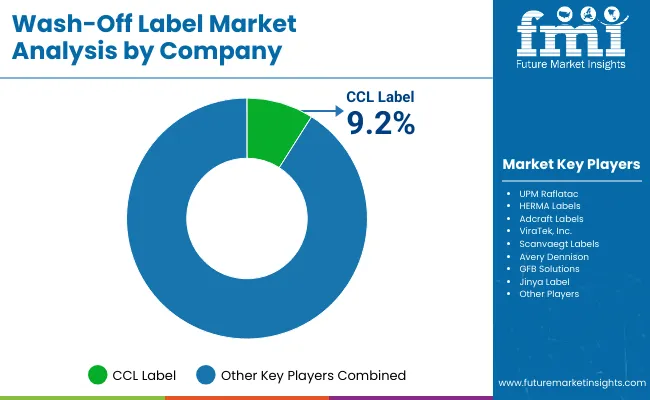
Wash Off Label Market By Company

The market is moderately fragmented with leaders including CCL Label, UPM Raflatac, HERMA Labels, Adcraft Labels, ViraTek Inc., Scanvaegt Labels, Avery Dennison Corporation, GFB Solutions and Jinya Label. Global leaders like CCL Label, UPM Raflatac, Avery Dennison, and HERMA invest in recyclable label films, PFAS-free adhesives, and large-scale production. Partnerships with beverage and FMCG giants drive growth.

Regional players including Adcraft Labels, ViraTek Inc., and Jinya Label compete with customization and local supply advantages. Emerging companies like GFB Solutions and Labelprint.com focus on innovation and regional service. Competition centers on recyclability claims, certification compliance, and automation readiness, ensuring wash-off labels remain core to sustainable packaging strategies.

Key Developments

  • In 2024, Avery Dennison Corporation Expanded its CleanFlake technology portfolio to improve PET recycling efficiency and compliance with EU recyclability mandates.
  • In 2023, UPM Raflatac Launched RW85C wash-off adhesive in Europe, designed for PET bottle recycling and circular packaging compliance.

Key Companies

  • CCL Label
  • UPM Raflatac
  • HERMA Labels
  • Adcraft Labels
  • ViraTek, Inc.
  • Scanvaegt Labels
  • Avery Dennison
  • GFB Solutions
  • Jinya Label

Scope of the Report

Item Value
Quantitative Units USD 1.3 Billion
By Material Type PP, PET, PE, Paper-Based, Biodegradable
By Adhesive Type Water-Based, Hot-Melt, Solvent-Based, Acrylic
By Printing Technology Flexographic, Digital, Offset, Gravure
By Application Beverage Bottles, Food Jars, Cosmetics, Pharmaceuticals, Household
By End-Use Industry Food & Beverages, Pharmaceuticals & Healthcare, Cosmetics & Personal Care, Household & Cleaning, Retail & E-commerce
Key Companies Profiled CCL Label, UPM Raflatac, HERMA Labels, Adcraft Labels, ViraTek Inc., Scanvaegt Labels, Avery Dennison Corporation, GFB Solutions, Jinya Label
Additional Attributes Growth driven by sustainability mandates, recyclability targets, and beverage packaging demand.

Key Segmentation

By Material Type:

  • Polypropylene (PP)
  • Polyethylene Terephthalate (PET)
  • Polyethylene (PE)
  • Paper-Based Wash-Off Labels
  • Biodegradable/Compostable Materials

By Adhesive Type:

  • Water-Based Adhesives
  • Hot-Melt Adhesives
  • Solvent-Based Adhesives
  • Acrylic Adhesives

By Printing Technology:

  • Flexographic Printing
  • Digital Printing
  • Offset Printing
  • Gravure Printing

By Application:

  • Beverage Bottles
  • Food Jars and Containers
  • Personal Care and Cosmetics Packaging
  • Pharmaceutical Packaging
  • Household Product Packaging

By End-Use Industry:

  • Food and Beverages
  • Pharmaceuticals and Healthcare
  • Cosmetics and Personal Care
  • Household and Cleaning Products
  • Retail and E-commerce

By Region:

  • North America
  • Europe
  • Asia-Pacific
  • Latin America
  • Middle East & Africa

Table of Content

  1. Executive Summary
    • Global Market Outlook
    • Demand-side Trends
    • Supply-side Trends
    • Technology Roadmap Analysis
    • Analysis and Recommendations
  2. Market Overview
    • Market Coverage / Taxonomy
    • Market Definition / Scope / Limitations
  3. Market Background
    • Market Dynamics
      • Drivers
      • Restraints
      • Opportunity
      • Trends
    • Scenario Forecast
      • Demand in Optimistic Scenario
      • Demand in Likely Scenario
      • Demand in Conservative Scenario
    • Opportunity Map Analysis
    • Product Life Cycle Analysis
    • Supply Chain Analysis
      • Supply Side Participants and their Roles
        • Producers
        • Mid-Level Participants (Traders/ Agents/ Brokers)
        • Wholesalers and Distributors
      • Value Added and Value Created at Node in the Supply Chain
      • List of Raw Material Suppliers
      • List of Existing and Potential Buyer’s
    • Investment Feasibility Matrix
    • Value Chain Analysis
      • Profit Margin Analysis
      • Wholesalers and Distributors
      • Retailers
    • PESTLE and Porter’s Analysis
    • Regulatory Landscape
      • By Key Regions
      • By Key Countries
    • Regional Parent Market Outlook
    • Production and Consumption Statistics
    • Import and Export Statistics
  4. Global Market Analysis 2020 to 2024 and Forecast, 2025 to 2035
    • Historical Market Size Value (USD Billion) & Volume (Units) Analysis, 2020 to 2024
    • Current and Future Market Size Value (USD Billion) & Volume (Units) Projections, 2025 to 2035
      • Y-o-Y Growth Trend Analysis
      • Absolute $ Opportunity Analysis
  5. Global Market Pricing Analysis 2020 to 2024 and Forecast 2025 to 2035
  6. Global Market Analysis 2020 to 2024 and Forecast 2025 to 2035, By Material Type
    • Introduction / Key Findings
    • Historical Market Size Value (USD Billion) & Volume (Units) Analysis By Material Type, 2020 to 2024
    • Current and Future Market Size Value (USD Billion) & Volume (Units) Analysis and Forecast By Material Type, 2025 to 2035
      • Polypropylene (PP)
      • Polyethylene Terephthalate (PET)
      • Polyethylene (PE)
      • Paper-Baseds
      • Biodegradable/Compostable Materials
    • Y-o-Y Growth Trend Analysis By Material Type, 2020 to 2024
    • Absolute $ Opportunity Analysis By Material Type, 2025 to 2035
  7. Global Market Analysis 2020 to 2024 and Forecast 2025 to 2035, By Adhesive Type
    • Introduction / Key Findings
    • Historical Market Size Value (USD Billion) & Volume (Units) Analysis By Adhesive Type, 2020 to 2024
    • Current and Future Market Size Value (USD Billion) & Volume (Units) Analysis and Forecast By Adhesive Type, 2025 to 2035
      • Water-Based Adhesives
      • Hot-Melt Adhesives
      • Solvent-Based Adhesives
      • Acrylic Adhesives
    • Y-o-Y Growth Trend Analysis By Adhesive Type, 2020 to 2024
    • Absolute $ Opportunity Analysis By Adhesive Type, 2025 to 2035
  8. Global Market Analysis 2020 to 2024 and Forecast 2025 to 2035, By Printing Technology
    • Introduction / Key Findings
    • Historical Market Size Value (USD Billion) & Volume (Units) Analysis By Printing Technology, 2020 to 2024
    • Current and Future Market Size Value (USD Billion) & Volume (Units) Analysis and Forecast By Printing Technology, 2025 to 2035
      • Flexographic Printing
      • Digital Printing
      • Offset Printing
      • Gravure Printing
    • Y-o-Y Growth Trend Analysis By Printing Technology, 2020 to 2024
    • Absolute $ Opportunity Analysis By Printing Technology, 2025 to 2035
  9. Global Market Analysis 2020 to 2024 and Forecast 2025 to 2035, By Application
    • Introduction / Key Findings
    • Historical Market Size Value (USD Billion) & Volume (Units) Analysis By Application, 2020 to 2024
    • Current and Future Market Size Value (USD Billion) & Volume (Units) Analysis and Forecast By Application, 2025 to 2035
      • Beverage Bottles
      • Food Jars and Containers
      • Personal Care and Cosmetics Packaging
      • Pharmaceutical Packaging
      • Household Product Packaging
    • Y-o-Y Growth Trend Analysis By Application, 2020 to 2024
    • Absolute $ Opportunity Analysis By Application, 2025 to 2035
  10. Global Market Analysis 2020 to 2024 and Forecast 2025 to 2035, By End-Use Industry
    • Introduction / Key Findings
    • Historical Market Size Value (USD Billion) & Volume (Units) Analysis By End-Use Industry, 2020 to 2024
    • Current and Future Market Size Value (USD Billion) & Volume (Units) Analysis and Forecast By End-Use Industry, 2025 to 2035
      • Food and Beverages
      • Pharmaceuticals and Healthcare
      • Cosmetics and Personal Care
      • Household and Cleaning Products
      • Retail and E-commerce
    • Y-o-Y Growth Trend Analysis By End-Use Industry, 2020 to 2024
    • Absolute $ Opportunity Analysis By End-Use Industry, 2025 to 2035
  11. Global Market Analysis 2020 to 2024 and Forecast 2025 to 2035, By Region
    • Introduction
    • Historical Market Size Value (USD Billion) & Volume (Units) Analysis By Region, 2020 to 2024
    • Current Market Size Value (USD Billion) & Volume (Units) Analysis and Forecast By Region, 2025 to 2035
      • North America
      • Latin America
      • Europe
      • East Asia
      • Asia- Pacific
      • MEA
    • Market Attractiveness Analysis By Region
  12. North America Market Analysis 2020 to 2024 and Forecast 2025 to 2035, By Country
    • Historical Market Size Value (USD Billion) & Volume (Units) Trend Analysis By Market Taxonomy, 2020 to 2024
    • Market Size Value (USD Billion) & Volume (Units) Forecast By Market Taxonomy, 2025 to 2035
      • By Country
        • USA
        • Canada
      • By Material Type
      • By Adhesive Type
      • By Printing Technology
      • By Application
      • By End-Use Industry
    • Market Attractiveness Analysis
      • By Country
      • By Material Type
      • By Adhesive Type
      • By Printing Technology
      • By Application
      • By End-Use Industry
    • Key Takeaways
  13. Latin America Market Analysis 2020 to 2024 and Forecast 2025 to 2035, By Country
    • Historical Market Size Value (USD Billion) & Volume (Units) Trend Analysis By Market Taxonomy, 2020 to 2024
    • Market Size Value (USD Billion) & Volume (Units) Forecast By Market Taxonomy, 2025 to 2035
      • By Country
        • Brazil
        • Mexico
        • Argentina
        • Chile
        • Peru
        • Rest of Latin America
      • By Material Type
      • By Adhesive Type
      • By Printing Technology
      • By Application
      • By End-Use Industry
    • Market Attractiveness Analysis
      • By Country
      • By Material Type
      • By Adhesive Type
      • By Printing Technology
      • By Application
      • By End-Use Industry
    • Key Takeaways
  14. Europe Market Analysis 2020 to 2024 and Forecast 2025 to 2035, By Country
    • Historical Market Size Value (USD Billion) & Volume (Units) Trend Analysis By Market Taxonomy, 2020 to 2024
    • Market Size Value (USD Billion) & Volume (Units) Forecast By Market Taxonomy, 2025 to 2035
      • By Country
        • Germany
        • Italy
        • France
        • UK
        • Spain
        • Russia
        • BENELUX
        • Rest of Europe
      • By Material Type
      • By Adhesive Type
      • By Printing Technology
      • By Application
      • By End-Use Industry
    • Market Attractiveness Analysis
      • By Country
      • By Material Type
      • By Adhesive Type
      • By Printing Technology
      • By Application
      • By End-Use Industry
    • Key Takeaways
  15. East Asia Market Analysis 2020 to 2024 and Forecast 2025 to 2035, By Country
    • Historical Market Size Value (USD Billion) & Volume (Units) Trend Analysis By Market Taxonomy, 2020 to 2024
    • Market Size Value (USD Billion) & Volume (Units) Forecast By Market Taxonomy, 2025 to 2035
      • By Country
        • China
        • Japan
        • South Korea
      • By Material Type
      • By Adhesive Type
      • By Printing Technology
      • By Application
      • By End-Use Industry
    • Market Attractiveness Analysis
      • By Country
      • By Material Type
      • By Adhesive Type
      • By Printing Technology
      • By Application
      • By End-Use Industry
    • Key Takeaways
  16. Asia- Pacific Market Analysis 2020 to 2024 and Forecast 2025 to 2035, By Country
    • Historical Market Size Value (USD Billion) & Volume (Units) Trend Analysis By Market Taxonomy, 2020 to 2024
    • Market Size Value (USD Billion) & Volume (Units) Forecast By Market Taxonomy, 2025 to 2035
      • By Country
        • India
        • Thailand
        • Malaysia
        • Indonesia
        • China
        • Japan
        • South Korea
        • Rest of Asia pacific
      • By Material Type
      • By Adhesive Type
      • By Printing Technology
      • By Application
      • By End-Use Industry
    • Market Attractiveness Analysis
      • By Country
      • By Material Type
      • By Adhesive Type
      • By Printing Technology
      • By Application
      • By End-Use Industry
    • Key Takeaways
  17. MEA Market Analysis 2020 to 2024 and Forecast 2025 to 2035, By Country
    • Historical Market Size Value (USD Billion) & Volume (Units) Trend Analysis By Market Taxonomy, 2020 to 2024
    • Market Size Value (USD Billion) & Volume (Units) Forecast By Market Taxonomy, 2025 to 2035
      • By Country
        • GCC
        • Rest of MEA
      • By Material Type
      • By Adhesive Type
      • By Printing Technology
      • By Application
      • By End-Use Industry
    • Market Attractiveness Analysis
      • By Country
      • By Material Type
      • By Adhesive Type
      • By Printing Technology
      • By Application
      • By End-Use Industry
    • Key Takeaways
  18. Key Countries Market Analysis
    • USA
      • Pricing Analysis
      • Market Share Analysis, 2024
        • By Material Type
        • By Adhesive Type
        • By Printing Technology
        • By Application
        • By End-Use Industry
    • Canada
      • Pricing Analysis
      • Market Share Analysis, 2024
        • By Material Type
        • By Adhesive Type
        • By Printing Technology
        • By Application
        • By End-Use Industry
    • Brazil
      • Pricing Analysis
      • Market Share Analysis, 2024
        • By Material Type
        • By Adhesive Type
        • By Printing Technology
        • By Application
        • By End-Use Industry
    • Mexico
      • Pricing Analysis
      • Market Share Analysis, 2024
        • By Material Type
        • By Adhesive Type
        • By Printing Technology
        • By Application
        • By End-Use Industry
    • Argentina
      • Pricing Analysis
      • Market Share Analysis, 2024
        • By Material Type
        • By Adhesive Type
        • By Printing Technology
        • By Application
        • By End-Use Industry
  19. Market Structure Analysis
    • Competition Dashboard
    • Competition Benchmarking
    • Market Share Analysis of Top Players
      • By Regional
      • By Material Type
      • By Adhesive Type
      • By Printing Technology
      • By Application
      • By End-Use Industry
  20. Competition Analysis
    • Competition Deep Dive
      • CCL Label
        • Overview
        • Product Portfolio
        • Profitability by Market Segments (Product/Age /Sales Channel/Region)
        • Sales Footprint
        • Strategy Overview
          • Marketing Strategy
          • Product Strategy
          • Channel Strategy
      • UPM Raflatac
        • Overview
        • Product Portfolio
        • Profitability by Market Segments (Product/Age /Sales Channel/Region)
        • Sales Footprint
        • Strategy Overview
          • Marketing Strategy
          • Product Strategy
          • Channel Strategy
      • HERMA Labels
        • Overview
        • Product Portfolio
        • Profitability by Market Segments (Product/Age /Sales Channel/Region)
        • Sales Footprint
        • Strategy Overview
          • Marketing Strategy
          • Product Strategy
          • Channel Strategy
      • Adcraft Labels
        • Overview
        • Product Portfolio
        • Profitability by Market Segments (Product/Age /Sales Channel/Region)
        • Sales Footprint
        • Strategy Overview
          • Marketing Strategy
          • Product Strategy
          • Channel Strategy
      • ViraTek, Inc.
        • Overview
        • Product Portfolio
        • Profitability by Market Segments (Product/Age /Sales Channel/Region)
        • Sales Footprint
        • Strategy Overview
          • Marketing Strategy
          • Product Strategy
          • Channel Strategy
      • Scanvaegt Labels
        • Overview
        • Product Portfolio
        • Profitability by Market Segments (Product/Age /Sales Channel/Region)
        • Sales Footprint
        • Strategy Overview
          • Marketing Strategy
          • Product Strategy
          • Channel Strategy
      • Avery Dennison
        • Overview
        • Product Portfolio
        • Profitability by Market Segments (Product/Age /Sales Channel/Region)
        • Sales Footprint
        • Strategy Overview
          • Marketing Strategy
          • Product Strategy
          • Channel Strategy
      • GFB Solutions
        • Overview
        • Product Portfolio
        • Profitability by Market Segments (Product/Age /Sales Channel/Region)
        • Sales Footprint
        • Strategy Overview
          • Marketing Strategy
          • Product Strategy
          • Channel Strategy
      • Jinya Label
        • Overview
        • Product Portfolio
        • Profitability by Market Segments (Product/Age /Sales Channel/Region)
        • Sales Footprint
        • Strategy Overview
          • Marketing Strategy
          • Product Strategy
          • Channel Strategy
      • Labelprint.com
        • Overview
        • Product Portfolio
        • Profitability by Market Segments (Product/Age /Sales Channel/Region)
        • Sales Footprint
        • Strategy Overview
          • Marketing Strategy
          • Product Strategy
          • Channel Strategy
  21. Assumptions & Acronyms Used
  22. Research Methodology

List of Tables

  • Table 1: Global Market Value (USD Billion) Forecast by Region, 2020-2035
  • Table 2: Global Market Volume (Units) Forecast by Region, 2020-2035
  • Table 3: Global Market Value (USD Billion) Forecast by Material Type, 2020-2035
  • Table 4: Global Market Volume (Units) Forecast by Material Type, 2020-2035
  • Table 5: Global Market Value (USD Billion) Forecast by Adhesive Type, 2020-2035
  • Table 6: Global Market Volume (Units) Forecast by Adhesive Type, 2020-2035
  • Table 7: Global Market Value (USD Billion) Forecast by Printing Technology, 2020-2035
  • Table 8: Global Market Volume (Units) Forecast by Printing Technology, 2020-2035
  • Table 9: Global Market Value (USD Billion) Forecast by Application, 2020-2035
  • Table 10: Global Market Volume (Units) Forecast by Application, 2020-2035
  • Table 11: Global Market Value (USD Billion) Forecast by End-Use Industry, 2020-2035
  • Table 12: Global Market Volume (Units) Forecast by End-Use Industry, 2020-2035
  • Table 13: North America Market Value (USD Billion) Forecast by Country, 2020-2035
  • Table 14: North America Market Volume (Units) Forecast by Country, 2020-2035
  • Table 15: North America Market Value (USD Billion) Forecast by Material Type, 2020-2035
  • Table 16: North America Market Volume (Units) Forecast by Material Type, 2020-2035
  • Table 17: North America Market Value (USD Billion) Forecast by Adhesive Type, 2020-2035
  • Table 18: North America Market Volume (Units) Forecast by Adhesive Type, 2020-2035
  • Table 19: North America Market Value (USD Billion) Forecast by Printing Technology, 2020-2035
  • Table 20: North America Market Volume (Units) Forecast by Printing Technology, 2020-2035
  • Table 21: North America Market Value (USD Billion) Forecast by Application, 2020-2035
  • Table 22: North America Market Volume (Units) Forecast by Application, 2020-2035
  • Table 23: North America Market Value (USD Billion) Forecast by End-Use Industry, 2020-2035
  • Table 24: North America Market Volume (Units) Forecast by End-Use Industry, 2020-2035
  • Table 25: Latin America Market Value (USD Billion) Forecast by Country, 2020-2035
  • Table 26: Latin America Market Volume (Units) Forecast by Country, 2020-2035
  • Table 27: Latin America Market Value (USD Billion) Forecast by Material Type, 2020-2035
  • Table 28: Latin America Market Volume (Units) Forecast by Material Type, 2020-2035
  • Table 29: Latin America Market Value (USD Billion) Forecast by Adhesive Type, 2020-2035
  • Table 30: Latin America Market Volume (Units) Forecast by Adhesive Type, 2020-2035
  • Table 31: Latin America Market Value (USD Billion) Forecast by Printing Technology, 2020-2035
  • Table 32: Latin America Market Volume (Units) Forecast by Printing Technology, 2020-2035
  • Table 33: Latin America Market Value (USD Billion) Forecast by Application, 2020-2035
  • Table 34: Latin America Market Volume (Units) Forecast by Application, 2020-2035
  • Table 35: Latin America Market Value (USD Billion) Forecast by End-Use Industry, 2020-2035
  • Table 36: Latin America Market Volume (Units) Forecast by End-Use Industry, 2020-2035
  • Table 37: Europe Market Value (USD Billion) Forecast by Country, 2020-2035
  • Table 38: Europe Market Volume (Units) Forecast by Country, 2020-2035
  • Table 39: Europe Market Value (USD Billion) Forecast by Material Type, 2020-2035
  • Table 40: Europe Market Volume (Units) Forecast by Material Type, 2020-2035
  • Table 41: Europe Market Value (USD Billion) Forecast by Adhesive Type, 2020-2035
  • Table 42: Europe Market Volume (Units) Forecast by Adhesive Type, 2020-2035
  • Table 43: Europe Market Value (USD Billion) Forecast by Printing Technology, 2020-2035
  • Table 44: Europe Market Volume (Units) Forecast by Printing Technology, 2020-2035
  • Table 45: Europe Market Value (USD Billion) Forecast by Application, 2020-2035
  • Table 46: Europe Market Volume (Units) Forecast by Application, 2020-2035
  • Table 47: Europe Market Value (USD Billion) Forecast by End-Use Industry, 2020-2035
  • Table 48: Europe Market Volume (Units) Forecast by End-Use Industry, 2020-2035
  • Table 49: East Asia Market Value (USD Billion) Forecast by Country, 2020-2035
  • Table 50: East Asia Market Volume (Units) Forecast by Country, 2020-2035
  • Table 51: East Asia Market Value (USD Billion) Forecast by Material Type, 2020-2035
  • Table 52: East Asia Market Volume (Units) Forecast by Material Type, 2020-2035
  • Table 53: East Asia Market Value (USD Billion) Forecast by Adhesive Type, 2020-2035
  • Table 54: East Asia Market Volume (Units) Forecast by Adhesive Type, 2020-2035
  • Table 55: East Asia Market Value (USD Billion) Forecast by Printing Technology, 2020-2035
  • Table 56: East Asia Market Volume (Units) Forecast by Printing Technology, 2020-2035
  • Table 57: East Asia Market Value (USD Billion) Forecast by Application, 2020-2035
  • Table 58: East Asia Market Volume (Units) Forecast by Application, 2020-2035
  • Table 59: East Asia Market Value (USD Billion) Forecast by End-Use Industry, 2020-2035
  • Table 60: East Asia Market Volume (Units) Forecast by End-Use Industry, 2020-2035
  • Table 61: Asia- Pacific Market Value (USD Billion) Forecast by Country, 2020-2035
  • Table 62: Asia- Pacific Market Volume (Units) Forecast by Country, 2020-2035
  • Table 63: Asia- Pacific Market Value (USD Billion) Forecast by Material Type, 2020-2035
  • Table 64: Asia- Pacific Market Volume (Units) Forecast by Material Type, 2020-2035
  • Table 65: Asia- Pacific Market Value (USD Billion) Forecast by Adhesive Type, 2020-2035
  • Table 66: Asia- Pacific Market Volume (Units) Forecast by Adhesive Type, 2020-2035
  • Table 67: Asia- Pacific Market Value (USD Billion) Forecast by Printing Technology, 2020-2035
  • Table 68: Asia- Pacific Market Volume (Units) Forecast by Printing Technology, 2020-2035
  • Table 69: Asia- Pacific Market Value (USD Billion) Forecast by Application, 2020-2035
  • Table 70: Asia- Pacific Market Volume (Units) Forecast by Application, 2020-2035
  • Table 71: Asia- Pacific Market Value (USD Billion) Forecast by End-Use Industry, 2020-2035
  • Table 72: Asia- Pacific Market Volume (Units) Forecast by End-Use Industry, 2020-2035
  • Table 73: MEA Market Value (USD Billion) Forecast by Country, 2020-2035
  • Table 74: MEA Market Volume (Units) Forecast by Country, 2020-2035
  • Table 75: MEA Market Value (USD Billion) Forecast by Material Type, 2020-2035
  • Table 76: MEA Market Volume (Units) Forecast by Material Type, 2020-2035
  • Table 77: MEA Market Value (USD Billion) Forecast by Adhesive Type, 2020-2035
  • Table 78: MEA Market Volume (Units) Forecast by Adhesive Type, 2020-2035
  • Table 79: MEA Market Value (USD Billion) Forecast by Printing Technology, 2020-2035
  • Table 80: MEA Market Volume (Units) Forecast by Printing Technology, 2020-2035
  • Table 81: MEA Market Value (USD Billion) Forecast by Application, 2020-2035
  • Table 82: MEA Market Volume (Units) Forecast by Application, 2020-2035
  • Table 83: MEA Market Value (USD Billion) Forecast by End-Use Industry, 2020-2035
  • Table 84: MEA Market Volume (Units) Forecast by End-Use Industry, 2020-2035

List of Figures

  • Figure 1: Global Market Volume (Units) Forecast 2020-2035
  • Figure 2: Global Market Pricing Analysis
  • Figure 3: Global Market Value (USD Billion) Forecast 2020-2035
  • Figure 4: Global Market Value Share and BPS Analysis by Material Type, 2025 and 2035
  • Figure 5: Global Market Y-o-Y Growth Comparison by Material Type, 2025-2035
  • Figure 6: Global Market Attractiveness Analysis by Material Type
  • Figure 7: Global Market Value Share and BPS Analysis by Adhesive Type, 2025 and 2035
  • Figure 8: Global Market Y-o-Y Growth Comparison by Adhesive Type, 2025-2035
  • Figure 9: Global Market Attractiveness Analysis by Adhesive Type
  • Figure 10: Global Market Value Share and BPS Analysis by Printing Technology, 2025 and 2035
  • Figure 11: Global Market Y-o-Y Growth Comparison by Printing Technology, 2025-2035
  • Figure 12: Global Market Attractiveness Analysis by Printing Technology
  • Figure 13: Global Market Value Share and BPS Analysis by Application, 2025 and 2035
  • Figure 14: Global Market Y-o-Y Growth Comparison by Application, 2025-2035
  • Figure 15: Global Market Attractiveness Analysis by Application
  • Figure 16: Global Market Value Share and BPS Analysis by End-Use Industry, 2025 and 2035
  • Figure 17: Global Market Y-o-Y Growth Comparison by End-Use Industry, 2025-2035
  • Figure 18: Global Market Attractiveness Analysis by End-Use Industry
  • Figure 19: Global Market Value (USD Billion) Share and BPS Analysis by Region, 2025 and 2035
  • Figure 20: Global Market Y-o-Y Growth Comparison by Region, 2025-2035
  • Figure 21: Global Market Attractiveness Analysis by Region
  • Figure 22: North America Market Incremental $ Opportunity, 2025-2035
  • Figure 23: Latin America Market Incremental $ Opportunity, 2025-2035
  • Figure 24: Europe Market Incremental $ Opportunity, 2025-2035
  • Figure 25: East Asia Market Incremental $ Opportunity, 2025-2035
  • Figure 26: Asia- Pacific Market Incremental $ Opportunity, 2025-2035
  • Figure 27: MEA Market Incremental $ Opportunity, 2025-2035
  • Figure 28: North America Market Value Share and BPS Analysis by Country, 2025 and 2035
  • Figure 29: North America Market Value Share and BPS Analysis by Material Type, 2025 and 2035
  • Figure 30: North America Market Y-o-Y Growth Comparison by Material Type, 2025-2035
  • Figure 31: North America Market Attractiveness Analysis by Material Type
  • Figure 32: North America Market Value Share and BPS Analysis by Adhesive Type, 2025 and 2035
  • Figure 33: North America Market Y-o-Y Growth Comparison by Adhesive Type, 2025-2035
  • Figure 34: North America Market Attractiveness Analysis by Adhesive Type
  • Figure 35: North America Market Value Share and BPS Analysis by Printing Technology, 2025 and 2035
  • Figure 36: North America Market Y-o-Y Growth Comparison by Printing Technology, 2025-2035
  • Figure 37: North America Market Attractiveness Analysis by Printing Technology
  • Figure 38: North America Market Value Share and BPS Analysis by Application, 2025 and 2035
  • Figure 39: North America Market Y-o-Y Growth Comparison by Application, 2025-2035
  • Figure 40: North America Market Attractiveness Analysis by Application
  • Figure 41: North America Market Value Share and BPS Analysis by End-Use Industry, 2025 and 2035
  • Figure 42: North America Market Y-o-Y Growth Comparison by End-Use Industry, 2025-2035
  • Figure 43: North America Market Attractiveness Analysis by End-Use Industry
  • Figure 44: Latin America Market Value Share and BPS Analysis by Country, 2025 and 2035
  • Figure 45: Latin America Market Value Share and BPS Analysis by Material Type, 2025 and 2035
  • Figure 46: Latin America Market Y-o-Y Growth Comparison by Material Type, 2025-2035
  • Figure 47: Latin America Market Attractiveness Analysis by Material Type
  • Figure 48: Latin America Market Value Share and BPS Analysis by Adhesive Type, 2025 and 2035
  • Figure 49: Latin America Market Y-o-Y Growth Comparison by Adhesive Type, 2025-2035
  • Figure 50: Latin America Market Attractiveness Analysis by Adhesive Type
  • Figure 51: Latin America Market Value Share and BPS Analysis by Printing Technology, 2025 and 2035
  • Figure 52: Latin America Market Y-o-Y Growth Comparison by Printing Technology, 2025-2035
  • Figure 53: Latin America Market Attractiveness Analysis by Printing Technology
  • Figure 54: Latin America Market Value Share and BPS Analysis by Application, 2025 and 2035
  • Figure 55: Latin America Market Y-o-Y Growth Comparison by Application, 2025-2035
  • Figure 56: Latin America Market Attractiveness Analysis by Application
  • Figure 57: Latin America Market Value Share and BPS Analysis by End-Use Industry, 2025 and 2035
  • Figure 58: Latin America Market Y-o-Y Growth Comparison by End-Use Industry, 2025-2035
  • Figure 59: Latin America Market Attractiveness Analysis by End-Use Industry
  • Figure 60: Europe Market Value Share and BPS Analysis by Country, 2025 and 2035
  • Figure 61: Europe Market Value Share and BPS Analysis by Material Type, 2025 and 2035
  • Figure 62: Europe Market Y-o-Y Growth Comparison by Material Type, 2025-2035
  • Figure 63: Europe Market Attractiveness Analysis by Material Type
  • Figure 64: Europe Market Value Share and BPS Analysis by Adhesive Type, 2025 and 2035
  • Figure 65: Europe Market Y-o-Y Growth Comparison by Adhesive Type, 2025-2035
  • Figure 66: Europe Market Attractiveness Analysis by Adhesive Type
  • Figure 67: Europe Market Value Share and BPS Analysis by Printing Technology, 2025 and 2035
  • Figure 68: Europe Market Y-o-Y Growth Comparison by Printing Technology, 2025-2035
  • Figure 69: Europe Market Attractiveness Analysis by Printing Technology
  • Figure 70: Europe Market Value Share and BPS Analysis by Application, 2025 and 2035
  • Figure 71: Europe Market Y-o-Y Growth Comparison by Application, 2025-2035
  • Figure 72: Europe Market Attractiveness Analysis by Application
  • Figure 73: Europe Market Value Share and BPS Analysis by End-Use Industry, 2025 and 2035
  • Figure 74: Europe Market Y-o-Y Growth Comparison by End-Use Industry, 2025-2035
  • Figure 75: Europe Market Attractiveness Analysis by End-Use Industry
  • Figure 76: East Asia Market Value Share and BPS Analysis by Country, 2025 and 2035
  • Figure 77: East Asia Market Value Share and BPS Analysis by Material Type, 2025 and 2035
  • Figure 78: East Asia Market Y-o-Y Growth Comparison by Material Type, 2025-2035
  • Figure 79: East Asia Market Attractiveness Analysis by Material Type
  • Figure 80: East Asia Market Value Share and BPS Analysis by Adhesive Type, 2025 and 2035
  • Figure 81: East Asia Market Y-o-Y Growth Comparison by Adhesive Type, 2025-2035
  • Figure 82: East Asia Market Attractiveness Analysis by Adhesive Type
  • Figure 83: East Asia Market Value Share and BPS Analysis by Printing Technology, 2025 and 2035
  • Figure 84: East Asia Market Y-o-Y Growth Comparison by Printing Technology, 2025-2035
  • Figure 85: East Asia Market Attractiveness Analysis by Printing Technology
  • Figure 86: East Asia Market Value Share and BPS Analysis by Application, 2025 and 2035
  • Figure 87: East Asia Market Y-o-Y Growth Comparison by Application, 2025-2035
  • Figure 88: East Asia Market Attractiveness Analysis by Application
  • Figure 89: East Asia Market Value Share and BPS Analysis by End-Use Industry, 2025 and 2035
  • Figure 90: East Asia Market Y-o-Y Growth Comparison by End-Use Industry, 2025-2035
  • Figure 91: East Asia Market Attractiveness Analysis by End-Use Industry
  • Figure 92: Asia- Pacific Market Value Share and BPS Analysis by Country, 2025 and 2035
  • Figure 93: Asia- Pacific Market Value Share and BPS Analysis by Material Type, 2025 and 2035
  • Figure 94: Asia- Pacific Market Y-o-Y Growth Comparison by Material Type, 2025-2035
  • Figure 95: Asia- Pacific Market Attractiveness Analysis by Material Type
  • Figure 96: Asia- Pacific Market Value Share and BPS Analysis by Adhesive Type, 2025 and 2035
  • Figure 97: Asia- Pacific Market Y-o-Y Growth Comparison by Adhesive Type, 2025-2035
  • Figure 98: Asia- Pacific Market Attractiveness Analysis by Adhesive Type
  • Figure 99: Asia- Pacific Market Value Share and BPS Analysis by Printing Technology, 2025 and 2035
  • Figure 100: Asia- Pacific Market Y-o-Y Growth Comparison by Printing Technology, 2025-2035
  • Figure 101: Asia- Pacific Market Attractiveness Analysis by Printing Technology
  • Figure 102: Asia- Pacific Market Value Share and BPS Analysis by Application, 2025 and 2035
  • Figure 103: Asia- Pacific Market Y-o-Y Growth Comparison by Application, 2025-2035
  • Figure 104: Asia- Pacific Market Attractiveness Analysis by Application
  • Figure 105: Asia- Pacific Market Value Share and BPS Analysis by End-Use Industry, 2025 and 2035
  • Figure 106: Asia- Pacific Market Y-o-Y Growth Comparison by End-Use Industry, 2025-2035
  • Figure 107: Asia- Pacific Market Attractiveness Analysis by End-Use Industry
  • Figure 108: MEA Market Value Share and BPS Analysis by Country, 2025 and 2035
  • Figure 109: MEA Market Value Share and BPS Analysis by Material Type, 2025 and 2035
  • Figure 110: MEA Market Y-o-Y Growth Comparison by Material Type, 2025-2035
  • Figure 111: MEA Market Attractiveness Analysis by Material Type
  • Figure 112: MEA Market Value Share and BPS Analysis by Adhesive Type, 2025 and 2035
  • Figure 113: MEA Market Y-o-Y Growth Comparison by Adhesive Type, 2025-2035
  • Figure 114: MEA Market Attractiveness Analysis by Adhesive Type
  • Figure 115: MEA Market Value Share and BPS Analysis by Printing Technology, 2025 and 2035
  • Figure 116: MEA Market Y-o-Y Growth Comparison by Printing Technology, 2025-2035
  • Figure 117: MEA Market Attractiveness Analysis by Printing Technology
  • Figure 118: MEA Market Value Share and BPS Analysis by Application, 2025 and 2035
  • Figure 119: MEA Market Y-o-Y Growth Comparison by Application, 2025-2035
  • Figure 120: MEA Market Attractiveness Analysis by Application
  • Figure 121: MEA Market Value Share and BPS Analysis by End-Use Industry, 2025 and 2035
  • Figure 122: MEA Market Y-o-Y Growth Comparison by End-Use Industry, 2025-2035
  • Figure 123: MEA Market Attractiveness Analysis by End-Use Industry
  • Figure 124: Global Market - Tier Structure Analysis
  • Figure 125: Global Market - Company Share Analysis

Frequently Asked Questions

How big will the Wash-Off Label Market be in 2025?

The market will be valued at USD 1.3 billion in 2025.

What is the projected size of the Wash-Off Label Market by 2035?

The market will reach USD 2.5 billion by 2035.

What growth rate is expected for the Wash-Off Label Market between 2025 and 2035?

The market will grow at a CAGR of 6.6% during 2025-2035.

Which material type will lead the Wash-Off Label Market in 2025?

Polypropylene will lead with a 35.8% share in 2025.

Which adhesive type will dominate the Wash-Off Label Market in 2025?

Water-based adhesives will dominate with a 42.6% share in 2025.

Explore Similar Insights

Future Market Insights

Wash-Off Label Market

Chat With

MaRIA

Hi There, I am MaRIA, Your Market Research Intelligence Assistant. How may I help you?