Washable Flexographic Printing Plate Market Analysis - Size, Share, and Forecast Outlook 2025 to 2035

The washable flexographic printing plate market is anticipated to rise from USD 871.1 million in 2025 to USD 1,516.4 million by 2035, reflecting a CAGR of 5.7%. When evaluated against macroeconomic indicators, the elasticity of growth highlights how the industry responds to variables such as GDP expansion, trade flows, and shifts in manufacturing activity. Stronger economic performance stimulates demand for consumer goods, packaging, and labeling, which directly increases adoption of flexographic printing technologies. The periods of slower economic growth create measured demand but are balanced by ongoing replacement needs and compliance with environmental regulations favoring washable plates.
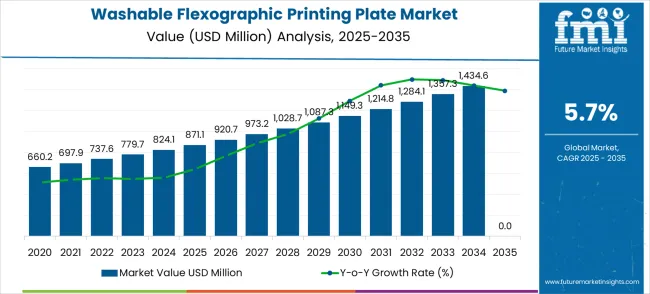
Quick Stats for Washable Flexographic Printing Plate Market

  • Washable Flexographic Printing Plate Market Value (2025): USD 871.1 million
  • Washable Flexographic Printing Plate Market Forecast Value (2035): USD 1,516.4 million
  • Washable Flexographic Printing Plate Market Forecast CAGR: 5.7%
  • Leading Application in Washable Flexographic Printing Plate Market: Food Packaging (60.0%)
  • Key Growth Regions in Washable Flexographic Printing Plate Market: Asia Pacific, North America, and Europe
  • Key Players in Washable Flexographic Printing Plate Market: TOYOBO, AV Flexologic, Asahi Photoproducts, Sumitomo Riko Company Limited, Flint Group, DUPONT

Washable Flexographic Printing Plate Market Market Value Analysis

Elasticity also reflects raw material pricing trends, energy costs, and capital expenditure cycles within the printing and packaging industries. High elasticity is visible when economic growth drives higher consumption, prompting faster adoption of cost-efficient and eco-friendly printing solutions. During weaker macroeconomic conditions, growth remains resilient due to regulatory pushes toward sustainable production practices and the cost savings washable plates provide over traditional alternatives. This interaction between macro drivers and sector-specific demand ensures that even in fluctuating environments, the market maintains forward momentum. The balance of cyclical influences and structural trends underscores the steady yet adaptive trajectory of this segment over the forecast horizon.

Washable Flexographic Printing Plate Market Key Takeaways

Metric Value
Estimated Value in (2025E) USD 871.1 million
Forecast Value in (2035F) USD 1,516.4 million
Forecast CAGR (2025 to 2035) 5.7%

The washable flexographic printing plate market is divided into food and beverage packaging (39%), pharmaceuticals and healthcare labeling (24%), household and personal care products (18%), industrial goods packaging (11%), and specialty printing applications including corrugated displays and promotional materials (8%). Food and beverage packaging holds the largest share as washable plates deliver sharp impressions and support quick turnaround in high-volume printing. Pharmaceuticals use them to ensure precise, compliant labeling. Household and personal care brands prefer washable plates for design flexibility and cleaner operations. Industrial packaging and specialty applications benefit from durability, consistent quality, and reduced downtime.

Ongoing innovations include eco-friendly resin formulations, faster plate-washing systems, and enhanced image resolution. Manufacturers are focusing on automated plate cleaning, higher plate durability, and compatibility with water-based inks to reduce environmental impact. Demand is expanding in flexible packaging, e-commerce-ready cartons, and specialty labels. Collaborations between plate makers, packaging converters, and brand owners drive tailored solutions for efficiency, clarity, and cost control, ensuring steady global adoption.

Why is the Washable Flexographic Printing Plate Market Growing?

Market expansion is being supported by the increasing global focus on sustainable printing practices and the corresponding need for eco-friendly printing solutions that can reduce waste generation and operational costs while maintaining superior print quality across various packaging and labeling applications. Modern printing facilities are increasingly focused on implementing sustainable solutions that can deliver consistent print results, minimize environmental impact, and provide cost-effective operations through extended plate lifecycles and reduced waste disposal requirements. Washable flexographic printing plates' proven ability to deliver excellent print quality, extended durability, and environmental sustainability makes them essential components for contemporary sustainable printing and packaging production applications.

Printing operators' preference for solutions that combine for innovative, sustainable printing technology implementations. The rising influence of sustainability reporting requirements and corporate environmental responsibility is also contributing to increased adoption of washable plates that can provide reliable printing solutions without compromising ecological performance or operational quality.

Segmental Analysis

The market is segmented by base material, application, and region. By base material, the market is divided into metal base, polyester base, and others. Based on application, the market is categorized into food packaging and label printing. Regionally, the market is divided into North America, Europe, East Asia, South Asia & Pacific, Latin America, and the Middle East & Africa.

By Base Material, the Polyester Base Segment Accounts for 52.0% Market Share

The polyester base segment is projected to account for 52.0% of the washable flexographic printing plate market in 2025, reaffirming its position as the leading base material category. Printing facilities increasingly utilize polyester-based washable plates for their superior flexibility, excellent chemical resistance, and optimal performance in high-volume printing applications across food packaging and label production. Polyester-based technology's established processing compatibility and consistent performance characteristics directly address the printing industry requirements for reliable print quality and operational efficiency in demanding production environments.

This base material segment forms the foundation of modern washable printing plate operations, as it represents the substrate material with the greatest versatility and established market demand across multiple printing applications and production requirements. Manufacturer investments in enhanced polyester formulations and surface treatment technologies continue to strengthen adoption among printing facilities. With printing companies prioritizing durability and print consistency, polyester-based washable plates align with both operational performance objectives and sustainability requirements, making them the central component of comprehensive sustainable printing strategies.
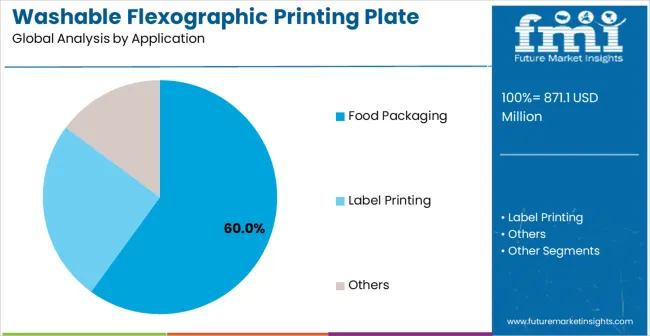
By Application, the Food Packaging Segment Accounts for 60.0% Market Share

Washable Flexographic Printing Plate Market Analysis By Application

Food packaging applications are projected to represent 60.0% of washable flexographic printing plate demand in 2025, underscoring their critical role as the primary consumers of sustainable printing solutions for food product packaging, consumer goods labeling, and retail packaging applications. Food packaging manufacturers prefer washable flexographic plates for their food-safe characteristics, superior print quality, and ability to enhance packaging production while reducing operational costs and environmental impact. Positioned as essential components for modern food packaging production, washable plates offer both printing advantages and sustainability benefits.

The segment is supported by continuous innovation in food packaging technologies and the growing availability of specialized plate formulations that enable superior print performance with enhanced food safety compliance and sustainability features. The food packaging manufacturers are investing in sustainable printing systems to support comprehensive packaging optimization and environmental responsibility initiatives. As food packaging regulations become more stringent and sustainability requirements increase, food packaging will continue to dominate the application market while supporting advanced sustainable printing technology utilization and production optimization strategies.

What are the Drivers, Restraints, and Key Trends of the Washable Flexographic Printing Plate Market?

The washable flexographic printing plate market is advancing steadily due to increasing sustainability requirements in printing operations and growing demand for cost-effective printing solutions that provide superior environmental performance and operational efficiency across diverse packaging and labeling applications. However, the market faces challenges, including higher initial investment costs, specialized washing equipment requirements, and the need for modified workflow processes and operator training. Innovation in plate materials and washing technologies continues to influence product development and market expansion patterns.

Expansion of Advanced Plate Materials and Sustainability Technologies

The growing adoption of advanced polymer materials and eco-friendly formulations is enabling manufacturers to produce sophisticated washable flexographic plates with enhanced durability, improved print quality, and superior washing characteristics. Advanced plate materials provide better performance while allowing extended reuse cycles and consistent print results across various printing applications. Manufacturers are increasingly recognizing the competitive advantages of advanced material technologies for product differentiation and premium market positioning.

Integration of Digital Workflow Solutions and Process Optimization

Modern washable flexographic plate producers are incorporating digital workflow management and automated washing systems to enhance operational efficiency, optimize plate lifecycle management, and provide comprehensive process monitoring and quality control. These technologies improve printing productivity while enabling new capabilities, including predictive maintenance and automated quality assurance. Advanced workflow integration also allows manufacturers to support premium service positioning and enhanced functionality beyond traditional plate manufacturing processes.
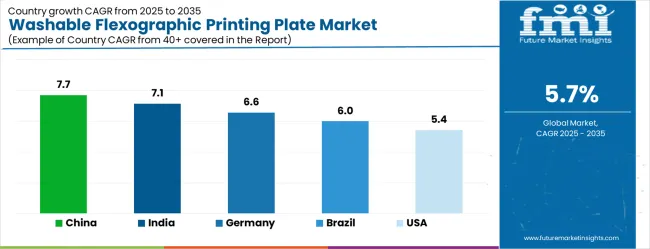
Analysis of the Washable Flexographic Printing Plate Market by Key Countries

Washable Flexographic Printing Plate Market Cagr Analysis By Country

Country CAGR (2025-2035)
China 7.7%
India 7.1%
Germany 6.6%
Brazil 6.0%
USA 5.4%
U.K. 4.8%
Japan 4.3%

The washable flexographic printing plate market is experiencing moderate growth globally, with China leading at a 7.7% CAGR through 2035, driven by the rapidly expanding packaging industry, growing environmental regulations, and significant investment in sustainable printing technology infrastructure. India follows at 7.1%, supported by industrial development, increasing packaging demand, and growing adoption of eco-friendly printing technologies in manufacturing facilities. Germany shows growth at 6.6%, prioritizing sustainability, innovation and premium printing equipment development. Brazil records 6.0%, focusing on packaging industry expansion and environmental regulation compliance. The USA demonstrates 5.4% growth, prioritizing sustainable printing technologies and packaging innovation. The U.K. exhibits 4.8% growth, prioritizing environmental compliance and printing industry modernization. Japan shows 4.3% growth, supported by advanced printing processes and sustainability technology innovation.

The report covers an in-depth analysis of 40+ countries, Top-performing countries are highlighted below.

China Leads Global Market Growth with Packaging Industry Expansion

The washable flexographic printing plate market in China is projected to exhibit strong growth with a CAGR of 7.7% through 2035, driven by rapidly expanding packaging manufacturing infrastructure and significant government investment in environmental protection technologies supported by industrial sustainability initiatives and circular economy development programs. The country's massive packaging production capacity and increasing prioritizing on sustainable manufacturing practices are creating substantial demand for eco-friendly printing solutions. Major packaging manufacturers and printing companies are establishing comprehensive sustainable printing capabilities to serve both domestic and international markets.

  • Government support for environmental protection and sustainable manufacturing development is driving demand for eco-friendly printing technologies throughout major packaging production regions and industrial centers.
  • Strong packaging sector growth and an expanding network of printing facilities are supporting the rapid adoption of sustainable printing solutions among manufacturers seeking environmental compliance and operational cost optimization.

India Demonstrates Strong Market Potential with Industrial Development Growth

The washable flexographic printing plate market in India is expanding at a CAGR of 7.1%, supported by the country's rapid industrial development, growing packaging industry, and increasing adoption of sustainable printing technologies in manufacturing and consumer goods production. The country's expanding packaging infrastructure and rising focus on environmental compliance are driving demand for washable printing solutions. International printing technology providers and domestic manufacturers are establishing extensive production and distribution capabilities to address the growing demand for sustainable printing equipment.
  • Rising packaging production and expanding consumer goods manufacturing are creating opportunities for sustainable printing technology integration across food packaging, label printing, and consumer product manufacturers in major industrial regions.
  • Growing government prioritizing on environmental protection and industrial sustainability is driving adoption of eco-friendly printing technologies among manufacturers seeking enhanced operational efficiency and environmental compliance.

Germany Demonstrates Technological Leadership with Sustainability Innovation

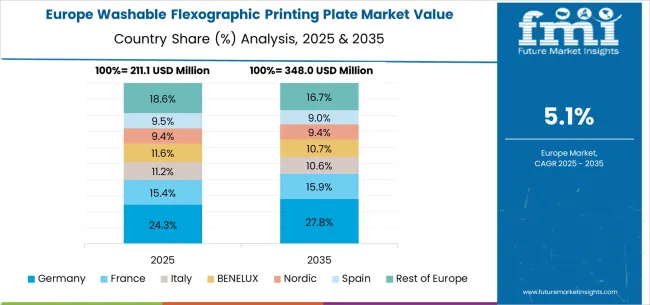
Washable Flexographic Printing Plate Market Europe Country Market Share Analysis, 2025 & 2035

The washable flexographic printing plate market in Germany is expanding at a CAGR of 6.6%, supported by the country's advanced printing technology sector, strong prioritizing on environmental sustainability, and robust demand for high-quality sustainable printing solutions among precision packaging and premium label manufacturers. The nation's mature printing industry and commitment to ecological excellence are driving sophisticated sustainable printing technology integration throughout production facilities. Leading technology companies and printing equipment manufacturers are investing extensively in premium product development and advanced sustainable technologies to serve both domestic and European markets.

  • Rising demand for sustainable printing solutions and advanced environmental technologies is creating opportunities for sophisticated printing products among packaging manufacturers seeking superior sustainability and operational performance.
  • Strong technological expertise and growing investment in environmental compliance infrastructure are supporting the development of advanced sustainable printing technologies across the packaging, labeling, and printing equipment sectors in major technology centers.

Brazil Focuses on Packaging Industry Expansion and Environmental Regulation Compliance

The washable flexographic printing plate market in Brazil is growing at a CAGR of 6.0%, driven by expanding packaging manufacturing infrastructure, strengthening environmental regulations, and increasing investment in sustainable printing technology adoption across major production regions. The country's developing packaging sector and increasing ecological compliance requirements are supporting demand for sustainable printing technologies. Printing technology providers and packaging manufacturers are establishing comprehensive capabilities to serve growing domestic demand and regional export opportunities.
  • Government initiatives promoting environmental protection and sustainable manufacturing are driving demand for eco-friendly printing technologies, including washable plate systems and sustainable printing solutions.
  • Rising packaging production and increasing focus on environmental sustainability are supporting market expansion, while growing consumer goods demand provides substantial opportunities for sustainable printing technology integration throughout the packaging supply chain.

USA Prioritizing Sustainable Printing Technologies and Packaging Innovation

Washable Flexographic Printing Plate Market Country Value Analysis

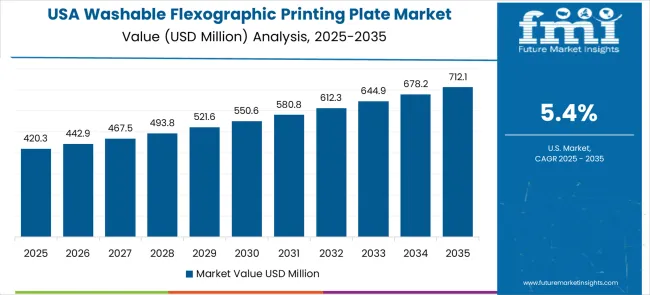
The washable flexographic printing plate market in the USA is expanding at a CAGR of 5.4%, supported by the country's advanced packaging industry, strong focus on environmental sustainability, and established demand for innovative printing solutions among leading packaging manufacturers and consumer goods companies. The USA's mature printing technology sector and leadership in packaging innovation are driving demand for sophisticated, sustainable printing systems focusing on environmental performance and operational optimization. Technology providers are investing in comprehensive capabilities to serve food packaging, consumer goods, and specialty printing markets with innovative, sustainable solutions.

  • Advanced packaging applications and growing sustainability requirements are creating opportunities for sophisticated sustainable printing technologies prioritizing environmental performance and operational efficiency.
  • Strong environmental regulatory framework and established adoption of sustainable technologies are driving integration of advanced eco-friendly printing systems among facilities seeking enhanced ecological compliance and operational optimization.

United Kingdom Exhibits Environmental Compliance Focus and Printing Industry Modernization

The washable flexographic printing plate market in the U.K. is growing at a CAGR of 4.8%, driven by the country's environmental compliance requirements, prioritizing on printing industry modernization, and strong demand for sustainable printing solutions in packaging and labeling applications. The U.K.'s established printing industry heritage and commitment to environmental excellence are supporting investment in advanced sustainable printing capabilities. Industry leaders are establishing comprehensive sustainability programs to serve both domestic and European markets with premium eco-friendly printing solutions.

  • Environmental regulations and sustainability initiatives are creating demand for advanced sustainable printing technologies with enhanced environmental performance and operational efficiency characteristics.
  • Growing printing industry, modernization, and prioritizing on sustainability compliance are driving integration of advanced eco-friendly printing technologies across the packaging and labeling industries throughout the country.

Japan Shows Advanced Printing Processes and Sustainability Technology Innovation

The washable flexographic printing plate market in Japan is expanding at a CAGR of 4.3%, supported by the country's focus on advanced printing processes, sustainability technology development, and strong focus on operational efficiency and environmental responsibility in packaging production. Japan's sophisticated printing industry and commitment to technological innovation are driving demand for advanced sustainable printing technologies, including high-performance washable systems and integrated environmental solutions. Leading printing technology companies are investing in specialized capabilities to serve packaging, consumer goods, and specialty printing segments with premium sustainable printing equipment.

  • Regional specialization in precision printing and unique sustainability approaches is creating opportunities for advanced g printing technology development and innovative environmental solutions throughout major printing centers.
  • Strong emphasis on operational efficiency combined with environmental responsibility requirements is driving the adoption of advanced sustainable printing technologies that maintain exceptional performance while meeting demanding ecological and quality specifications.

Europe Market Split by Countries

The washable flexographic printing plate market in Europe is projected to grow from USD 191.6 million in 2025 to USD 333.6 million by 2035, registering a CAGR of 5.7% over the forecast period. Germany is expected to maintain its leadership position with a 31.0% market share in 2025, declining slightly to 30.5% by 2035, supported by its strong printing technology sector, advanced packaging industry, and comprehensive sustainable printing technology supply network serving major European markets.

France follows with a 17.0% share in 2025, projected to reach 17.5% by 2035, driven by robust demand for sustainable printing solutions in food packaging, consumer goods labeling, and premium packaging applications, combined with established environmental regulations promoting eco-friendly printing technologies. The United Kingdom holds a 15.5% share in 2025, expected to decrease to 15.0% by 2035, supported by strong environmental compliance requirements but facing challenges from economic conditions and competitive pressures from continental suppliers. Italy commands a 12.5% share in 2025, projected to reach 12.7% by 2035, while Spain accounts for 9.0% in 2025, expected to reach 9.3% by 2035. The Netherlands maintains a 4.5% share in 2025, growing to 4.7% by 2035. The Rest of Europe region, including Nordic countries, Eastern Europe, Portugal, Belgium, Switzerland, and Austria, is anticipated to maintain steady growth, with its collective share remaining at 10.5% to 10.3% by 2035, attributed to consistent adoption of sustainable printing technologies in Nordic countries and growing packaging activities across Eastern European markets implementing environmental modernization programs.
Competitive Landscape of the Washable Flexographic Printing Plate Market

Washable Flexographic Printing Plate Market Analysis By Company

The washable flexographic printing plate market is characterized by competition among established printing plate manufacturers, specialized sustainable printing solution providers, and integrated printing technology companies. Companies are investing in advanced material development, sustainable manufacturing processes, product performance optimization, and comprehensive service portfolios to deliver durable, high-quality, and environmentally-friendly printing solutions. Innovation in plate materials, washing technologies, and sustainable manufacturing practices is central to strengthening market position and competitive advantage.

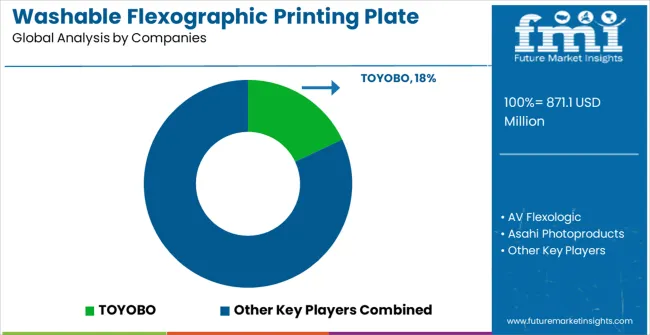
TOYOBO leads the market with a strong market share, offering comprehensive printing plate solutions with a focus on sustainable and high-performance applications. AV Flexologic provides specialized flexographic printing technologies with prioritizing on washable solutions and operational efficiency. Asahi Photoproducts delivers innovative printing plate systems with a focus on sustainability and advanced printing performance. Sumitomo Riko Company Limited specializes in advanced polymer materials and printing plate technologies for diverse applications. Flint Group focuses on comprehensive printing solutions prioritizing integrated sustainability features. DUPONT offers advanced material technologies with emphasis on performance and environmental responsibility.

Washable Flexographic Printing Plate Market - Stakeholder Contribution Framework

The washable flexographic printing plate market, valued at USD 871.1 million in 2025 and projected to reach USD 1,516.4 million by 2035 at a 5.7% CAGR, represents a specialized sustainable printing segment driven by environmental regulations and cost-reduction imperatives. Dominated by polyester-based plates (52.0% market share) and food packaging applications (60.0% market share), the market faces challenges including higher initial investment costs, specialized washing equipment requirements, and workflow modification needs. Success requires coordinated efforts across plate manufacturers, printing companies, packaging producers, equipment suppliers, and environmental regulators.

How Governments Could Support Sustainable Printing Innovation and Environmental Compliance?

  • Environmental Regulation & Incentives: Implement waste reduction mandates, extended producer responsibility programs, and tax incentives for sustainable printing technologies that encourage the adoption of reusable printing plates while supporting circular economy principles and reducing industrial waste generation.
  • Technology Development Grants: Provide research funding for advanced plate materials, washing system optimization, and digital workflow integration that enhance plate durability, improve print quality, and reduce operational complexity for sustainable printing applications.
  • Green Manufacturing Support: Establish sustainability certification programs, environmental compliance assistance, and clean technology financing that help printing companies transition to washable plate systems while meeting environmental standards and operational efficiency requirements.
  • Industry Standards Development: Support the creation of technical standards for washable plate performance, washing protocols, and environmental impact measurement that ensure consistent quality, safety, and environmental benefits across the printing industry.
  • Circular Economy Initiatives: Implement waste reduction targets, material recovery programs, and sustainability reporting requirements that incentivize printing companies to adopt reusable technologies and demonstrate environmental performance improvements.

How Industry Associations Could Advance Technology Adoption and Best Practices?

  • Technical Standards & Performance Metrics: Develop comprehensive specifications for washable plate durability, print quality consistency, and washing effectiveness, along with standardized testing methods that enable reliable performance comparison and quality assurance across different suppliers and applications.
  • Training & Certification Programs: Create educational programs for printing operators, quality control technicians, and production managers that build expertise in washable plate handling, washing procedures, and workflow optimization to ensure successful technology implementation.
  • Sustainability Guidelines & Environmental Benchmarking: Establish best practices for sustainable printing operations, including waste reduction metrics, cost-benefit analysis frameworks, and environmental impact assessment tools that help companies optimize their sustainable printing strategies.
  • Technology Assessment & Innovation Forums: Organize conferences, technical workshops, and demonstration programs that showcase emerging washable plate technologies, washing system innovations, and successful implementation case studies across different printing applications.
  • Market Development & Industry Collaboration: Facilitate partnerships between plate manufacturers, printing companies, and packaging producers to accelerate technology adoption, share implementation experiences, and develop industry-wide sustainability initiatives.

How Plate Manufacturers and Technology Developers Could Drive Innovation?

  • Advanced Material Development: Invest in polymer science research, surface treatment technologies, and chemical resistance improvements that create washable plates with enhanced durability, superior print quality, and extended reuse capabilities across diverse printing applications.
  • Washing Technology Integration: Develop automated washing systems, solvent recovery technologies, and integrated cleaning processes that optimize plate lifecycle management while minimizing chemical consumption and waste generation for sustainable operations.
  • Performance Optimization: Create specialized plate formulations optimized for different printing applications, including food-safe materials for packaging, high-resolution plates for premium labeling, and cost-effective solutions for high-volume production.
  • Digital Workflow Solutions: Implement plate lifecycle tracking systems, predictive maintenance algorithms, and quality monitoring technologies that optimize plate utilization, predict replacement timing, and ensure consistent print quality throughout the reuse cycle.
  • Customer Support & Technical Services: Establish application laboratories, training programs, and technical consulting services that help printing companies successfully implement washable plate systems while optimizing performance and maximizing return on investment.

How Printing Companies and Packaging Producers Could Optimize Implementation?

  • Workflow Integration & Process Optimization: Develop comprehensive implementation strategies that integrate washable plates into existing production workflows, including modified handling procedures, washing protocols, and quality control systems that ensure consistent print quality and operational efficiency.
  • Equipment Investment & Infrastructure Development: Invest in specialized washing equipment, plate handling systems, and quality monitoring technologies that enable effective washable plate utilization while maintaining production throughput and print quality standards.
  • Operator Training & Skill Development: Implement comprehensive training programs for production operators, maintenance technicians, and quality control staff that build expertise in washable plate handling, troubleshooting, and optimization techniques.
  • Cost-Benefit Analysis & Performance Monitoring: Establish detailed tracking systems for plate lifecycle costs, environmental impact metrics, and operational efficiency improvements that demonstrate the value of washable plate adoption and guide optimization efforts.
  • Sustainability Integration & Reporting: Align washable plate implementation with broader sustainability initiatives, including waste reduction targets, environmental reporting requirements, and corporate responsibility programs that demonstrate environmental leadership and operational excellence.

How Investors and Financial Enablers Could Support Market Growth?

  • Technology Innovation Funding: Support research and development initiatives focused on next-generation plate materials, advanced washing technologies, and digital integration solutions that improve performance while reducing implementation costs and complexity.
  • Manufacturing Capacity Investment: Fund the expansion of washable plate production facilities, specialized coating equipment, and quality control systems that build global manufacturing capacity and support market growth in emerging packaging markets.
  • Equipment Financing & Leasing Programs: Provide financing solutions for printing companies investing in washable plate systems, including equipment leasing, technology upgrade loans, and sustainability-linked financing that reduce barriers to technology adoption.
  • Market Development & Strategic Partnerships: Enable strategic acquisitions and joint ventures that combine complementary technologies, expand market reach, and create comprehensive, sustainable printing solution providers capable of serving diverse packaging and labeling markets.
  • Sustainability Impact Investment: Support initiatives that demonstrate measurable environmental benefits, including waste reduction achievements, cost savings realization, and circular economy contributions that create both financial returns and positive environmental outcomes for stakeholders across the printing value chain.

Key Players in the Washable Flexographic Printing Plate Market

  • TOYOBO
  • AV Flexologic
  • Asahi Photoproducts
  • Sumitomo Riko Company Limited.
  • Flint Group
  • DUPONT
  • Fujifilm
  • Print AllFlexo
  • SinkoTech
  • Sevenace
  • McLantis
  • Interflex
  • Kyang Yhe
  • Pendharkar Enterprises
  • Dongguan Merit Technology Co., Ltd.

Scope of the Report

Items Values
Quantitative Units (2025) USD 871.1 million
Base Material Metal Base, Polyester Base, Others
Application Food Packaging, Label Printing
Regions Covered North America, Europe, East Asia, South Asia & Pacific, Latin America, Middle East & Africa
Countries Covered United States, Canada, United Kingdom, Germany, France, China, Japan, South Korea, India, Brazil, Australia and 40+ countries
Key Companies Profiled TOYOBO, AV Flexologic, Asahi Photoproducts, Sumitomo Riko Company Limited, Flint Group, and DUPONT
Additional Attributes Dollar sales by base material and application category, regional demand trends, competitive landscape, technological advancements in sustainable printing materials, washing technology innovation, process optimization integration, and supply chain optimization

Washable Flexographic Printing Plate Market by Segments

Base Material:

  • Metal Base
  • Polyester Base
  • Others

Application:

  • Food Packaging
  • Label Printing

Region:

North America

  • United States
  • Canada
  • Mexico

Europe

  • Germany
  • United Kingdom
  • France
  • Italy
  • Spain
  • Nordic
  • BENELUX
  • Rest of Europe

East Asia

  • China
  • Japan
  • South Korea

South Asia & Pacific

  • India
  • ASEAN
  • Australia & New Zealand
  • Rest of South Asia & Pacific

Latin America

  • Brazil
  • Chile
  • Rest of Latin America

Middle East & Africa

  • Kingdom of Saudi Arabia
  • Other GCC Countries
  • Turkiye
  • South Africa
  • Other African Union
  • Rest of Middle East & Africa

Table of Content

  1. Executive Summary
    • Global Market Outlook
    • Demand to side Trends
    • Supply to side Trends
    • Technology Roadmap Analysis
    • Analysis and Recommendations
  2. Market Overview
    • Market Coverage / Taxonomy
    • Market Definition / Scope / Limitations
  3. Market Background
    • Market Dynamics
      • Drivers
      • Restraints
      • Opportunity
      • Trends
    • Scenario Forecast
      • Demand in Optimistic Scenario
      • Demand in Likely Scenario
      • Demand in Conservative Scenario
    • Opportunity Map Analysis
    • Product Life Cycle Analysis
    • Supply Chain Analysis
    • Investment Feasibility Matrix
    • Value Chain Analysis
    • PESTLE and Porter’s Analysis
    • Regulatory Landscape
    • Regional Parent Market Outlook
    • Production and Consumption Statistics
    • Import and Export Statistics
  4. Global Market Analysis 2020 to 2024 and Forecast, 2025 to 2035
    • Historical Market Size Value (USD Million) Analysis, 2020 to 2024
    • Current and Future Market Size Value (USD Million) Projections, 2025 to 2035
      • Y to o to Y Growth Trend Analysis
      • Absolute $ Opportunity Analysis
  5. Global Market Pricing Analysis 2020 to 2024 and Forecast 2025 to 2035
  6. Global Market Analysis 2020 to 2024 and Forecast 2025 to 2035, By Classification
    • Introduction / Key Findings
    • Historical Market Size Value (USD Million) Analysis By Classification , 2020 to 2024
    • Current and Future Market Size Value (USD Million) Analysis and Forecast By Classification , 2025 to 2035
      • Polyester Base
      • Metal Base
    • Y to o to Y Growth Trend Analysis By Classification , 2020 to 2024
    • Absolute $ Opportunity Analysis By Classification , 2025 to 2035
  7. Global Market Analysis 2020 to 2024 and Forecast 2025 to 2035, By Application
    • Introduction / Key Findings
    • Historical Market Size Value (USD Million) Analysis By Application, 2020 to 2024
    • Current and Future Market Size Value (USD Million) Analysis and Forecast By Application, 2025 to 2035
      • Food Packaging
      • Label Printing
      • Others
    • Y to o to Y Growth Trend Analysis By Application, 2020 to 2024
    • Absolute $ Opportunity Analysis By Application, 2025 to 2035
  8. Global Market Analysis 2020 to 2024 and Forecast 2025 to 2035, By Region
    • Introduction
    • Historical Market Size Value (USD Million) Analysis By Region, 2020 to 2024
    • Current Market Size Value (USD Million) Analysis and Forecast By Region, 2025 to 2035
      • North America
      • Latin America
      • Western Europe
      • Eastern Europe
      • East Asia
      • South Asia and Pacific
      • Middle East & Africa
    • Market Attractiveness Analysis By Region
  9. North America Market Analysis 2020 to 2024 and Forecast 2025 to 2035, By Country
    • Historical Market Size Value (USD Million) Trend Analysis By Market Taxonomy, 2020 to 2024
    • Market Size Value (USD Million) Forecast By Market Taxonomy, 2025 to 2035
      • By Country
        • USA
        • Canada
        • Mexico
      • By Classification
      • By Application
    • Market Attractiveness Analysis
      • By Country
      • By Classification
      • By Application
    • Key Takeaways
  10. Latin America Market Analysis 2020 to 2024 and Forecast 2025 to 2035, By Country
    • Historical Market Size Value (USD Million) Trend Analysis By Market Taxonomy, 2020 to 2024
    • Market Size Value (USD Million) Forecast By Market Taxonomy, 2025 to 2035
      • By Country
        • Brazil
        • Chile
        • Rest of Latin America
      • By Classification
      • By Application
    • Market Attractiveness Analysis
      • By Country
      • By Classification
      • By Application
    • Key Takeaways
  11. Western Europe Market Analysis 2020 to 2024 and Forecast 2025 to 2035, By Country
    • Historical Market Size Value (USD Million) Trend Analysis By Market Taxonomy, 2020 to 2024
    • Market Size Value (USD Million) Forecast By Market Taxonomy, 2025 to 2035
      • By Country
        • Germany
        • UK
        • Italy
        • Spain
        • France
        • Nordic
        • BENELUX
        • Rest of Western Europe
      • By Classification
      • By Application
    • Market Attractiveness Analysis
      • By Country
      • By Classification
      • By Application
    • Key Takeaways
  12. Eastern Europe Market Analysis 2020 to 2024 and Forecast 2025 to 2035, By Country
    • Historical Market Size Value (USD Million) Trend Analysis By Market Taxonomy, 2020 to 2024
    • Market Size Value (USD Million) Forecast By Market Taxonomy, 2025 to 2035
      • By Country
        • Russia
        • Poland
        • Hungary
        • Balkan & Baltic
        • Rest of Eastern Europe
      • By Classification
      • By Application
    • Market Attractiveness Analysis
      • By Country
      • By Classification
      • By Application
    • Key Takeaways
  13. East Asia Market Analysis 2020 to 2024 and Forecast 2025 to 2035, By Country
    • Historical Market Size Value (USD Million) Trend Analysis By Market Taxonomy, 2020 to 2024
    • Market Size Value (USD Million) Forecast By Market Taxonomy, 2025 to 2035
      • By Country
        • China
        • Japan
        • South Korea
      • By Classification
      • By Application
    • Market Attractiveness Analysis
      • By Country
      • By Classification
      • By Application
    • Key Takeaways
  14. South Asia and Pacific Market Analysis 2020 to 2024 and Forecast 2025 to 2035, By Country
    • Historical Market Size Value (USD Million) Trend Analysis By Market Taxonomy, 2020 to 2024
    • Market Size Value (USD Million) Forecast By Market Taxonomy, 2025 to 2035
      • By Country
        • India
        • ASEAN
        • Australia & New Zealand
        • Rest of South Asia and Pacific
      • By Classification
      • By Application
    • Market Attractiveness Analysis
      • By Country
      • By Classification
      • By Application
    • Key Takeaways
  15. Middle East & Africa Market Analysis 2020 to 2024 and Forecast 2025 to 2035, By Country
    • Historical Market Size Value (USD Million) Trend Analysis By Market Taxonomy, 2020 to 2024
    • Market Size Value (USD Million) Forecast By Market Taxonomy, 2025 to 2035
      • By Country
        • Kingdom of Saudi Arabia
        • Other GCC Countries
        • Turkiye
        • South Africa
        • Other African Union
        • Rest of Middle East & Africa
      • By Classification
      • By Application
    • Market Attractiveness Analysis
      • By Country
      • By Classification
      • By Application
    • Key Takeaways
  16. Key Countries Market Analysis
    • USA
      • Pricing Analysis
      • Market Share Analysis, 2024
        • By Classification
        • By Application
    • Canada
      • Pricing Analysis
      • Market Share Analysis, 2024
        • By Classification
        • By Application
    • Mexico
      • Pricing Analysis
      • Market Share Analysis, 2024
        • By Classification
        • By Application
    • Brazil
      • Pricing Analysis
      • Market Share Analysis, 2024
        • By Classification
        • By Application
    • Chile
      • Pricing Analysis
      • Market Share Analysis, 2024
        • By Classification
        • By Application
    • Germany
      • Pricing Analysis
      • Market Share Analysis, 2024
        • By Classification
        • By Application
    • UK
      • Pricing Analysis
      • Market Share Analysis, 2024
        • By Classification
        • By Application
    • Italy
      • Pricing Analysis
      • Market Share Analysis, 2024
        • By Classification
        • By Application
    • Spain
      • Pricing Analysis
      • Market Share Analysis, 2024
        • By Classification
        • By Application
    • France
      • Pricing Analysis
      • Market Share Analysis, 2024
        • By Classification
        • By Application
    • India
      • Pricing Analysis
      • Market Share Analysis, 2024
        • By Classification
        • By Application
    • ASEAN
      • Pricing Analysis
      • Market Share Analysis, 2024
        • By Classification
        • By Application
    • Australia & New Zealand
      • Pricing Analysis
      • Market Share Analysis, 2024
        • By Classification
        • By Application
    • China
      • Pricing Analysis
      • Market Share Analysis, 2024
        • By Classification
        • By Application
    • Japan
      • Pricing Analysis
      • Market Share Analysis, 2024
        • By Classification
        • By Application
    • South Korea
      • Pricing Analysis
      • Market Share Analysis, 2024
        • By Classification
        • By Application
    • Russia
      • Pricing Analysis
      • Market Share Analysis, 2024
        • By Classification
        • By Application
    • Poland
      • Pricing Analysis
      • Market Share Analysis, 2024
        • By Classification
        • By Application
    • Hungary
      • Pricing Analysis
      • Market Share Analysis, 2024
        • By Classification
        • By Application
    • Kingdom of Saudi Arabia
      • Pricing Analysis
      • Market Share Analysis, 2024
        • By Classification
        • By Application
    • Turkiye
      • Pricing Analysis
      • Market Share Analysis, 2024
        • By Classification
        • By Application
    • South Africa
      • Pricing Analysis
      • Market Share Analysis, 2024
        • By Classification
        • By Application
  17. Market Structure Analysis
    • Competition Dashboard
    • Competition Benchmarking
    • Market Share Analysis of Top Players
      • By Regional
      • By Classification
      • By Application
  18. Competition Analysis
    • Competition Deep Dive
      • TOYOBO
        • Overview
        • Product Portfolio
        • Profitability by Market Segments (Product/Age /Sales Channel/Region)
        • Sales Footprint
        • Strategy Overview
          • Marketing Strategy
          • Product Strategy
          • Channel Strategy
      • AV Flexologic
      • Asahi Photoproducts
      • Sumitomo Riko Company Limited.
      • Flint Group
      • DUPONT
      • Fujifilm Print
      • AllFlexo
      • SinkoTech
      • Sevenace
      • McLantis
      • Interflex
      • Kyang Yhe
      • Pendharkar Enterprises
      • Dongguan Merit Technology Co.,Ltd.
  19. Assumptions & Acronyms Used
  20. Research Methodology

List of Tables

  • Table 1: Global Market Value (USD Million) Forecast by Region, 2020 to 2035
  • Table 2: Global Market Value (USD Million) Forecast by Classification , 2020 to 2035
  • Table 3: Global Market Value (USD Million) Forecast by Application, 2020 to 2035
  • Table 4: North America Market Value (USD Million) Forecast by Country, 2020 to 2035
  • Table 5: North America Market Value (USD Million) Forecast by Classification , 2020 to 2035
  • Table 6: North America Market Value (USD Million) Forecast by Application, 2020 to 2035
  • Table 7: Latin America Market Value (USD Million) Forecast by Country, 2020 to 2035
  • Table 8: Latin America Market Value (USD Million) Forecast by Classification , 2020 to 2035
  • Table 9: Latin America Market Value (USD Million) Forecast by Application, 2020 to 2035
  • Table 10: Western Europe Market Value (USD Million) Forecast by Country, 2020 to 2035
  • Table 11: Western Europe Market Value (USD Million) Forecast by Classification , 2020 to 2035
  • Table 12: Western Europe Market Value (USD Million) Forecast by Application, 2020 to 2035
  • Table 13: Eastern Europe Market Value (USD Million) Forecast by Country, 2020 to 2035
  • Table 14: Eastern Europe Market Value (USD Million) Forecast by Classification , 2020 to 2035
  • Table 15: Eastern Europe Market Value (USD Million) Forecast by Application, 2020 to 2035
  • Table 16: East Asia Market Value (USD Million) Forecast by Country, 2020 to 2035
  • Table 17: East Asia Market Value (USD Million) Forecast by Classification , 2020 to 2035
  • Table 18: East Asia Market Value (USD Million) Forecast by Application, 2020 to 2035
  • Table 19: South Asia and Pacific Market Value (USD Million) Forecast by Country, 2020 to 2035
  • Table 20: South Asia and Pacific Market Value (USD Million) Forecast by Classification , 2020 to 2035
  • Table 21: South Asia and Pacific Market Value (USD Million) Forecast by Application, 2020 to 2035
  • Table 22: Middle East & Africa Market Value (USD Million) Forecast by Country, 2020 to 2035
  • Table 23: Middle East & Africa Market Value (USD Million) Forecast by Classification , 2020 to 2035
  • Table 24: Middle East & Africa Market Value (USD Million) Forecast by Application, 2020 to 2035

List of Figures

  • Figure 1: Global Market Pricing Analysis
  • Figure 2: Global Market Value (USD Million) Forecast 2020-2035
  • Figure 3: Global Market Value Share and BPS Analysis by Classification , 2025 and 2035
  • Figure 4: Global Market Y to o to Y Growth Comparison by Classification , 2025-2035
  • Figure 5: Global Market Attractiveness Analysis by Classification
  • Figure 6: Global Market Value Share and BPS Analysis by Application, 2025 and 2035
  • Figure 7: Global Market Y to o to Y Growth Comparison by Application, 2025-2035
  • Figure 8: Global Market Attractiveness Analysis by Application
  • Figure 9: Global Market Value (USD Million) Share and BPS Analysis by Region, 2025 and 2035
  • Figure 10: Global Market Y to o to Y Growth Comparison by Region, 2025-2035
  • Figure 11: Global Market Attractiveness Analysis by Region
  • Figure 12: North America Market Incremental Dollar Opportunity, 2025-2035
  • Figure 13: Latin America Market Incremental Dollar Opportunity, 2025-2035
  • Figure 14: Western Europe Market Incremental Dollar Opportunity, 2025-2035
  • Figure 15: Eastern Europe Market Incremental Dollar Opportunity, 2025-2035
  • Figure 16: East Asia Market Incremental Dollar Opportunity, 2025-2035
  • Figure 17: South Asia and Pacific Market Incremental Dollar Opportunity, 2025-2035
  • Figure 18: Middle East & Africa Market Incremental Dollar Opportunity, 2025-2035
  • Figure 19: North America Market Value Share and BPS Analysis by Country, 2025 and 2035
  • Figure 20: North America Market Value Share and BPS Analysis by Classification , 2025 and 2035
  • Figure 21: North America Market Y to o to Y Growth Comparison by Classification , 2025-2035
  • Figure 22: North America Market Attractiveness Analysis by Classification
  • Figure 23: North America Market Value Share and BPS Analysis by Application, 2025 and 2035
  • Figure 24: North America Market Y to o to Y Growth Comparison by Application, 2025-2035
  • Figure 25: North America Market Attractiveness Analysis by Application
  • Figure 26: Latin America Market Value Share and BPS Analysis by Country, 2025 and 2035
  • Figure 27: Latin America Market Value Share and BPS Analysis by Classification , 2025 and 2035
  • Figure 28: Latin America Market Y to o to Y Growth Comparison by Classification , 2025-2035
  • Figure 29: Latin America Market Attractiveness Analysis by Classification
  • Figure 30: Latin America Market Value Share and BPS Analysis by Application, 2025 and 2035
  • Figure 31: Latin America Market Y to o to Y Growth Comparison by Application, 2025-2035
  • Figure 32: Latin America Market Attractiveness Analysis by Application
  • Figure 33: Western Europe Market Value Share and BPS Analysis by Country, 2025 and 2035
  • Figure 34: Western Europe Market Value Share and BPS Analysis by Classification , 2025 and 2035
  • Figure 35: Western Europe Market Y to o to Y Growth Comparison by Classification , 2025-2035
  • Figure 36: Western Europe Market Attractiveness Analysis by Classification
  • Figure 37: Western Europe Market Value Share and BPS Analysis by Application, 2025 and 2035
  • Figure 38: Western Europe Market Y to o to Y Growth Comparison by Application, 2025-2035
  • Figure 39: Western Europe Market Attractiveness Analysis by Application
  • Figure 40: Eastern Europe Market Value Share and BPS Analysis by Country, 2025 and 2035
  • Figure 41: Eastern Europe Market Value Share and BPS Analysis by Classification , 2025 and 2035
  • Figure 42: Eastern Europe Market Y to o to Y Growth Comparison by Classification , 2025-2035
  • Figure 43: Eastern Europe Market Attractiveness Analysis by Classification
  • Figure 44: Eastern Europe Market Value Share and BPS Analysis by Application, 2025 and 2035
  • Figure 45: Eastern Europe Market Y to o to Y Growth Comparison by Application, 2025-2035
  • Figure 46: Eastern Europe Market Attractiveness Analysis by Application
  • Figure 47: East Asia Market Value Share and BPS Analysis by Country, 2025 and 2035
  • Figure 48: East Asia Market Value Share and BPS Analysis by Classification , 2025 and 2035
  • Figure 49: East Asia Market Y to o to Y Growth Comparison by Classification , 2025-2035
  • Figure 50: East Asia Market Attractiveness Analysis by Classification
  • Figure 51: East Asia Market Value Share and BPS Analysis by Application, 2025 and 2035
  • Figure 52: East Asia Market Y to o to Y Growth Comparison by Application, 2025-2035
  • Figure 53: East Asia Market Attractiveness Analysis by Application
  • Figure 54: South Asia and Pacific Market Value Share and BPS Analysis by Country, 2025 and 2035
  • Figure 55: South Asia and Pacific Market Value Share and BPS Analysis by Classification , 2025 and 2035
  • Figure 56: South Asia and Pacific Market Y to o to Y Growth Comparison by Classification , 2025-2035
  • Figure 57: South Asia and Pacific Market Attractiveness Analysis by Classification
  • Figure 58: South Asia and Pacific Market Value Share and BPS Analysis by Application, 2025 and 2035
  • Figure 59: South Asia and Pacific Market Y to o to Y Growth Comparison by Application, 2025-2035
  • Figure 60: South Asia and Pacific Market Attractiveness Analysis by Application
  • Figure 61: Middle East & Africa Market Value Share and BPS Analysis by Country, 2025 and 2035
  • Figure 62: Middle East & Africa Market Value Share and BPS Analysis by Classification , 2025 and 2035
  • Figure 63: Middle East & Africa Market Y to o to Y Growth Comparison by Classification , 2025-2035
  • Figure 64: Middle East & Africa Market Attractiveness Analysis by Classification
  • Figure 65: Middle East & Africa Market Value Share and BPS Analysis by Application, 2025 and 2035
  • Figure 66: Middle East & Africa Market Y to o to Y Growth Comparison by Application, 2025-2035
  • Figure 67: Middle East & Africa Market Attractiveness Analysis by Application
  • Figure 68: Global Market - Tier Structure Analysis
  • Figure 69: Global Market - Company Share Analysis

Frequently Asked Questions

How big is the non-selective broadleaf herbicides market in 2025?

The global non-selective broadleaf herbicides market is estimated to be valued at USD 4,918.3 million in 2025.

What will be the size of non-selective broadleaf herbicides market in 2035?

The market size for the non-selective broadleaf herbicides market is projected to reach USD 8,165.4 million by 2035.

How much will be the non-selective broadleaf herbicides market growth between 2025 and 2035?

The non-selective broadleaf herbicides market is expected to grow at a 5.2% CAGR between 2025 and 2035.

What are the key product types in the non-selective broadleaf herbicides market?

The key product types in non-selective broadleaf herbicides market are glyphosate, glufosinate and others.

Which application segment to contribute significant share in the non-selective broadleaf herbicides market in 2025?

In terms of application, orchard segment to command 34.0% share in the non-selective broadleaf herbicides market in 2025.

Explore Similar Insights

Future Market Insights

Washable Flexographic Printing Plate Market

Chat With

MaRIA

Hi There, I am MaRIA, Your Market Research Intelligence Assistant. How may I help you?