

- Market Size (2026)
- USD 2.3 Bn
- Forecast (2036)
- USD 4.9 Bn
- CAGR (2026 to 2036)
- 7.6%
How big is the Water Mist Fire System Market in 2026?
USD 2.3 billion in 2026 and USD 4.9 billion by 2036 at a 7.6% CAGR.
Shipowners and offshore operators are moving water mist fire systems from a specialist safety option to a lifecycle asset decision. The shift is driven by compact machinery rooms and fuel-system fire exposure. It also reflects the need to limit water discharge near critical equipment. DNV reported in March 2025 that engine room fires remain the most frequent shipboard fire type, and oil mist on hot surfaces is a primary cause. This evidence keeps machinery-space protection near the center of specification work. Buyers comparing marine fire extinguishing systems now weigh cooling performance and class acceptance. They also review crew readiness and service access before hardware cost.
Shipyards and vessel owners form the core buyer base. Offshore platform operators and port engineering teams also drive demand, and their purchasing pressure is shaped by class review and retrofit windows. Outage cost and protection needs in machinery rooms also affect adoption. Water mist creates value by cooling the fire zone and reducing discharge volume.
Adoption differs by maritime investment pattern as established shipowning markets prioritize retrofit compliance and service access, and high-growth shipbuilding countries use water mist during newbuild design. The product becomes more valuable once pumps and nozzles connect to sensors. Alarms and inspection records then support vessel operating readiness. Suppliers able to support automatic fire suppression systems and water mist documentation are better positioned.
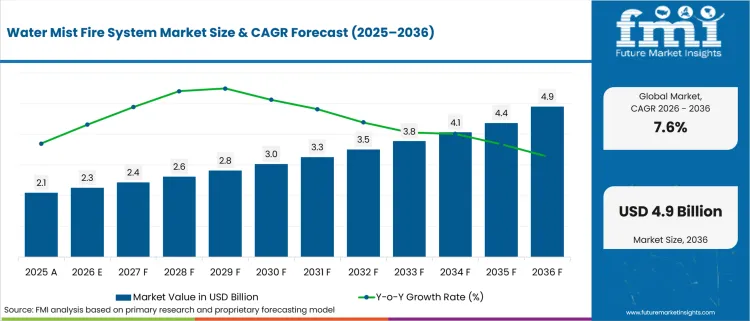
| Metric | Value |
|---|---|
| 2025 Market Size | USD 2.1 billion |
| 2026 Market Size | USD 2.3 billion |
| 2036 Market Size | USD 4.9 billion |
| Forecast CAGR (2026-2036) | 7.6% |
| Leading System Type | High-pressure Water Mist |
| High-pressure Water Mist Share (2026) | 47.0% |
| Leading Application | Machinery Spaces |
| Machinery Spaces Share (2026) | 39.5% |
| Leading End Use | Commercial Vessels |
| Commercial Vessels Share (2026) | 46.0% |
| Fastest-growing Country | China |
| China CAGR by 2036 | 8.7% |
Summary of the Water Mist Fire System Market
| Market Signal | Commercial Impact |
|---|---|
| Demand and Growth Drivers | Demand for marine water mist fire suppression systems is increasing as shipowners, shipyards, and offshore operators prioritize compact fire protection, regulatory compliance, and lifecycle safety management.
|
| Product and Segment View | High-pressure water mist systems, machinery space protection, and commercial vessels continue to represent the leading commercial opportunities across the market.
|
| Geography and Growth Outlook | Asia continues to lead market expansion through shipbuilding activity, port modernization, and increasing adoption of advanced marine fire protection systems.
|
| Competitive Landscape | Competition increasingly focuses on certified fire suppression technologies, engineering expertise, lifecycle service support, and regulatory compliance.
|
| Analyst Perspective | Marine water mist fire suppression systems are evolving from conventional fire protection equipment into proof-based safety solutions that strengthen regulatory compliance, asset protection, and operational readiness.
- Nikhil Kaitwade, Principal Consultant at Future Market Insights |
How is the water mist fire system market segmented?
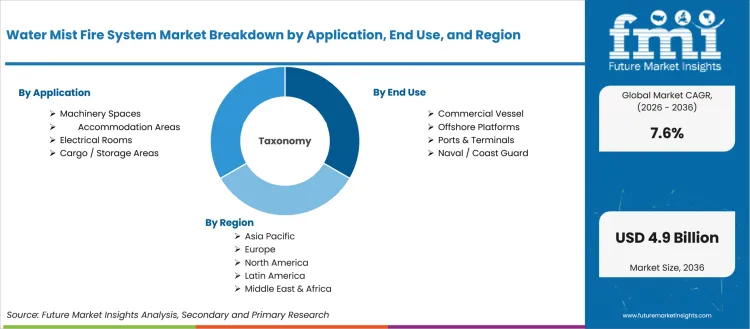
The Water Mist Fire System industry is segmented by system type, application, end use, activation, sales channel, and region.
The water mist fire system market is segmented by system type, application, end use, activation, sales channel, and region. System type covers High-pressure Water Mist, Low-pressure Water Mist, Hybrid Water Mist, and Local Application Systems. Application includes Machinery Spaces, Accommodation Areas, Electrical Rooms, and Cargo / Storage Areas. End use spans Commercial Vessels, Offshore Platforms, Naval / Coast Guard, and Ports & Terminals. Activation includes Automatic and Manual / Semi-automatic systems. Sales channel covers Direct OEM, EPC / Shipyard, and Service Retrofit routes. Regional coverage extends across North America, Latin America, Western Europe, Eastern Europe, East Asia, South Asia and Pacific, and the Middle East and Africa.
Why does High-pressure Water Mist matter within the system type category?
Marine buyers need fire control that fits narrow pipe routes and crowded machinery zones. High-pressure water mist answers that problem by creating fine droplets that absorb heat and limit water discharge. The segment is relevant for vessels and offshore assets that need protection near engines, generators, switchgear, and accommodation spaces. The supplier case depends on pump reliability, nozzle approvals, and fire-test documentation.
- In 2026, High-pressure Water Mist is anticipated to hold 47.0% of system type demand, driven by buyer preference for compact suppression in hard-to-access spaces. Danfoss states that high-pressure water mist absorbs heat and reduces water damage, which supports its use near sensitive machinery and shipboard structures.
- For vessel owners, High-pressure Water Mist reduces the trade-off between fire control and collateral damage. It supports faster restart planning after an incident and helps crews protect local hazards without flooding a full compartment.
What makes Machinery Spaces the central application area?
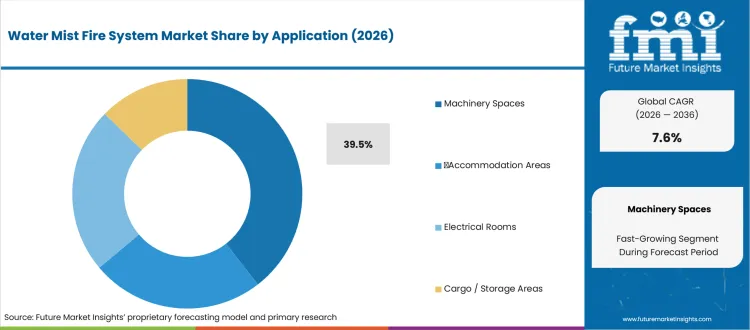
The core hazard in machinery spaces is the mix of heat, fuel, pressure, and limited access. Water mist is relevant here owing to fire spread risk that can affect propulsion, power generation, and crew safety quickly. Buyers want systems that can cool local risk points and protect nearby equipment. This makes machinery spaces a technical specification zone instead of a general fire protection location.
- Machinery Spaces is predicted to hold 39.5% of application demand in 2026, attributable to fuel lines, hot surfaces, and enclosed propulsion equipment. DNV reported in March 2025 that engine room fires remain the most frequent shipboard fire type, which keeps this application central to water mist specification.
- Engineering teams using water mist in machinery spaces gain a targeted protection route that reduces system discharge volume. The operating value comes from protecting engines, separators, pumps, and generators while limiting cleanup and downtime risk after activation.
How do buyers evaluate Commercial Vessels within end use?
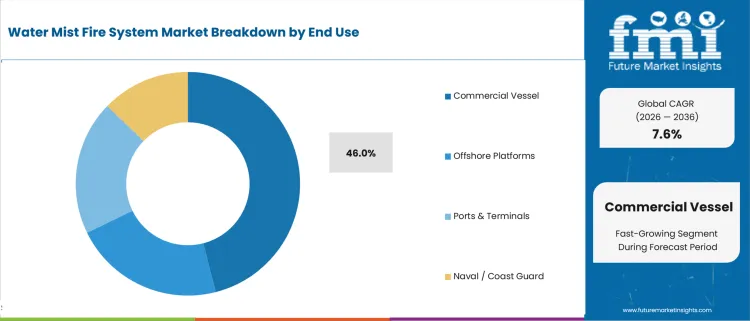
Commercial vessel owners manage safety across ferry, cruise, cargo, and service fleets. Their buying decision is practical: equipment must pass class review and remain serviceable during regular vessel operations. Water mist gains relevance by protecting machinery and accommodation spaces while limiting major water damage. Fleet buyers also care about training depth and global support.
- Commercial Vessels is expected to account for 46.0% share in 2026, supported by recurring class inspection cycles and onboard safety requirements. The USA Coast Guard supplement lists water mist fire extinguishing systems in approved equipment categories, which helps regulated buyers assess system eligibility.
- Fleet managers benefit from commercial-vessel water mist systems by standardizing training, spares, and inspection routines across multiple assets. This reduces support variation and gives procurement teams a clearer basis for comparing suppliers beyond equipment price.
What supports Automatic activation demand?
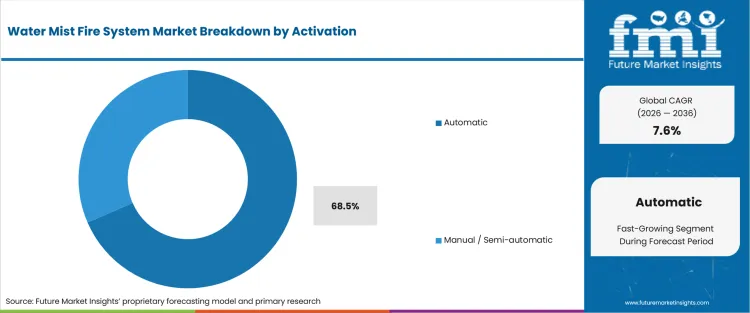
Unattended spaces create the central operating problem for activation choice. Crew members may not be present near machinery, electrical rooms, or storage areas at the point of ignition. Automatic activation gives the system a response path tied to detection and control hardware. Buyers use it to reduce the delay between incident detection and discharge.
- Automatic activation is expected to account for 68.5% share in 2026, shaped by demand for fast response in unattended machinery and electrical zones. ClassNK explains that shipboard fire protection maintenance must be available for inspection, which reinforces the broader need for dependable system readiness.
- The operational case for Automatic activation is clearer incident control before manual intervention becomes possible. It helps operators reduce escalation risk in engine rooms, switch rooms, and service spaces that may be distant from crew movement at the time of ignition.
Why does EPC / Shipyard remain important in sales channels?
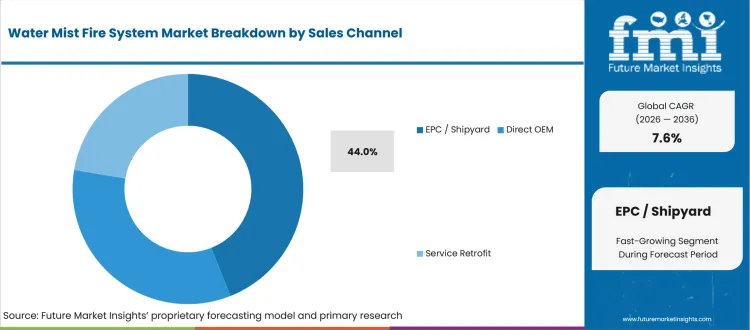
Water mist projects become harder to change once vessel layout and equipment spaces are fixed. Shipyards and EPC contractors therefore influence system selection before delivery or major refit work starts. Buyers rely on these channels to coordinate pumps, piping, nozzles, alarms, and approval documentation. Channel strength depends on engineering support and class-ready files.
- EPC / Shipyard is anticipated to hold 44.0% of sales-channel demand in 2026, led by design-stage decisions around pipe routing and pump skid placement. MARAD lists USD 12.9 billion committed to support the maritime industry in 2026, which reinforces shipyard modernization relevance.
- For suppliers, the EPC / Shipyard route reduces late-stage redesign risk by placing water mist decisions into the build plan. It also creates repeatable account access if the same approved package can be applied across sister vessels and recurring refit programs.
What are the drivers, restraints, and opportunities in the water mist fire system market?
Near-term purchases are being shaped by the machinery-space protection requirement, retrofit space constraint, and monitoring-led service route outlined below.
- Driver: Machinery-space fire exposure is driving buyer spending on compact water mist systems for engines, generators, and fuel-handling equipment.
- Restraint: Retrofit complexity is slowing some upgrades due to crowded pipe corridors, limited pump-room space, and dry-dock scheduling pressure.
- Opportunity: Connected monitoring is opening service revenue for suppliers that can convert inspection readiness into fleet-level status visibility.
Machinery and equipment rooms are becoming the practical center of water mist purchasing. Vessel owners want targeted cooling that protects propulsion and electrical assets without flooding wider compartments. The USA Coast Guard supplement published in November 2025 lists category 162.136 for water spray systems in machinery spaces. This category context supports the idea that machinery protection remains a regulated procurement area. Suppliers can use this demand to sell engineered layouts, approval support, and maintenance programs linked to vessel availability.
Older vessels create a tougher adoption route due to retrofit work inside existing rooms, bulkheads, and dry-dock windows. This restraint is not only a cost issue. It also affects survey timing, crew routines, and space for pumps or cylinders. MARAD lists 350 USA ports in its 2026 public dashboard, which shows the scale of service environments tied to vessel and port safety work. Suppliers that offer modular skids and clear survey packages can convert retrofit friction into service-led demand.
Fleet operators are looking for status visibility before a survey or incident exposes a system readiness problem. MARAD lists 189 vessels in the USA fleet in its 2026 public dashboard. That fleet base shows why inspection records and service readiness can support recurring supplier revenue. The opportunity is meaningful for startups and specialists that can add monitoring, alerts, and inspection records around installed systems. This route also connects water mist to fire hydrant systems in broader facility fire-safety planning.
Which country CAGRs are profiled in the water mist fire system market?
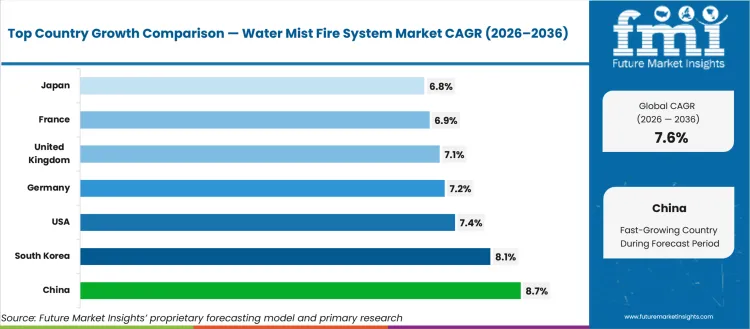
| Country | CAGR |
|---|---|
| United States | 7.4% |
| United Kingdom | 7.1% |
| Germany | 7.2% |
| France | 6.9% |
| Japan | 6.8% |
| China | 8.7% |
| South Korea | 8.1% |
| India | 8.4% |
How do country-level CAGRs compare in the water mist fire system market?
Country CAGR profiles in this market reflect two buyer groups. Established maritime economies are tied to retrofit cycles, class review, port maintenance, and service access. High-growth shipbuilding markets are tied more closely to newbuild activity, yard qualification, and policy support for fleet renewal. Offshore wind adds another layer in Europe and Japan due to service vessel and port electrical asset protection needs. For purchasing teams, the country comparison helps decide whether sales effort should focus on original installation, retrofit conversion, port tenders, or service-led fleet accounts.
- The United States is projected to grow at 7.4% CAGR by 2036, supported by port scale and maritime revitalization work. MARAD reported 1.8 million tons of cargo imports daily in its 2026 dashboard. This supports demand for port-adjacent fire protection and vessel safety services. The USA profile is more service-led than newbuild-led, so suppliers need compliance support and retrofit capability.
- Demand in the United Kingdom is expected to expand at 7.1% CAGR during the forecast period, driven by ports, ferries, offshore service vessels, and consultant-led refit planning. Department for Transport data showed 429.7 million tonnes handled by UK ports in 2024. The market compares differently from China or India owing to retrofit scheduling and vessel service density above newbuild volume.
- Germany is forecast to advance at 7.2% CAGR over the assessment period, owing to offshore energy service activity and engineering-led buying. German offshore wind industry data showed 73 offshore turbines first fed power into the grid in 2024. The evidence matters for water mist demand due to compact fire-control needs near power and machinery spaces.
- France is likely to expand at 6.9% CAGR by 2036, supported by offshore wind, naval work, and public port procurement. WindEurope reported France had 1.6 GW of operational offshore wind capacity in October 2025. The country profile is tender-heavy compared with Germany and the United Kingdom, so suppliers need documentation that works in public and engineering-review channels.
- Japan is estimated to rise at 6.8% CAGR between 2026 and 2036, shaped by careful shipyard specification and offshore wind planning. METI reported in March 2025 that 5.1 GW of offshore wind projects were being developed in 2024. The market differs from China owing to buyer trust and proven approvals carrying more weight than volume-led pricing.
- By 2036, China is projected to record 8.7% CAGR, propelled by shipbuilding scale and original-equipment access. State Council data reported China accounted for 56.1% of global shipbuilding output in 2025. This gives China a different profile from Western retrofit markets. Shipyard relationships and delivery timing become decisive for water mist suppliers seeking recurring newbuild specification.
- South Korea is anticipated to post 8.1% CAGR by 2036, reinforced by high-value vessel programs and alternative-fuel readiness. OECD reported that eco-friendly ships account for more than 50% of the main domestic shipbuilders investment amount. This country profile rewards suppliers that can provide fire-test evidence for methanol, ammonia-ready, LNG, and offshore applications.
- India is projected to grow at 8.4% CAGR over the assessment period, led by port modernization and shipbuilding policy support. The Press Information Bureau reported a INR 69,725 crore shipbuilding package in October 2025. India differs from South Korea due to higher price sensitivity in port and ship repair purchasing. Suppliers with local service partners can improve acceptance in port, repair, and offshore accounts.
Who are the notable companies in the water mist fire system market?
Marioff, Minimax, Danfoss Semco, Johnson Controls, FOGTEC, VID Fire-Kill, Ultra Fog, AQUASYS, Fike and Kidde Fire Systems are the notable companies shaping this market.
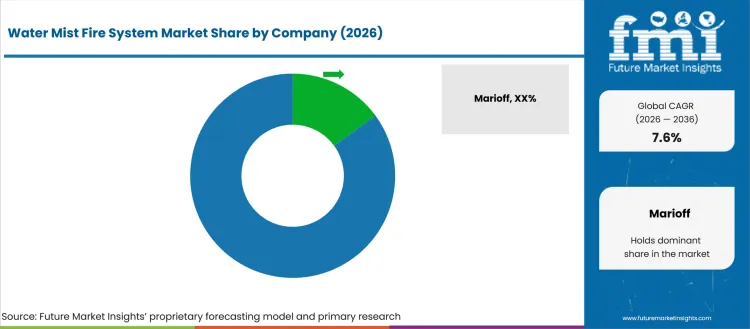
Supplier positioning is shaped by the layer of the buyer problem being solved. Marioff, Minimax, Danfoss Semco, and Johnson Controls are more relevant for buyers that need class-ready packages and service depth. FOGTEC, VID Fire-Kill, Ultra Fog, and AQUASYS become important for buyers seeking focused water mist engineering. Fike and Kidde Fire Systems remain relevant in adjacent special-hazard and bundled fire safety projects. The competitive question is whether a supplier can connect water mist to pumps, controls, training, and inspection routines while avoiding project coordination risk.
- Marine system suppliers such as Marioff and Minimax are suited to shipowners that need approval evidence and lifecycle support. Their role is not limited to pumps and nozzles. They help buyers connect fire-test documentation, crew training, and service planning into one procurement decision.
- Engineering-focused vendors such as Danfoss Semco and FOGTEC gain relevance in projects that need water mist layouts around tight mechanical rooms or infrastructure assets. Their portfolios matter when buyers compare discharge volume, pump design, nozzle performance, and commissioning support across fire stopping materials and suppression hardware.
- Specialist suppliers such as VID Fire-Kill, Ultra Fog, and AQUASYS are relevant to buyers that need dedicated water mist know-how. These companies can fit projects that require flexible layouts and low-water discharge. Their role centers on focused engineering instead of broad fire-safety bundling.
- Adjacent suppliers such as Johnson Controls, Fike, and Kidde Fire Systems support broader account shortlists. They matter when project teams combine water mist, alarms, detection, service contracts, fire retardant coatings, or special-hazard suppression inside one safety package. Data-sensitive rooms create similar water-damage concerns in data center fire detection and suppression projects.
Competitive Benchmarking: Water Mist Fire System Market
| Company | Marine approval fit | Water mist portfolio | Service capability | Geographic reach |
|---|---|---|---|---|
| Marioff | High | Strong | High | Global |
| Minimax | High | Strong | High | Global |
| Danfoss Semco | High | Strong | Medium | Global |
| Johnson Controls | Medium | Medium | Strong | Global |
| FOGTEC | Medium | Strong | Medium | Global |
| VID Fire-Kill | Medium | Strong | Regional | Europe and global projects |
| Ultra Fog | Medium | Strong | Regional | Europe and Asia |
| AQUASYS | Medium | Strong | Regional | Europe and industrial projects |
| Fike | Medium | Medium | Medium | Global |
| Kidde Fire Systems | Medium | Medium | Strong | Global |
Source: Future Market Insights competitive analysis, 2026. Ratings reflect relative portfolio relevance, workflow or project fit, service capability, and geographic reach.
Key Developments in the Water Mist Fire System Market
- In September 2024, Marioff reported that Carnival Cruise Line signed a HI-FOG crew training agreement in August 2024. The agreement matters to water mist buyers due to system readiness dependence on trained crew routines. It points to stronger supplier value in onboard instruction and lifecycle service.
- In June 2025, Marioff introduced HI-FOG Smart for real-time monitoring and centralized control. The launch matters due to fleet owner need for proof of system status before inspection or incident response. It signals a shift toward connected water mist service models.
- In December 2025, Minimax further developed Minifog marine XP for methanol fires and tested it under IMO MSC.1/Circ.1165. The update matters due to alternative-fuel vessel need for fuel-specific proof. It points to a higher evidence bar for suppliers serving methanol-ready ship projects.
- In March 2026, DNV reported that SSE 12 agreed draft amendments addressing water mist lances and fire safety in containership cargo areas. The development matters due to water mist requirements moving into more defined shipboard fire-control discussions. It supports demand for tested equipment and documentation.
Key Players in the Water Mist Fire System Market
Integrated Marine System Suppliers
- Marioff
- Minimax
- Danfoss Semco
- Johnson Controls
Specialist Water Mist Suppliers
- FOGTEC
- VID Fire-Kill
- Ultra Fog
- AQUASYS
Adjacent Suppression and Safety Suppliers
- Fike
- Kidde Fire Systems
Water Mist Fire System Market - Report Scope
| Coverage field | Report scope |
|---|---|
| Market breakdown | System Type, Application, End Use, Activation, Sales Channel, and Region |
| Market Definition | Fixed and engineered water mist systems that use fine droplets to cool fires and limit water damage in marine, offshore, naval, and port applications. |
| Regions Covered | North America, Latin America, Western Europe, Eastern Europe, East Asia, South Asia and Pacific, Middle East and Africa |
| Countries Covered | United States, United Kingdom, Germany, France, Japan, China, South Korea, India and broader regional coverage |
| Key Companies Profiled | Marioff, Minimax, Danfoss Semco, Johnson Controls, FOGTEC, VID Fire-Kill, Ultra Fog, AQUASYS, Fike, Kidde Fire Systems |
| Forecast Period | 2026 to 2036 |
| Approach | Hybrid bottom-up and top-down methodology using system pricing, vessel activity, retrofit cycles, channel evidence, and supplier portfolio checks |
Water Mist Fire System Market - Research Methodology
| Method | Approach |
|---|---|
| Primary Research | FMI analysts reviewed inputs from shipowners, EPC contractors, shipyards, offshore operators, port engineering teams, marine safety consultants, and fire protection integrators. Discussions focused on specification triggers, retrofit barriers, approval needs, service cycles, and price sensitivity. |
| Desk Research | Desk research covered vessel safety codes, Coast Guard equipment references, IMO and class-society updates, port and shipbuilding statistics, company product information, and official supplier news. Adjacent fire safety markets were reviewed only for scope comparison. |
| Market Sizing and Forecasting | The model combined pump and nozzle package pricing, vessel application mix, retrofit timing, newbuild activity, activation choice, and channel route differences. Demand assumptions were checked against country-level maritime activity and supplier portfolio depth. |
| Data Validation | Forecasts were checked against fire hazard location, approval evidence, service access, and public statistics. Duplicate external figures were removed before final drafting. Company portfolios were reviewed to avoid counting adjacent suppression suppliers without water mist relevance. |
Water Mist Fire System Market by Segments
Water Mist Fire System Market segmented by System Type:
- High-pressure Water Mist
- Low-pressure Water Mist
- Hybrid Water Mist
- Local Application Systems
Water Mist Fire System Market segmented by Application:
- Machinery Spaces
- Accommodation Areas
- Electrical Rooms
- Cargo / Storage Areas
Water Mist Fire System Market segmented by End Use:
- Commercial Vessels
- Offshore Platforms
- Naval / Coast Guard
- Ports & Terminals
Water Mist Fire System Market segmented by Activation:
- Automatic
- Manual / Semi-automatic
Water Mist Fire System Market segmented by Sales Channel:
- Direct OEM
- EPC / Shipyard
- Service Retrofit
Water Mist Fire System Market by Region:
- North America
- United States
- Canada
- Mexico
- Latin America
- Brazil
- Chile
- Rest of Latin America
- Western Europe
- Germany
- United Kingdom
- Italy
- Spain
- France
- Nordic
- BENELUX
- Rest of Western Europe
- Eastern Europe
- Russia
- Poland
- Hungary
- Balkan & Baltic
- Rest of Eastern Europe
- East Asia
- China
- Japan
- South Korea
- South Asia and Pacific
- India
- ASEAN
- Australia & New Zealand
- Rest of South Asia and Pacific
- Middle East & Africa
- Kingdom of Saudi Arabia
- Other GCC Countries
- Turkiye
- South Africa
- Other African Union
- Rest of Middle East & Africa
Research Sources and Bibliography
- USA Coast Guard. (2025, November 12). USA Supplement 11.12.25. USA Coast Guard.
- DNV. (2025, March 3). IMO Sub-Committee on Ship Systems and Equipment (SSE 11). DNV.
- DNV. (2026, March 13). IMO Sub-Committee on Ship Systems and Equipment (SSE 12). DNV.
- Department for Transport. (2025, July 30). Port freight annual statistics: 2024. GOV.UK.
- USA Maritime Administration. (2026). MARAD By the Numbers. USA Department of Transportation.
- The White House. (2026, February). Restoring America’s Maritime Dominance. The White House.
- Ministry of Industry and Information Technology. (2026, February 1). China’s shipbuilding sector maintains global lead in 2025. The State Council of the People’s Republic of China.
- Ministry of Ports, Shipping and Waterways. (2025, October 26). India’s Maritime India Vision 2047. Press Information Bureau.
- German Offshore Wind Energy Foundation. (2025, February 4). Expansion of offshore wind energy 2024: New government must act.
- WindEurope. (2025, October 1). France awards its largest offshore wind project to date. WindEurope.
- Ministry of Economy, Trade and Industry. (2025, March 28). Japan’s offshore wind power generation now and the future. Agency for Natural Resources and Energy.
- Organisation for Economic Co-operation and Development. (2026, April 8). Peer Review of the Korean Shipbuilding Industry 2026. OECD.
- Marioff. (2024, September 20). Carnival Cruise Line and Marioff sign HI-FOG crew training agreement. Marioff.
- Marioff. (2025, June 24). Marioff pioneers IoT innovation in water mist fire protection. Marioff.
- Minimax. (2025, December 2). Minimax Minifog marine XP extinguishing system complies with IMO 1165 guidelines. Minimax.
This bibliography is provided for reader reference and uses primary government, standards-body, official trade body, and company sources.
This Report Answers
- What is the expected global value of the Water Mist Fire System Market in 2026 and 2036?
- What CAGR is forecast for the Water Mist Fire System Market during the 2026 to 2036 period?
- Which system type has a notable share in the Water Mist Fire System Market?
- Why do machinery spaces create recurring demand for water mist fire systems?
- How do commercial vessels shape end-use demand in the forecast?
- Which countries are compared in the Water Mist Fire System Market forecast?
- Which companies compete across water mist systems and adjacent marine suppression?
- What capabilities are included within the Water Mist Fire System Market definition?
- How does FMI size and forecast water mist fire system demand across segments and countries?
- What buyer factors should executives assess before selecting suppliers?
Frequently Asked Questions
What is driving growth in the Water Mist Fire System Market?
Growth is driven by machinery-space fire exposure and retrofit service demand.
Why should executives track the Water Mist Fire System Market?
Executives should track this market because water mist systems reduce fire risk in machinery spaces while limiting collateral damage and supporting regulatory compliance.
What business problem does the Water Mist Fire System Market address?
It suppresses fires in confined high risk areas using fine water droplets that cool flames and protect critical equipment.
What should procurement leaders evaluate before selecting suppliers?
Procurement leaders should evaluate class approval fire test evidence pump reliability nozzle performance documentation quality and service coverage.
What can limit return on investment for buyers?
Return on investment can be limited by retrofit complexity space constraints and insufficient crew training or maintenance readiness.
How can suppliers build executive confidence?
Suppliers build confidence by delivering certified systems proven performance clear documentation lifecycle service support and crew training programs.
Preview the report firsthand - request a free sample
Get SampleGet the brochure for pricing and purchase details.
Get PDFTable of Content
- Key Takeaways
- Market Size and CAGR
- Top Growth Driver
- Fastest Growing Segment
- Leading Region
- Key Companies
- Emerging Opportunities
- Executive Summary
- Global Market Outlook
- Demand-side Trends
- Supply-side Trends
- Technology Roadmap Analysis
- Analysis and Recommendations
- Analyst Perspective (What is happening? Why now? What should investors know?)
- Key Questions Answered
- How large is the market?
- What is the CAGR?
- What are key trends?
- Which region dominates?
- Who are the leaders?
- Market Overview
- Market Coverage / Taxonomy
- Market Definition / Scope / Limitations
- Research Methodology
- Chapter Orientation
- Analytical Lens and Working Hypotheses
- Market Structure, Signals, and Trend Drivers
- Benchmarking and Cross-market Comparability
- Market Sizing, Forecasting, and Opportunity Mapping
- Research Design and Evidence Framework
- Desk Research Programme (Secondary Evidence)
- Expert Input and Fieldwork (Primary Evidence)
- Tooling, Models, and Reference Databases
- Data Engineering and Model Build
- Quality Assurance and Audit Trail
- Market Background
- Market Dynamics (Drivers, Restraints, Opportunity, Trends)
- Scenario Forecast (Optimistic, Likely, Conservative)
- Impact Analysis
- AI Impact
- Sustainability Impact
- Regulatory Impact
- Technology Impact
- Consumer / Buyer Analysis
- Purchase Drivers
- Adoption Barriers
- Buyer Journey
- Opportunity Map Analysis
- Product Life Cycle Analysis
- Supply Chain Analysis
- Investment Feasibility Matrix
- Value Chain Analysis
- PESTLE and Porter's Analysis
- Regulatory Landscape
- Regional Parent Market Outlook
- Production and Consumption Statistics
- Import and Export Statistics
- Global Market Analysis and Forecast, 2021 to 2036
- Historical Market Size Value (USD Billion) & Volume (Unit) Analysis, 2021 to 2025
- Current and Future Market Size Value (USD Billion) & Volume (Unit) Projections, 2026 to 2036
- Y-o-Y Growth Trend Analysis
- Absolute $ Opportunity Analysis
- Global Market Pricing Analysis, 2021 to 2036
- Global Market Analysis and Forecast, By Application, 2021 to 2036
- Introduction / Key Findings
- Historical Market Size Value (USD Billion) & Volume (Unit) Analysis By Application, 2021 to 2025
- Current and Future Market Size Value (USD Billion) & Volume (Unit) Analysis and Forecast By Application, 2026 to 2036
- Machinery Spaces
- Accommodation Areas
- Electrical Rooms
- Cargo / Storage Areas
- Machinery Spaces
- Y-o-Y Growth Trend Analysis By Application, 2021 to 2025
- Absolute $ Opportunity Analysis By Application, 2026 to 2036
- Global Market Analysis and Forecast, By End Use, 2021 to 2036
- Introduction / Key Findings
- Historical Market Size Value (USD Billion) & Volume (Unit) Analysis By End Use, 2021 to 2025
- Current and Future Market Size Value (USD Billion) & Volume (Unit) Analysis and Forecast By End Use, 2026 to 2036
- Commercial Vessel
- Offshore Platforms
- Ports & Terminals
- Naval / Coast Guard
- Commercial Vessel
- Y-o-Y Growth Trend Analysis By End Use, 2021 to 2025
- Absolute $ Opportunity Analysis By End Use, 2026 to 2036
- Global Market Analysis and Forecast, By Activation, 2021 to 2036
- Introduction / Key Findings
- Historical Market Size Value (USD Billion) & Volume (Unit) Analysis By Activation, 2021 to 2025
- Current and Future Market Size Value (USD Billion) & Volume (Unit) Analysis and Forecast By Activation, 2026 to 2036
- Automatic
- Manual / Semi-automatic
- Automatic
- Y-o-Y Growth Trend Analysis By Activation, 2021 to 2025
- Absolute $ Opportunity Analysis By Activation, 2026 to 2036
- Global Market Analysis and Forecast, By Sales Channel, 2021 to 2036
- Introduction / Key Findings
- Historical Market Size Value (USD Billion) & Volume (Unit) Analysis By Sales Channel, 2021 to 2025
- Current and Future Market Size Value (USD Billion) & Volume (Unit) Analysis and Forecast By Sales Channel, 2026 to 2036
- EPC / Shipyard
- Direct OEM
- Service Retrofit
- EPC / Shipyard
- Y-o-Y Growth Trend Analysis By Sales Channel, 2021 to 2025
- Absolute $ Opportunity Analysis By Sales Channel, 2026 to 2036
- Global Market Analysis and Forecast, By System Type, 2021 to 2036
- Introduction / Key Findings
- Historical Market Size Value (USD Billion) & Volume (Unit) Analysis By System Type, 2021 to 2025
- Current and Future Market Size Value (USD Billion) & Volume (Unit) Analysis and Forecast By System Type, 2026 to 2036
- High-pressure Water Mist
- Low-pressure Water Mist
- Hybrid Water Mist
- Local Application Systems
- High-pressure Water Mist
- Y-o-Y Growth Trend Analysis By System Type, 2021 to 2025
- Absolute $ Opportunity Analysis By System Type, 2026 to 2036
- Global Market Analysis and Forecast, By Region, 2021 to 2036
- Introduction
- Historical Market Size Value (USD Billion) & Volume (Unit) Analysis By Region, 2021 to 2025
- Current Market Size Value (USD Billion) & Volume (Unit) Analysis and Forecast By Region, 2026 to 2036
- North America
- Latin America
- Western Europe
- Eastern Europe
- East Asia
- South Asia and Pacific
- Middle East & Africa
- Market Attractiveness Analysis By Region
- North America Market Analysis and Forecast, By Country, 2021 to 2036
- Historical Market Size Value (USD Billion) & Volume (Unit) Trend Analysis By Market Taxonomy, 2021 to 2025
- Market Size Value (USD Billion) & Volume (Unit) Forecast By Market Taxonomy, 2026 to 2036
- By Country
- USA
- Canada
- Mexico
- By Application
- By End Use
- By Activation
- By Sales Channel
- By System Type
- By Country
- Market Attractiveness Analysis
- By Country
- By Application
- By End Use
- By Activation
- By Sales Channel
- By System Type
- Key Takeaways
- Latin America Market Analysis and Forecast, By Country
- Historical Market Size Value (USD Billion) & Volume (Unit) Trend Analysis By Market Taxonomy, 2021 to 2025
- Market Size Value (USD Billion) & Volume (Unit) Forecast By Market Taxonomy, 2026 to 2036
- By Country
- Brazil
- Chile
- Rest of Latin America
- By Application
- By End Use
- By Activation
- By Sales Channel
- By System Type
- By Country
- Market Attractiveness Analysis
- By Country
- By Application
- By End Use
- By Activation
- By Sales Channel
- By System Type
- Key Takeaways
- Western Europe Market Analysis and Forecast, By Country
- Historical Market Size Value (USD Billion) & Volume (Unit) Trend Analysis By Market Taxonomy, 2021 to 2025
- Market Size Value (USD Billion) & Volume (Unit) Forecast By Market Taxonomy, 2026 to 2036
- By Country
- Germany
- UK
- Italy
- Spain
- France
- Nordic
- BENELUX
- Rest of Western Europe
- By Application
- By End Use
- By Activation
- By Sales Channel
- By System Type
- By Country
- Market Attractiveness Analysis
- By Country
- By Application
- By End Use
- By Activation
- By Sales Channel
- By System Type
- Key Takeaways
- Eastern Europe Market Analysis and Forecast, By Country
- Historical Market Size Value (USD Billion) & Volume (Unit) Trend Analysis By Market Taxonomy, 2021 to 2025
- Market Size Value (USD Billion) & Volume (Unit) Forecast By Market Taxonomy, 2026 to 2036
- By Country
- Russia
- Poland
- Hungary
- Balkan & Baltic
- Rest of Eastern Europe
- By Application
- By End Use
- By Activation
- By Sales Channel
- By System Type
- By Country
- Market Attractiveness Analysis
- By Country
- By Application
- By End Use
- By Activation
- By Sales Channel
- By System Type
- Key Takeaways
- East Asia Market Analysis and Forecast, By Country
- Historical Market Size Value (USD Billion) & Volume (Unit) Trend Analysis By Market Taxonomy, 2021 to 2025
- Market Size Value (USD Billion) & Volume (Unit) Forecast By Market Taxonomy, 2026 to 2036
- By Country
- China
- Japan
- South Korea
- By Application
- By End Use
- By Activation
- By Sales Channel
- By System Type
- By Country
- Market Attractiveness Analysis
- By Country
- By Application
- By End Use
- By Activation
- By Sales Channel
- By System Type
- Key Takeaways
- South Asia and Pacific Market Analysis and Forecast, By Country
- Historical Market Size Value (USD Billion) & Volume (Unit) Trend Analysis By Market Taxonomy, 2021 to 2025
- Market Size Value (USD Billion) & Volume (Unit) Forecast By Market Taxonomy, 2026 to 2036
- By Country
- India
- ASEAN
- Australia & New Zealand
- Rest of South Asia and Pacific
- By Application
- By End Use
- By Activation
- By Sales Channel
- By System Type
- By Country
- Market Attractiveness Analysis
- By Country
- By Application
- By End Use
- By Activation
- By Sales Channel
- By System Type
- Key Takeaways
- Middle East & Africa Market Analysis and Forecast, By Country
- Historical Market Size Value (USD Billion) & Volume (Unit) Trend Analysis By Market Taxonomy, 2021 to 2025
- Market Size Value (USD Billion) & Volume (Unit) Forecast By Market Taxonomy, 2026 to 2036
- By Country
- Kingdom of Saudi Arabia
- Other GCC Countries
- Türkiye
- South Africa
- Other African Union
- Rest of Middle East & Africa
- By Application
- By End Use
- By Activation
- By Sales Channel
- By System Type
- By Country
- Market Attractiveness Analysis
- By Country
- By Application
- By End Use
- By Activation
- By Sales Channel
- By System Type
- Key Takeaways
- Key Countries Market Analysis
- USA
- Pricing Analysis
- Market Share Analysis, 2025
- By Application
- By End Use
- By Activation
- By Sales Channel
- By System Type
- Canada
- Pricing Analysis
- Market Share Analysis, 2025
- By Application
- By End Use
- By Activation
- By Sales Channel
- By System Type
- Mexico
- Pricing Analysis
- Market Share Analysis, 2025
- By Application
- By End Use
- By Activation
- By Sales Channel
- By System Type
- Brazil
- Pricing Analysis
- Market Share Analysis, 2025
- By Application
- By End Use
- By Activation
- By Sales Channel
- By System Type
- Chile
- Pricing Analysis
- Market Share Analysis, 2025
- By Application
- By End Use
- By Activation
- By Sales Channel
- By System Type
- Germany
- Pricing Analysis
- Market Share Analysis, 2025
- By Application
- By End Use
- By Activation
- By Sales Channel
- By System Type
- UK
- Pricing Analysis
- Market Share Analysis, 2025
- By Application
- By End Use
- By Activation
- By Sales Channel
- By System Type
- Italy
- Pricing Analysis
- Market Share Analysis, 2025
- By Application
- By End Use
- By Activation
- By Sales Channel
- By System Type
- Spain
- Pricing Analysis
- Market Share Analysis, 2025
- By Application
- By End Use
- By Activation
- By Sales Channel
- By System Type
- France
- Pricing Analysis
- Market Share Analysis, 2025
- By Application
- By End Use
- By Activation
- By Sales Channel
- By System Type
- India
- Pricing Analysis
- Market Share Analysis, 2025
- By Application
- By End Use
- By Activation
- By Sales Channel
- By System Type
- ASEAN
- Pricing Analysis
- Market Share Analysis, 2025
- By Application
- By End Use
- By Activation
- By Sales Channel
- By System Type
- Australia & New Zealand
- Pricing Analysis
- Market Share Analysis, 2025
- By Application
- By End Use
- By Activation
- By Sales Channel
- By System Type
- China
- Pricing Analysis
- Market Share Analysis, 2025
- By Application
- By End Use
- By Activation
- By Sales Channel
- By System Type
- Japan
- Pricing Analysis
- Market Share Analysis, 2025
- By Application
- By End Use
- By Activation
- By Sales Channel
- By System Type
- South Korea
- Pricing Analysis
- Market Share Analysis, 2025
- By Application
- By End Use
- By Activation
- By Sales Channel
- By System Type
- Russia
- Pricing Analysis
- Market Share Analysis, 2025
- By Application
- By End Use
- By Activation
- By Sales Channel
- By System Type
- Poland
- Pricing Analysis
- Market Share Analysis, 2025
- By Application
- By End Use
- By Activation
- By Sales Channel
- By System Type
- Hungary
- Pricing Analysis
- Market Share Analysis, 2025
- By Application
- By End Use
- By Activation
- By Sales Channel
- By System Type
- Kingdom of Saudi Arabia
- Pricing Analysis
- Market Share Analysis, 2025
- By Application
- By End Use
- By Activation
- By Sales Channel
- By System Type
- Türkiye
- Pricing Analysis
- Market Share Analysis, 2025
- By Application
- By End Use
- By Activation
- By Sales Channel
- By System Type
- South Africa
- Pricing Analysis
- Market Share Analysis, 2025
- By Application
- By End Use
- By Activation
- By Sales Channel
- By System Type
- USA
- Market Structure Analysis
- Competition Dashboard
- Competition Benchmarking
- Market Share Analysis of Top Players
- By Regional
- By Application
- By End Use
- By Activation
- By Sales Channel
- By System Type
- Emerging Startups
- Innovation Benchmarking
- Competition Analysis
- Competition Deep Dive
- Marioff
- Overview
- Product Portfolio
- Profitability by Market Segments (Product/Region/Sales Channel)
- Sales Footprint
- Strategy Overview
- Marketing Strategy
- Product Strategy
- Channel Strategy
- Minimax
- Danfoss Semco
- Johnson Controls
- FOGTEC
- VID Fire-Kill
- Marioff
- Case Studies
- Success Stories
- Recent Developments
- Competition Deep Dive
- Assumptions & Acronyms Used


