Methodology

Whole-Body Imaging Market Size and Share Forecast Outlook 2025 to 2035

The Whole-Body Imaging Market is estimated to be valued at USD 20.9 billion in 2025 and is projected to reach USD 38.5 billion by 2035, registering a compound annual growth rate (CAGR) of 6.3% over the forecast period.

Quick Stats for Whole-Body Imaging Market

  • Whole-Body Imaging Market Value (2025): USD 20.9 billion
  • Whole-Body Imaging Market Forecast Value (2035): USD 38.5 billion
  • Whole-Body Imaging Market Forecast CAGR: 6.3%
  • Leading Segment in Whole-Body Imaging Market in 2025: Positron Emission Tomography Scan (55.0%)
  • Key Growth Regions in Whole-Body Imaging Market: North America, Asia-Pacific, Europe
  • Top Key Players in Whole-Body Imaging Market: Siemens Healthineers, GE Healthcare, Philips Healthcare, Canon Medical Systems, Hitachi Medical Corporation, Fujifilm Holdings, Samsung Medison, Mindray Medical International

Whole Body Imaging Market Market Value Analysis

Whole-Body Imaging Market Key Takeaways

Metric Value
Whole-Body Imaging Market Estimated Value in (2025 E) USD 20.9 billion
Whole-Body Imaging Market Forecast Value in (2035 F) USD 38.5 billion
Forecast CAGR (2025 to 2035) 6.3%

Why is the Whole-Body Imaging Market Growing?

The Whole-Body Imaging market is experiencing steady growth, driven by the increasing demand for advanced diagnostic imaging technologies in both developed and emerging markets. The market is expected to see continued expansion due to the rising prevalence of chronic diseases and cancer, along with the growing focus on early diagnosis and precision medicine.

Technological advancements, particularly in Positron Emission Tomography (PET) and magnetic resonance imaging (MRI), have improved the accuracy, resolution, and speed of imaging, further driving adoption. Additionally, healthcare infrastructure improvements, along with an aging global population, are fueling demand for comprehensive diagnostic solutions.

The trend toward personalized treatment plans and the integration of artificial intelligence in imaging technologies are also expected to boost market growth As awareness of the benefits of early disease detection increases, the Whole-Body Imaging market is poised for robust growth, with expanding applications in hospitals, research institutions, and diagnostic centers.

Segmental Analysis

The whole-body imaging market is segmented by product type, application, and geographic regions. By product type, whole-body imaging market is divided into Positron Emission Tomography Scan and Computed Tomography Scan. In terms of application, whole-body imaging market is classified into Hospitals, Specialty Clinics, and Diagnostic Centers. Regionally, the whole-body imaging industry is classified into North America, Latin America, Western Europe, Eastern Europe, Balkan & Baltic Countries, Russia & Belarus, Central Asia, East Asia, South Asia & Pacific, and the Middle East & Africa.
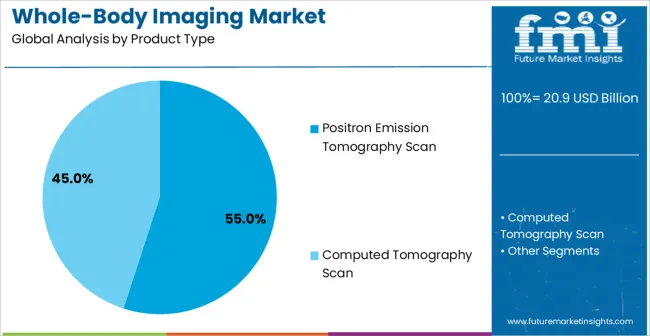
Insights into the Positron Emission Tomography Scan Segment

Whole Body Imaging Market Analysis By Product Type

The Positron Emission Tomography (PET) scan segment is projected to hold 55.00% of the Whole-Body Imaging market revenue share in 2025, establishing it as the leading product type. This growth is attributed to the high diagnostic accuracy and ability to detect diseases at early stages, particularly cancers, cardiovascular diseases, and neurological disorders.

PET scans offer the advantage of capturing real-time metabolic processes, allowing for more comprehensive and precise diagnoses compared to traditional imaging methods. The increasing preference for non-invasive diagnostic techniques and the ability to monitor treatment responses further drive the adoption of PET scans in clinical settings.

As healthcare providers focus on improving patient outcomes through early detection, PET scans have become a cornerstone in modern diagnostic imaging Moreover, the growing number of hospitals and research centers adopting advanced imaging technologies supports the continued dominance of this segment.
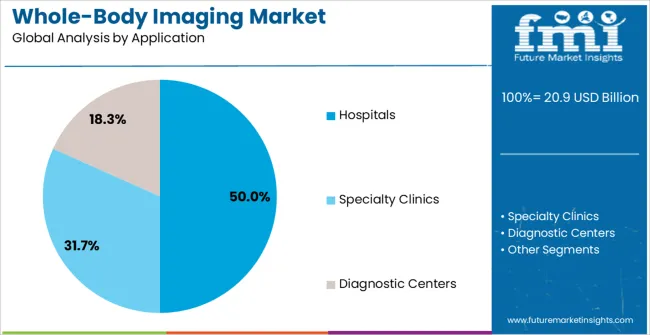
Insights into the Hospitals End-Use Segment

Whole Body Imaging Market Analysis By Application

The hospitals end-use segment is expected to capture 50.00% of the Whole-Body Imaging market revenue share in 2025, making it a key driver of market growth. Hospitals represent a significant portion of the healthcare sector, where advanced imaging systems, including whole-body imaging technologies, are essential for accurate diagnostics, treatment planning, and monitoring.

The growing number of hospital-based diagnostic centers and an increasing shift toward personalized medicine have contributed to the rise in demand for sophisticated imaging techniques. Hospitals require high-throughput imaging systems that can handle large volumes of patients while providing precise diagnostic information.

The integration of artificial intelligence into imaging workflows, which enhances the speed and accuracy of diagnoses, has further fueled the adoption of whole-body imaging in hospitals Additionally, the rising prevalence of chronic conditions and cancer is creating a sustained need for advanced diagnostic tools in hospital settings, ensuring continued growth for this segment.

Market Overview

Whole-body imaging refers to Magnetic Resonance Imaging (MRI) or full-body CT scan in the healthcare sector. It is considered to be an effective and quick modality to detect a particular disease in an individual’s body.

These imaging systems are capable of broadening the scope of vision in terms of the biological function of the body. These also help in tracking the immune system’s cellular activities in real-time.

These can enhance the ability of healthcare professionals to detect a metastatic spread, carotid, as well as peripheral vascular disease. These utilize computed tomography to generate elaborate, cross-sectional, and thin X-ray images. These images further allow doctors to examine a particular area of the patient’s body, such as the lungs or heart.

The rapid improvement in PET and CT scans is expected to boost the development of accurate and safe procedures that can be used in emergency cases. The introduction of portable devices, surging dependency on computing power, and enhancements in detector systems are likely to propel the market. In addition to this, the miniaturization of electronics is anticipated to spur the sales of whole-body imaging systems.

Analysis of Whole-Body Imaging Market By Key Countries

Whole Body Imaging Market Cagr Analysis By Country

Country CAGR
China 8.5%
India 7.9%
Germany 7.2%
Brazil 6.6%
USA 6.0%
UK 5.4%
Japan 4.7%

Country-wise Analysis

The Whole-Body Imaging Market is expected to register a CAGR of 6.3% during the forecast period, exhibiting varied country level momentum. China leads with the highest CAGR of 8.5%, followed by India at 7.9%. Developed markets such as Germany, France, and the UK continue to expand steadily, while the USA is likely to grow at consistent rates. Japan posts the lowest CAGR at 4.7%, yet still underscores a broadly positive trajectory for the global Whole-Body Imaging Market. In 2024, Germany held a dominant revenue in the Western Europe market and is expected to grow with a CAGR of 7.2%. The USA Whole-Body Imaging Market is estimated to be valued at USD 7.4 billion in 2025 and is anticipated to reach a valuation of USD 7.4 billion by 2035. Sales are projected to rise at a CAGR of 0.0% over the forecast period between 2025 and 2035. While Japan and South Korea markets are estimated to be valued at USD 1.1 billion and USD 574.5 million respectively in 2025.

Key Players in the Whole-Body Imaging Market

Whole Body Imaging Market Analysis By Company

  • Siemens Healthineers
  • GE Healthcare
  • Philips Healthcare
  • Canon Medical Systems
  • Hitachi Medical Corporation
  • Fujifilm Holdings
  • Samsung Medison
  • Mindray Medical International

Scope of the Report

Item Value
Quantitative Units USD 20.9 Billion
Product Type Positron Emission Tomography Scan and Computed Tomography Scan
Application Hospitals, Specialty Clinics, and Diagnostic Centers
Regions Covered North America, Europe, Asia-Pacific, Latin America, Middle East & Africa
Country Covered United States, Canada, Germany, France, United Kingdom, China, Japan, India, Brazil, South Africa
Key Companies Profiled Siemens Healthineers, GE Healthcare, Philips Healthcare, Canon Medical Systems, Hitachi Medical Corporation, Fujifilm Holdings, Samsung Medison, and Mindray Medical International

Whole-Body Imaging Market by Segments

Product Type:

  • Positron Emission Tomography Scan
  • Computed Tomography Scan

Application:

  • Hospitals
  • Specialty Clinics
  • Diagnostic Centers

Region:

  • North America
    • USA
    • Canada
    • Mexico
  • Latin America
    • Brazil
    • Chile
    • Rest of Latin America
  • Western Europe
    • Germany
    • UK
    • Italy
    • Spain
    • France
    • Nordic
    • BENELUX
    • Rest of Western Europe
  • Eastern Europe
    • Russia
    • Poland
    • Hungary
    • Balkan & Baltic
    • Rest of Eastern Europe
  • East Asia
    • China
    • Japan
    • South Korea
  • South Asia and Pacific
    • India
    • ASEAN
    • Australia & New Zealand
    • Rest of South Asia and Pacific
  • Middle East & Africa
    • Kingdom of Saudi Arabia
    • Other GCC Countries
    • Turkiye
    • South Africa
    • Other African Union
    • Rest of Middle East & Africa

Frequently Asked Questions

How big is the whole-body imaging market in 2025?

The global whole-body imaging market is estimated to be valued at USD 20.9 billion in 2025.

What will be the size of whole-body imaging market in 2035?

The market size for the whole-body imaging market is projected to reach USD 38.5 billion by 2035.

How much will be the whole-body imaging market growth between 2025 and 2035?

The whole-body imaging market is expected to grow at a 6.3% CAGR between 2025 and 2035.

What are the key product types in the whole-body imaging market?

The key product types in whole-body imaging market are positron emission tomography scan and computed tomography scan.

Which application segment to contribute significant share in the whole-body imaging market in 2025?

In terms of application, hospitals segment to command 50.0% share in the whole-body imaging market in 2025.

Table of Content

  1. Executive Summary
    • Global Market Outlook
    • Demand-side Trends
    • Supply-side Trends
    • Technology Roadmap Analysis
    • Analysis and Recommendations
  2. Market Overview
    • Market Coverage / Taxonomy
    • Market Definition / Scope / Limitations
  3. Market Background
    • Market Dynamics
      • Drivers
      • Restraints
      • Opportunity
      • Trends
    • Scenario Forecast
      • Demand in Optimistic Scenario
      • Demand in Likely Scenario
      • Demand in Conservative Scenario
    • Opportunity Map Analysis
    • Product Life Cycle Analysis
    • Supply Chain Analysis
    • Investment Feasibility Matrix
    • Value Chain Analysis
    • PESTLE and Porter’s Analysis
    • Regulatory Landscape
    • Regional Parent Market Outlook
    • Production and Consumption Statistics
    • Import and Export Statistics
  4. Global Market Analysis 2020 to 2024 and Forecast, 2025 to 2035
    • Historical Market Size Value (USD Million) Analysis, 2020 to 2024
    • Current and Future Market Size Value (USD Million) Projections, 2025 to 2035
      • Y-o-Y Growth Trend Analysis
      • Absolute $ Opportunity Analysis
  5. Global Market Pricing Analysis 2020 to 2024 and Forecast 2025 to 2035
  6. Global Market Analysis 2020 to 2024 and Forecast 2025 to 2035, By Product Type
    • Introduction / Key Findings
    • Historical Market Size Value (USD Million) Analysis By Product Type , 2020 to 2024
    • Current and Future Market Size Value (USD Million) Analysis and Forecast By Product Type , 2025 to 2035
      • Positron Emission Tomography Scan
      • Computed Tomography Scan
    • Y-o-Y Growth Trend Analysis By Product Type , 2020 to 2024
    • Absolute $ Opportunity Analysis By Product Type , 2025 to 2035
  7. Global Market Analysis 2020 to 2024 and Forecast 2025 to 2035, By Application
    • Introduction / Key Findings
    • Historical Market Size Value (USD Million) Analysis By Application, 2020 to 2024
    • Current and Future Market Size Value (USD Million) Analysis and Forecast By Application, 2025 to 2035
      • Hospitals
      • Specialty Clinics
      • Diagnostic Centers
    • Y-o-Y Growth Trend Analysis By Application, 2020 to 2024
    • Absolute $ Opportunity Analysis By Application, 2025 to 2035
  8. Global Market Analysis 2020 to 2024 and Forecast 2025 to 2035, By Region
    • Introduction
    • Historical Market Size Value (USD Million) Analysis By Region, 2020 to 2024
    • Current Market Size Value (USD Million) Analysis and Forecast By Region, 2025 to 2035
      • North America
      • Latin America
      • Western Europe
      • Eastern Europe
      • East Asia
      • South Asia and Pacific
      • Middle East & Africa
    • Market Attractiveness Analysis By Region
  9. North America Market Analysis 2020 to 2024 and Forecast 2025 to 2035, By Country
    • Historical Market Size Value (USD Million) Trend Analysis By Market Taxonomy, 2020 to 2024
    • Market Size Value (USD Million) Forecast By Market Taxonomy, 2025 to 2035
      • By Country
        • USA
        • Canada
        • Mexico
      • By Product Type
      • By Application
    • Market Attractiveness Analysis
      • By Country
      • By Product Type
      • By Application
    • Key Takeaways
  10. Latin America Market Analysis 2020 to 2024 and Forecast 2025 to 2035, By Country
    • Historical Market Size Value (USD Million) Trend Analysis By Market Taxonomy, 2020 to 2024
    • Market Size Value (USD Million) Forecast By Market Taxonomy, 2025 to 2035
      • By Country
        • Brazil
        • Chile
        • Rest of Latin America
      • By Product Type
      • By Application
    • Market Attractiveness Analysis
      • By Country
      • By Product Type
      • By Application
    • Key Takeaways
  11. Western Europe Market Analysis 2020 to 2024 and Forecast 2025 to 2035, By Country
    • Historical Market Size Value (USD Million) Trend Analysis By Market Taxonomy, 2020 to 2024
    • Market Size Value (USD Million) Forecast By Market Taxonomy, 2025 to 2035
      • By Country
        • Germany
        • UK
        • Italy
        • Spain
        • France
        • Nordic
        • BENELUX
        • Rest of Western Europe
      • By Product Type
      • By Application
    • Market Attractiveness Analysis
      • By Country
      • By Product Type
      • By Application
    • Key Takeaways
  12. Eastern Europe Market Analysis 2020 to 2024 and Forecast 2025 to 2035, By Country
    • Historical Market Size Value (USD Million) Trend Analysis By Market Taxonomy, 2020 to 2024
    • Market Size Value (USD Million) Forecast By Market Taxonomy, 2025 to 2035
      • By Country
        • Russia
        • Poland
        • Hungary
        • Balkan & Baltic
        • Rest of Eastern Europe
      • By Product Type
      • By Application
    • Market Attractiveness Analysis
      • By Country
      • By Product Type
      • By Application
    • Key Takeaways
  13. East Asia Market Analysis 2020 to 2024 and Forecast 2025 to 2035, By Country
    • Historical Market Size Value (USD Million) Trend Analysis By Market Taxonomy, 2020 to 2024
    • Market Size Value (USD Million) Forecast By Market Taxonomy, 2025 to 2035
      • By Country
        • China
        • Japan
        • South Korea
      • By Product Type
      • By Application
    • Market Attractiveness Analysis
      • By Country
      • By Product Type
      • By Application
    • Key Takeaways
  14. South Asia and Pacific Market Analysis 2020 to 2024 and Forecast 2025 to 2035, By Country
    • Historical Market Size Value (USD Million) Trend Analysis By Market Taxonomy, 2020 to 2024
    • Market Size Value (USD Million) Forecast By Market Taxonomy, 2025 to 2035
      • By Country
        • India
        • ASEAN
        • Australia & New Zealand
        • Rest of South Asia and Pacific
      • By Product Type
      • By Application
    • Market Attractiveness Analysis
      • By Country
      • By Product Type
      • By Application
    • Key Takeaways
  15. Middle East & Africa Market Analysis 2020 to 2024 and Forecast 2025 to 2035, By Country
    • Historical Market Size Value (USD Million) Trend Analysis By Market Taxonomy, 2020 to 2024
    • Market Size Value (USD Million) Forecast By Market Taxonomy, 2025 to 2035
      • By Country
        • Kingdom of Saudi Arabia
        • Other GCC Countries
        • Turkiye
        • South Africa
        • Other African Union
        • Rest of Middle East & Africa
      • By Product Type
      • By Application
    • Market Attractiveness Analysis
      • By Country
      • By Product Type
      • By Application
    • Key Takeaways
  16. Key Countries Market Analysis
    • USA
      • Pricing Analysis
      • Market Share Analysis, 2024
        • By Product Type
        • By Application
    • Canada
      • Pricing Analysis
      • Market Share Analysis, 2024
        • By Product Type
        • By Application
    • Mexico
      • Pricing Analysis
      • Market Share Analysis, 2024
        • By Product Type
        • By Application
    • Brazil
      • Pricing Analysis
      • Market Share Analysis, 2024
        • By Product Type
        • By Application
    • Chile
      • Pricing Analysis
      • Market Share Analysis, 2024
        • By Product Type
        • By Application
    • Germany
      • Pricing Analysis
      • Market Share Analysis, 2024
        • By Product Type
        • By Application
    • UK
      • Pricing Analysis
      • Market Share Analysis, 2024
        • By Product Type
        • By Application
    • Italy
      • Pricing Analysis
      • Market Share Analysis, 2024
        • By Product Type
        • By Application
    • Spain
      • Pricing Analysis
      • Market Share Analysis, 2024
        • By Product Type
        • By Application
    • France
      • Pricing Analysis
      • Market Share Analysis, 2024
        • By Product Type
        • By Application
    • India
      • Pricing Analysis
      • Market Share Analysis, 2024
        • By Product Type
        • By Application
    • ASEAN
      • Pricing Analysis
      • Market Share Analysis, 2024
        • By Product Type
        • By Application
    • Australia & New Zealand
      • Pricing Analysis
      • Market Share Analysis, 2024
        • By Product Type
        • By Application
    • China
      • Pricing Analysis
      • Market Share Analysis, 2024
        • By Product Type
        • By Application
    • Japan
      • Pricing Analysis
      • Market Share Analysis, 2024
        • By Product Type
        • By Application
    • South Korea
      • Pricing Analysis
      • Market Share Analysis, 2024
        • By Product Type
        • By Application
    • Russia
      • Pricing Analysis
      • Market Share Analysis, 2024
        • By Product Type
        • By Application
    • Poland
      • Pricing Analysis
      • Market Share Analysis, 2024
        • By Product Type
        • By Application
    • Hungary
      • Pricing Analysis
      • Market Share Analysis, 2024
        • By Product Type
        • By Application
    • Kingdom of Saudi Arabia
      • Pricing Analysis
      • Market Share Analysis, 2024
        • By Product Type
        • By Application
    • Turkiye
      • Pricing Analysis
      • Market Share Analysis, 2024
        • By Product Type
        • By Application
    • South Africa
      • Pricing Analysis
      • Market Share Analysis, 2024
        • By Product Type
        • By Application
  17. Market Structure Analysis
    • Competition Dashboard
    • Competition Benchmarking
    • Market Share Analysis of Top Players
      • By Regional
      • By Product Type
      • By Application
  18. Competition Analysis
    • Competition Deep Dive
      • Siemens Healthineers
        • Overview
        • Product Portfolio
        • Profitability by Market Segments (Product/Age /Sales Channel/Region)
        • Sales Footprint
        • Strategy Overview
          • Marketing Strategy
          • Product Strategy
          • Channel Strategy
      • GE Healthcare
      • Philips Healthcare
      • Canon Medical Systems
      • Hitachi Medical Corporation
      • Fujifilm Holdings
      • Samsung Medison
      • Mindray Medical International
  19. Assumptions & Acronyms Used
  20. Research Methodology

List of Tables

  • Table 1: Global Market Value (USD Million) Forecast by Region, 2020-2035
  • Table 2: Global Market Value (USD Million) Forecast by Product Type , 2020-2035
  • Table 3: Global Market Value (USD Million) Forecast by Application, 2020-2035
  • Table 4: North America Market Value (USD Million) Forecast by Country, 2020-2035
  • Table 5: North America Market Value (USD Million) Forecast by Product Type , 2020-2035
  • Table 6: North America Market Value (USD Million) Forecast by Application, 2020-2035
  • Table 7: Latin America Market Value (USD Million) Forecast by Country, 2020-2035
  • Table 8: Latin America Market Value (USD Million) Forecast by Product Type , 2020-2035
  • Table 9: Latin America Market Value (USD Million) Forecast by Application, 2020-2035
  • Table 10: Western Europe Market Value (USD Million) Forecast by Country, 2020-2035
  • Table 11: Western Europe Market Value (USD Million) Forecast by Product Type , 2020-2035
  • Table 12: Western Europe Market Value (USD Million) Forecast by Application, 2020-2035
  • Table 13: Eastern Europe Market Value (USD Million) Forecast by Country, 2020-2035
  • Table 14: Eastern Europe Market Value (USD Million) Forecast by Product Type , 2020-2035
  • Table 15: Eastern Europe Market Value (USD Million) Forecast by Application, 2020-2035
  • Table 16: East Asia Market Value (USD Million) Forecast by Country, 2020-2035
  • Table 17: East Asia Market Value (USD Million) Forecast by Product Type , 2020-2035
  • Table 18: East Asia Market Value (USD Million) Forecast by Application, 2020-2035
  • Table 19: South Asia and Pacific Market Value (USD Million) Forecast by Country, 2020-2035
  • Table 20: South Asia and Pacific Market Value (USD Million) Forecast by Product Type , 2020-2035
  • Table 21: South Asia and Pacific Market Value (USD Million) Forecast by Application, 2020-2035
  • Table 22: Middle East & Africa Market Value (USD Million) Forecast by Country, 2020-2035
  • Table 23: Middle East & Africa Market Value (USD Million) Forecast by Product Type , 2020-2035
  • Table 24: Middle East & Africa Market Value (USD Million) Forecast by Application, 2020-2035

List of Figures

  • Figure 1: Global Market Pricing Analysis
  • Figure 2: Global Market Value (USD Million) Forecast 2020-2035
  • Figure 3: Global Market Value Share and BPS Analysis by Product Type , 2025 and 2035
  • Figure 4: Global Market Y-o-Y Growth Comparison by Product Type , 2025-2035
  • Figure 5: Global Market Attractiveness Analysis by Product Type
  • Figure 6: Global Market Value Share and BPS Analysis by Application, 2025 and 2035
  • Figure 7: Global Market Y-o-Y Growth Comparison by Application, 2025-2035
  • Figure 8: Global Market Attractiveness Analysis by Application
  • Figure 9: Global Market Value (USD Million) Share and BPS Analysis by Region, 2025 and 2035
  • Figure 10: Global Market Y-o-Y Growth Comparison by Region, 2025-2035
  • Figure 11: Global Market Attractiveness Analysis by Region
  • Figure 12: North America Market Incremental Dollar Opportunity, 2025-2035
  • Figure 13: Latin America Market Incremental Dollar Opportunity, 2025-2035
  • Figure 14: Western Europe Market Incremental Dollar Opportunity, 2025-2035
  • Figure 15: Eastern Europe Market Incremental Dollar Opportunity, 2025-2035
  • Figure 16: East Asia Market Incremental Dollar Opportunity, 2025-2035
  • Figure 17: South Asia and Pacific Market Incremental Dollar Opportunity, 2025-2035
  • Figure 18: Middle East & Africa Market Incremental Dollar Opportunity, 2025-2035
  • Figure 19: North America Market Value Share and BPS Analysis by Country, 2025 and 2035
  • Figure 20: North America Market Value Share and BPS Analysis by Product Type , 2025 and 2035
  • Figure 21: North America Market Y-o-Y Growth Comparison by Product Type , 2025-2035
  • Figure 22: North America Market Attractiveness Analysis by Product Type
  • Figure 23: North America Market Value Share and BPS Analysis by Application, 2025 and 2035
  • Figure 24: North America Market Y-o-Y Growth Comparison by Application, 2025-2035
  • Figure 25: North America Market Attractiveness Analysis by Application
  • Figure 26: Latin America Market Value Share and BPS Analysis by Country, 2025 and 2035
  • Figure 27: Latin America Market Value Share and BPS Analysis by Product Type , 2025 and 2035
  • Figure 28: Latin America Market Y-o-Y Growth Comparison by Product Type , 2025-2035
  • Figure 29: Latin America Market Attractiveness Analysis by Product Type
  • Figure 30: Latin America Market Value Share and BPS Analysis by Application, 2025 and 2035
  • Figure 31: Latin America Market Y-o-Y Growth Comparison by Application, 2025-2035
  • Figure 32: Latin America Market Attractiveness Analysis by Application
  • Figure 33: Western Europe Market Value Share and BPS Analysis by Country, 2025 and 2035
  • Figure 34: Western Europe Market Value Share and BPS Analysis by Product Type , 2025 and 2035
  • Figure 35: Western Europe Market Y-o-Y Growth Comparison by Product Type , 2025-2035
  • Figure 36: Western Europe Market Attractiveness Analysis by Product Type
  • Figure 37: Western Europe Market Value Share and BPS Analysis by Application, 2025 and 2035
  • Figure 38: Western Europe Market Y-o-Y Growth Comparison by Application, 2025-2035
  • Figure 39: Western Europe Market Attractiveness Analysis by Application
  • Figure 40: Eastern Europe Market Value Share and BPS Analysis by Country, 2025 and 2035
  • Figure 41: Eastern Europe Market Value Share and BPS Analysis by Product Type , 2025 and 2035
  • Figure 42: Eastern Europe Market Y-o-Y Growth Comparison by Product Type , 2025-2035
  • Figure 43: Eastern Europe Market Attractiveness Analysis by Product Type
  • Figure 44: Eastern Europe Market Value Share and BPS Analysis by Application, 2025 and 2035
  • Figure 45: Eastern Europe Market Y-o-Y Growth Comparison by Application, 2025-2035
  • Figure 46: Eastern Europe Market Attractiveness Analysis by Application
  • Figure 47: East Asia Market Value Share and BPS Analysis by Country, 2025 and 2035
  • Figure 48: East Asia Market Value Share and BPS Analysis by Product Type , 2025 and 2035
  • Figure 49: East Asia Market Y-o-Y Growth Comparison by Product Type , 2025-2035
  • Figure 50: East Asia Market Attractiveness Analysis by Product Type
  • Figure 51: East Asia Market Value Share and BPS Analysis by Application, 2025 and 2035
  • Figure 52: East Asia Market Y-o-Y Growth Comparison by Application, 2025-2035
  • Figure 53: East Asia Market Attractiveness Analysis by Application
  • Figure 54: South Asia and Pacific Market Value Share and BPS Analysis by Country, 2025 and 2035
  • Figure 55: South Asia and Pacific Market Value Share and BPS Analysis by Product Type , 2025 and 2035
  • Figure 56: South Asia and Pacific Market Y-o-Y Growth Comparison by Product Type , 2025-2035
  • Figure 57: South Asia and Pacific Market Attractiveness Analysis by Product Type
  • Figure 58: South Asia and Pacific Market Value Share and BPS Analysis by Application, 2025 and 2035
  • Figure 59: South Asia and Pacific Market Y-o-Y Growth Comparison by Application, 2025-2035
  • Figure 60: South Asia and Pacific Market Attractiveness Analysis by Application
  • Figure 61: Middle East & Africa Market Value Share and BPS Analysis by Country, 2025 and 2035
  • Figure 62: Middle East & Africa Market Value Share and BPS Analysis by Product Type , 2025 and 2035
  • Figure 63: Middle East & Africa Market Y-o-Y Growth Comparison by Product Type , 2025-2035
  • Figure 64: Middle East & Africa Market Attractiveness Analysis by Product Type
  • Figure 65: Middle East & Africa Market Value Share and BPS Analysis by Application, 2025 and 2035
  • Figure 66: Middle East & Africa Market Y-o-Y Growth Comparison by Application, 2025-2035
  • Figure 67: Middle East & Africa Market Attractiveness Analysis by Application
  • Figure 68: Global Market - Tier Structure Analysis
  • Figure 69: Global Market - Company Share Analysis
Dashboard
Dashboard
Dashboard
Dashboard
Dashboard
Dashboard

Our Research Products

Full Research Suite

The "Full Research Suite" delivers actionable market intel, deep dives on markets or technologies, so clients act faster, cut risk, and unlock growth.

Competitor Leaderboard Report

The Leaderboard benchmarks and ranks top vendors, classifying them as Established Leaders, Leading Challengers, or Disruptors & Challengers.

Future Leaders Index

Locates where complements amplify value and substitutes erode it, forecasting net impact by horizon

Market Data & Forecasts

We deliver granular, decision-grade intel: market sizing, 5-year forecasts, pricing, adoption, usage, revenue, and operational KPIs—plus competitor tracking, regulation, and value chains—across 60 countries broadly.

Market Focus Report

Spot the shifts before they hit your P&L. We track inflection points, adoption curves, pricing moves, and ecosystem plays to show where demand is heading, why it is changing, and what to do next across high-growth markets and disruptive tech

Survey Report

Real-time reads of user behavior. We track shifting priorities, perceptions of today’s and next-gen services, and provider experience, then pace how fast tech moves from trial to adoption, blending buyer, consumer, and channel inputs with social signals (#WhySwitch, #UX).

Bespoke Reports

Partner with our analyst team to build a custom report designed around your business priorities. From analysing market trends to assessing competitors or crafting bespoke datasets, we tailor insights to your needs.

Supplier Intelligence

Discovery & Profiling

Capacity & Footprint

Performance & Risk

Compliance & Governance

Commercial Readiness

Who Supplies Whom

Scorecards & Shortlists

Playbooks & Docs

Category Intelligence

Definition & Scope

Demand & Use Cases

Cost Drivers

Market Structure

Supply Chain Map

Trade & Policy

Operating Norms

Deliverables

Buyer Intelligence

Account Basics

Spend & Scope

Procurement Model

Vendor Requirements

Terms & Policies

Entry Strategy

Pain Points & Triggers

Outputs

Pricing Analysis

Benchmarks

Trends

Should-Cost

Indexation

Landed Cost

Commercial Terms

Deliverables

Brand Analysis

Positioning & Value Prop

Share & Presence

Customer Evidence

Go-to-Market

Digital & Reputation

Compliance & Trust

KPIs & Gaps

Outputs

Full Research Suite comprises of:

Market outlook & trends analysis

Market outlook & trends analysis

Interviews & case studies

Interviews & case studies

Strategic recommendations

Strategic recommendations

Vendor profiles & capabilities analysis

Vendor profiles & capabilities analysis

5-year forecasts

5-year forecasts

8 regions and 60+ country-level data splits

8 regions and 60+ country-level data splits

Market segment data splits

Market segment data splits

12 months of continuous data updates

12 months of continuous data updates

DELIVERED AS:

PDF EXCEL ONLINE

Full Research Suite


$5000

$7500

$10000

Buy Report Now
Similar Industry Reports

Similar Industry Reports

Imaging Markers Market

Imaging Markers Market Analysis - Size, Share, and Forecast Outlook 2025 to 2035

3D Imaging Surgical Solution Market

3D Imaging Surgical Solution Market Size and Share Forecast Outlook 2025 to 2035

Gel Imaging Documentation Market

Gel Imaging Documentation Market Size and Share Forecast Outlook 2025 to 2035

PET Imaging Workflow Market

PET Imaging Workflow Market Analysis - Size, Share, and Forecast Outlook 2025 to 2035

Brain Imaging And Neuroimaging Market

Brain Imaging and Neuroimaging Market Size and Share Forecast Outlook 2025 to 2035

Dental Imaging Equipment Market

Dental Imaging Equipment Market Forecast and Outlook 2025 to 2035

Remote Imaging Collaboration Market

Remote Imaging Collaboration Market Analysis - Size, Share, and Forecast Outlook 2025 to 2035

Aerial Imaging Market Share Analysis

Competitive Overview of Aerial Imaging Market Share

Aerial Imaging Market

Aerial Imaging Market Growth - Trends & Forecast 2025 to 2035

Breast Imaging Market

Breast Imaging Market Analysis - Size, Share & Growth Forecast 2024 to 2034

Spinal Imaging Market

Spinal Imaging Market Trends – Growth, Demand & Forecast 2022-2032

Hybrid Imaging System Market

Hybrid Imaging System Market

Optical Imaging Market

Optical Imaging Market Size and Share Forecast Outlook 2025 to 2035

Quantum Imaging Devices Market

Quantum Imaging Devices Market Analysis - Size, Share, and Forecast Outlook 2025 to 2035

Medical Imaging Software Market

Medical Imaging Software Market Size and Share Forecast Outlook 2025 to 2035

Nuclear Imaging Devices Market

Nuclear Imaging Devices Market Size and Share Forecast Outlook 2025 to 2035

Urology Imaging Systems Market

Urology Imaging Systems Market Size and Share Forecast Outlook 2025 to 2035

In Vivo Imaging Systems Market

In Vivo Imaging Systems Market Size and Share Forecast Outlook 2025 to 2035

Nuclear Imaging Equipment Market

Global Nuclear Imaging Equipment Market Insights – Trends & Forecast 2024-2034

Medical Imaging Agent-Producing System Market

Medical Imaging Agent-Producing System Market

Future Market Insights

Whole-Body Imaging Market

Chat With MaRIA

Chat With

MaRIA

Hi There, I am MaRIA, Your Market Research Intelligence Assistant. How may I help you?