

- Market Size (2026)
- USD 980.6 Mn
- Forecast (2036)
- USD 2991.6 Mn
- CAGR (2026 to 2036)
- 11.8%
How big is the Worker Location Beacon Market in 2026?
USD 980.6 million in 2026 and USD 2,991.6 million by 2036 at an 11.8% CAGR.
Sales of worker location beacons are estimated to rise at 11.8% CAGR through 2036, increasing valuation from USD 980.6 million in 2026 to USD 2,991.6 million by 2036. Worker visibility spending is moving toward systems that prove location during emergencies and restricted-zone events. OSHA released 2024 injury and illness data from 370,000 Form 300A reports in April 2025. The reporting burden supports live alerts and evacuation proof during hazardous site events.
India and China are projected to advance faster as safety-code rollout and production-safety enforcement raise demand for worker location evidence. The United States, Germany and the United Kingdom are expected to grow through incident reporting, audit records and insurer-ready safety documentation. Construction contractors and plant operations teams are likely to adopt worker beacons on sites where emergency response still depends on delayed supervisor visibility. Safety managers are anticipated to test tag durability and alert routing before wider capital approval.
Construction contractors and plant operations teams are expected to adopt worker beacons on sites with slow supervisor visibility during emergency response. Safety managers evaluate tag durability and alert routing before including systems in capital requests. IT teams review receiver placement and software integration due to the need for clear handoff between floor events and safety records. Warehousing teams compare the category against indoor positioning networks to reduce blind spots created by congestion and forklift movement. The practical value is faster location certainty for workers moving beyond fixed checkpoints during live operations.
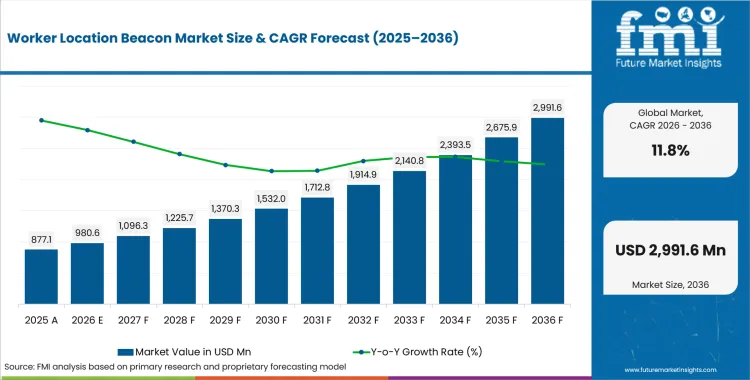
| Metric | Value |
|---|---|
| 2025 Market Size | USD 877.1 million |
| 2026 Market Size | USD 980.6 million |
| 2036 Market Size | USD 2,991.6 million |
| Forecast CAGR (2026-2036) | 11.8% |
| Sales Model Focus | Hardware Sale |
| Hardware Sale Share (2026) | 46.0% |
| Technology Focus | Bluetooth LE Beacons |
| Bluetooth LE Beacons Share (2026) | 38.0% |
| Application Focus | Worker Safety |
| Worker Safety Share (2026) | 38.0% |
| Fastest-growing Country | India |
| India CAGR by 2036 | 14.05% |
Summary of the Worker Location Beacon Market
| Market Signal | Commercial Impact |
|---|---|
| Demand and Growth Drivers | Worker visibility spending is expected to move toward systems that prove location during emergencies. Documentation needs are projected to make beacon accuracy and service ownership part of site approval.
|
| Product and Segment View | Hardware sale and Bluetooth LE beacons are estimated to lead their parent categories in 2026. Worker safety is forecast to remain the core application screen for technical reviews.
|
| Geography and Growth Outlook | India and China are projected to form the higher-growth tier due to industrial site expansion. Established markets are expected to grow under specification-heavy adoption cycles.
|
| Competitive Landscape | Competition is moderately concentrated around RTLS software ownership and device ecosystem depth. Sourcing screens are expected to center on accuracy proof and local support reach.
|
| Analyst Perspective | Worker beacon programs should be judged by how quickly they turn a moving worker into an actionable safety record. Companies that make badge data usable during drills, evacuations and post-incident review are expected to sustain competitive edge.
|
Source: FMI's proprietary forecasting model and primary research
How is the Worker Location Beacon Market segmented?
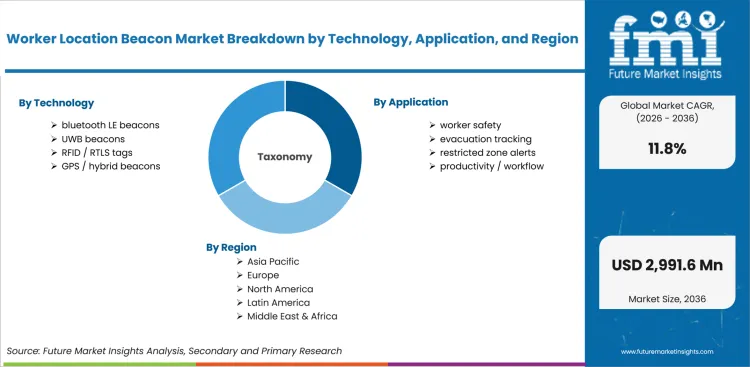
The worker location beacon market is segmented by technology, application, end use, form factor, sales model and region.
The worker location beacon market is segmented by technology, application, end use, form factor, sales model and region. By technology, the market covers bluetooth LE beacons, UWB beacons, RFID / RTLS tags, and GPS / hybrid beacons. By application, it covers worker safety, evacuation tracking, restricted zone alerts, and productivity / workflow. By end use, it covers construction, mining, oil and gas, and manufacturing / warehousing. By form factor, it covers wearable tags, helmet-mounted devices, badge / clip-on devices, and vehicle / asset beacons. By sales model, it covers hardware sale, SaaS / subscription, and managed service. Regional coverage includes North America, Latin America, Europe, East Asia, South Asia and Pacific, and Middle East and Africa aligned to micro-location technology adoption.
How does hardware sale shape purchasing within the sales model category?
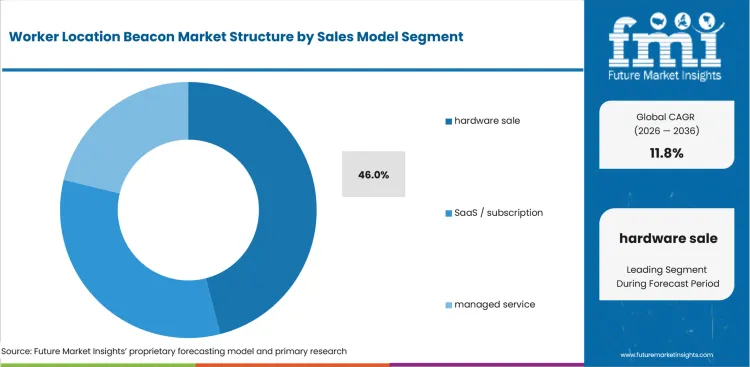
Hardware ownership is central in projects that assign worker location duties to safety assets before software subscriptions are approved. OSHA's May 2026 severe injury report recorded 9,034 severe injury reports for 2024 under federal coverage and kept response documentation inside capital planning. Site operators prefer clear device responsibility before they add managed monitoring to multi-site safety programs.
- By sales model, hardware sale is projected to account for 46.0% share in 2026 driven by tag replacement cycles and gateway ownership. OSHA's May 2026 report counted 7,327 inpatient hospitalization cases in 2024 and increased interest in devices that support faster location checks during emergency response review. Clear device custody helps project owners connect replacement budgets to drills and incident investigations.
- Hardware sale is witnessing demand from construction contractors owing to direct asset control and simpler replacement accountability. Operations teams comparing device-led site safety programs favor purchased tags in accounts requiring a clear finance ledger. Integrators also prefer stable gateway placement across projects, which reduces support issues during multi-site rollout.
What supports demand for bluetooth LE beacons within the technology category?
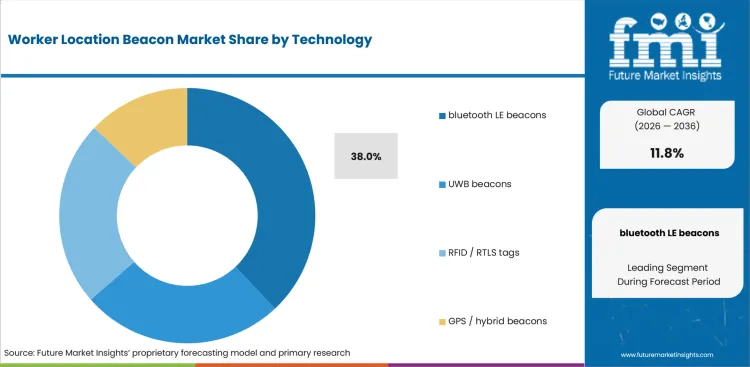
Bluetooth LE beacon choices are shaped by lower device cost and facility compatibility in retrofit sites. OSHA's May 2025 injury summary stated that 392,735 establishments submitted Form 300A summary data for 2024. The scale highlights safety reporting environments that need simpler data capture and lower installation burden. Facility IT teams review BLE density and battery life before worker location networks receive approval. Installation planning therefore becomes part of the technology decision before safety teams approve wider rollout.
- Bluetooth LE beacons are estimated to hold 38.0% share in 2026 supported by lower tag costs and existing wireless ecosystem familiarity. OSHA's May 2025 report stated that roughly 64,000 establishments submitted incident reports for 2024 and gave safety teams a reason to connect location events to incident records. BLE deployments also reduce gateway burden for room-level mustering needs in existing facilities and warehouses.
- Demand for bluetooth LE beacons is expected to grow among warehouse operations teams attributable to gateway-light deployments and familiar device management. Safety teams compare BLE networks with industrial workplace safety systems for accounts that need room-level location for mustering and workflow checks. The segment fits accounts that need fast trials before larger RTLS budgets are approved.
How do EHS teams evaluate worker safety within the application category?
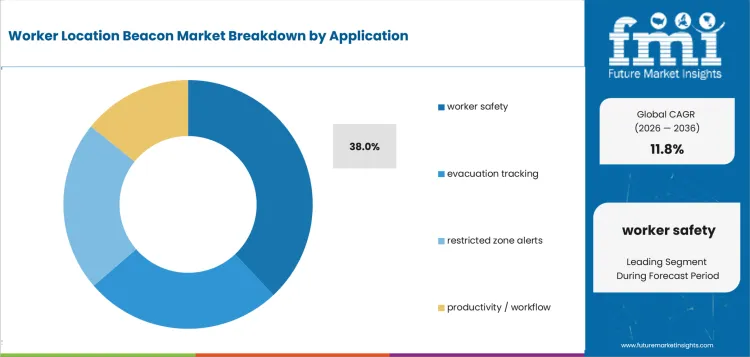
Worker safety applications receive closer review in facilities that route alerts from a wearable device to a named responder. The USA Bureau of Labor Statistics reported in February 2026 that 5,070 fatal work injuries occurred in 2024. The count keeps incident prevention and response evidence central to system qualification and budget review. EHS leaders need alerts showing missing workers and zones requiring action during evacuations under site pressure.
- Worker safety is forecast to capture 38.0% of application demand in 2026 attributable to duress alerts and emergency mustering workflows. BLS reported in February 2026 that workplace falls and related trips caused 844 fatal work injuries in 2024. The evidence increases scrutiny of systems that help locate injured or immobile workers on complex sites. Alert routing therefore becomes part of sourcing review before safety teams approve site-wide use.
- Safety teams are increasingly purchasing worker safety beacon systems led by the need for live accountability during evacuation drills. Programs connected to machine safety systems need clear event records before plant managers approve integration with alarms and access controls. Adoption is shaped by whether responders receive location records fast enough to act during drills.
What drives construction demand within the end use category?
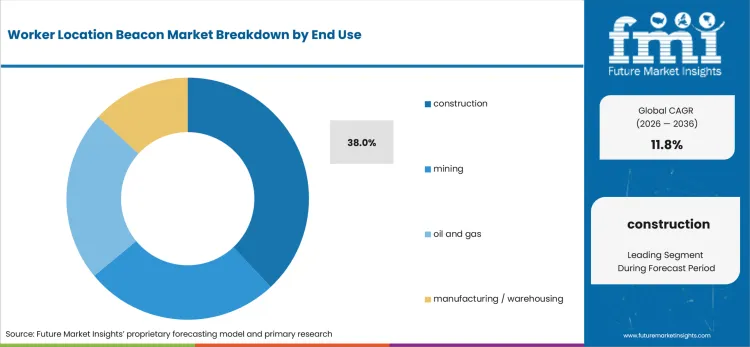
Construction sites create moving work zones that strain fixed cameras and manual headcounts across rotating crew areas. OSHA's May 2026 severe injury report showed 1,468 construction inpatient hospitalizations in 2024 and kept contractor visibility inside emergency response reviews. General contractors also need systems that travel between phases without rebuilding the safety workflow. Beacon programs therefore fit projects with changing crews and temporary boundaries across sequential construction phases.
- By end use, construction is anticipated to represent 38.0% share in 2026 owing to mobile crews and multi-contractor site coordination. OSHA's May 2026 report recorded 231 construction amputations in 2024, which raises the value of tagged access and rapid response proof for high-risk project areas. Contractors also need audit records that follow crews across phases and temporary site boundaries.
- Construction contractors are expected to favor worker beacons over manual headcounts due to rotating crews and temporary site boundaries. Location records linked to wearable computing devices support daily accountability without forcing supervisors to rebuild paper registers for every project phase. The use case is concentrated in dense worksites that operate with many subcontractors under rotating supervision.
How is wearable tag demand positioned within the form factor category?
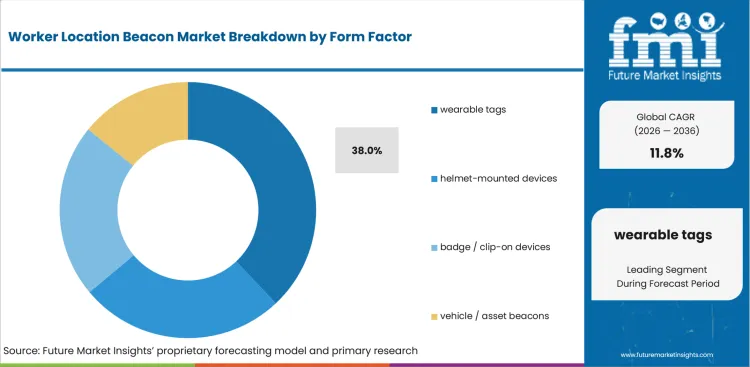
Wearable tags fit daily worker routines better than fixed badges left in lockers or vehicles. KOSHA News reported in June 2025 that 60,000 high-heat-risk workplaces were selected for focused monitoring in South Korea. The program shows the operating value of body-level visibility during mobile work and heat exposure checks. Device comfort and battery life therefore influence approval beside accuracy claims during daily shift reviews.
- Wearable tags are likely to capture 38.0% share in 2026 due to identity-linked alerts and emergency carry behavior. KOSHA News reported in June 2025 that 63 heat-related industrial accident injuries occurred in South Korea during 2024 and supported form factors that help safety teams account for workers outside fixed checkpoints. Daily carry behavior remains central to this segment during emergency drills and heat exposure checks.
- Purchase activity for wearable tags is anticipated to rise driven by daily-use convenience and worker identity association. Operations teams evaluating piece-level tracking systems often separate asset tags from worker tags so privacy rules and emergency escalation are handled differently. Wearable approval depends on comfort, charging routines and clear worker communication before live-site expansion.
What are the drivers, restraints, and opportunities in the Worker Location Beacon Market?
Near-term purchases are being shaped by emergency-response accountability, integration burden, and site-level service access outlined below.
- Driver: EHS teams are expected to fund beacon programs that shorten worker location checks during alarms and evacuation drills.
- Restraint: Adoption is anticipated to slow in accounts that lack indoor accuracy proof and clear worker privacy rules.
- Opportunity: Managed service routes are projected to open account access for contractors lacking in-house RTLS installation teams.
Industrial and construction sites are expected to raise interest in beacons that turn a worker location signal into a response record. OSHA reported in May 2025 that 688,575 work-related injury and illness incident reports were submitted for 2024. The submission volume keeps documentation workload visible in EHS planning and post-incident review cycles. Safety teams therefore need location systems that reduce manual reconciliation during incident reviews and drill validation. The driver is clearest in employers already tracking injuries and near misses inside digital reporting workflows.
Integration risk remains a restraint in beacon programs that must connect to Wi-Fi, gateways and incident management tools. OSHA's May 2026 severe injury report counted 2,426 amputations reported in 2024 and increased scrutiny around response proof without removing system design burden. IT teams still need site surveys and data rules before floor-wide rollout reaches production areas. Privacy review also slows adoption if worker movement data lacks clear governance and employee communication.
Service-led deployment is projected to convert that restraint into a commercial opening for RTLS integrators and managed service providers. Sewio described RTLS Studio in September 2025 as a software package covering deployment and platform management tools, which shows how setup burden is moving into packaged workflows. Contractors that compare navigation and positioning tools are expected to favor suppliers that document accuracy and support handover.
Which country CAGRs are profiled in the Worker Location Beacon Market?
| Country | CAGR |
|---|---|
| United States | 10.85% |
| China | 13.05% |
| India | 14.05% |
| Germany | 10.45% |
| United Kingdom | 10.65% |
| Japan | 10.25% |
| South Korea | 11.65% |
Source: FMI's proprietary forecasting model and primary research
How do country-level CAGRs compare in the Worker Location Beacon Market?
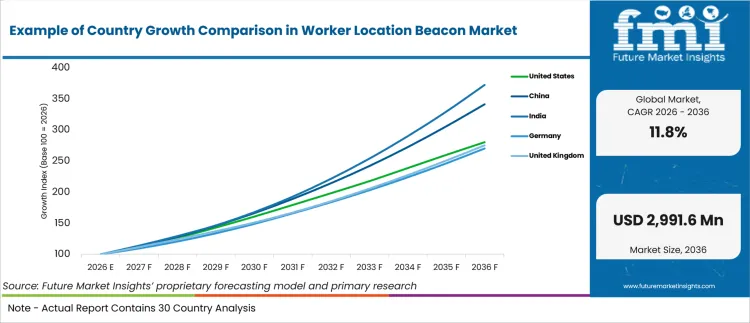
Country growth is expected to differ by safety enforcement, site digitization and integrator availability. India is estimated at 14.05% and China is forecast at 13.05% due to faster site formalization. Rest of World is projected at 12.05% and South Korea is anticipated at 11.65%. The United States is forecast at 10.85% and the United Kingdom is expected at 10.65%. Germany is projected at 10.45% and Japan is estimated at 10.25% under specification-led adoption cycles. Higher-growth markets rely more on new site buildout and contractor safety formalization across industrial corridors. Established markets place greater weight on documented accuracy and support continuity before account expansion.
- United States demand is forecast to rise at 10.85% CAGR over the forecast period, driven by OSHA reporting and contractor liability reviews. The USA Bureau of Labor Statistics reported in February 2026 that the fatal work injury rate reached 3.3 fatalities per 100,000 full-time equivalent workers for 2024. The rate keeps emergency location proof visible for EHS teams reviewing mustering gaps and response evidence. Large industrial accounts require links to access control and injury reporting systems before site expansion. Zebra Technologies and HID Global are positioned to gain traction in accounts requiring enterprise identity links and national service coverage.
- China worker beacon adoption is projected to record 13.05% CAGR during the assessment period, supported by industrial safety enforcement and factory digitization. The National Bureau of Statistics of China reported in February 2026 that work accident deaths reached 18,261 people in 2025. The death toll keeps industrial operators focused on faster worker location and zone accountability. Local integrators must also support high-volume projects across manufacturing parks and construction corridors under strict delivery timelines. Suppliers offering scalable tag supply and gateway planning are expected to receive closer consideration in rapid multi-site rollout accounts.
- India is estimated to post 14.05% CAGR through 2036, owing to formalized safety compliance and large contractor networks. Press Information Bureau reported in November 2025 that the OSH Code replaced 13 central labour laws. The consolidation raises the need for clearer site records and single-owner compliance workflows across states. EPC contractors and industrial park operators need affordable hardware that local teams install without long commissioning cycles. Sourcing teams are expected to concentrate purchases among vendors combining lower device cost and field service access before major project mobilization.
- The worker location beacon market activity is anticipated to advance at 10.45% CAGR over the assessment period, shaped by accident documentation and engineering qualification. DGUV reported in July 2025 that 754,660 reportable accidents occurred at work in 2024 across industrial and public sectors. The official accident base keeps prevention evidence central to factory and logistics site reviews. German accounts require accuracy proof, worker council review and integration testing before adding location workflows. Suppliers offering documented accuracy testing are expected to receive closer consideration in accounts requiring repeatable validation and local technical support.
- United Kingdom demand is projected to grow at 10.65% CAGR by 2036, led by contractor safety reviews and service-led sourcing. Health and Safety Executive reported in July 2025 that 124 workers were killed in work-related accidents during 2024/25. The figure keeps emergency response and worker accountability inside contractor and facility management discussions. UK site owners also place weight on imported hardware support and vendor response time due to lean internal engineering teams. Managed deployment channels are expected to draw attention from facilities teams in healthcare, logistics and construction settings.
- Japan worker beacon sales are forecast to expand at 10.25% CAGR by 2036, attributable to ageing workforce risk and strict industrial safety routines. Japan Ministry of Health, Labour and Welfare program materials set a 15% construction accident reduction target in 2025 for 2027 against 2022. The target reinforces demand for tools that support fall response and contractor supervision inside construction programs. Japanese accounts move carefully until device reliability and operating procedures are proven in field reviews. Suppliers offering stable hardware specifications are expected to receive closer consideration in accounts requiring long approval cycles.
- South Korea adoption is predicted to advance at 11.65% CAGR through 2036, reinforced by risk-assessment programs and heat safety enforcement. KOSHA News reported in June 2025 that supported workplaces recorded a 66.7% reduction in fatal accidents after consultations. The evidence supports wider use of technologies that turn hazards into trackable actions and response records. Local manufacturers and logistics firms also need systems that work inside compact sites and dense subcontractor chains. Format-flexible channels are expected to draw attention from safety teams in construction, shipbuilding and logistics corridors.
Who are the notable companies in the Worker Location Beacon Market?
Zebra Technologies, HID Global, Quuppa, AiRISTA, Kontakt.io, Estimote, Sewio, Litum, Ubisense and KINEXON are the notable companies shaping this market.
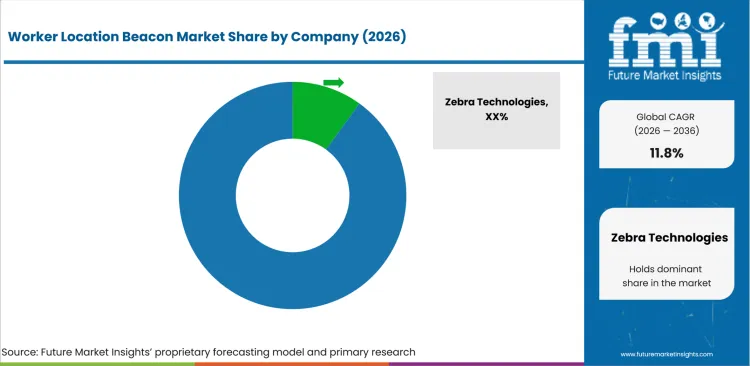
Competition is moderately concentrated around platform ownership, beacon hardware depth and integrator coverage in safety-led accounts. Established multinational suppliers hold account access in enterprise safety and industrial identity workflows across larger accounts. Competition centers on accuracy evidence, device durability and workflow integration across worker safety programs. Sourcing teams also compare RTLS offerings against adjacent location analytics platforms in accounts that already fund asset tracking programs.
- Enterprise identity and tracking programs favor suppliers that link worker beacons to access control and asset visibility. Zebra Technologies and HID Global compete on account coverage, channel reach and product documentation. Large EHS teams use those vendors in accounts that need one ownership path for identity, location and support escalation.
- Location-engine depth separates Quuppa and AiRISTA from general beacon vendors in accuracy-sensitive industrial and healthcare environments. Quuppa competes on Bluetooth angle-of-arrival location systems and partner deployment models for room-level accuracy needs. AiRISTA competes on staff safety workflows and rule-based alerts for healthcare, education and industrial facilities needing configurable escalation.
- Beacon-led installations create room for Kontakt.io and Estimote in facilities that prefer BLE devices and software-led configuration. These companies serve teams that need faster pilot projects before broader RTLS infrastructure approval across multiple buildings. Sourcing leaders test battery life, dashboard usability and support response before expanding from one building to multiple sites.
- Industrial specialists are expected to retain attention in sites that need UWB precision or hazardous-area support. Sewio and Litum compete on plant-floor location for heavy industrial accounts in hazardous production areas. Ubisense and KINEXON add forklift proximity and workflow analytics beside worker safety records during shift-level safety reviews.
Competitive Benchmarking: Worker Location Beacon Market
| Company | Beacon relevance | Workflow fit | Service capability | Reach |
|---|---|---|---|---|
| Zebra Technologies | High | Strong | High | Global |
| HID Global | High | Strong | High | Global |
| Quuppa | Strong | Strong | Medium | Global |
| AiRISTA | Medium | Strong | Medium | Regional |
| Kontakt.io | Strong | Medium | Medium | Global |
| Estimote | Medium | Medium | Medium | Global |
| Sewio | High | Strong | Strong | Global |
| Litum | Strong | Strong | Medium | Global |
| Ubisense | Medium | Strong | Medium | Regional |
| KINEXON | Strong | Strong | Medium | Global |
Source: Future Market Insights competitive analysis, 2026. Ratings reflect relative portfolio relevance and workflow fit across worker location beacon programs in 2026. Service capability and geographic reach shape the remaining comparison during sourcing review for industrial safety accounts.
Key Developments in the Worker Location Beacon Market
- In August 2025, Zebra Technologies supported the Indianapolis Colts with its MotionWorks Sport system, which uses RFID tags and receivers to generate real-time player and ball location data during practice sessions.
- In August 2025, HID acquired Intelligent Observation to strengthen its healthcare RTLS portfolio and expand staff workflow monitoring capabilities. The acquisition added solutions for hand hygiene compliance and workflow visibility within hospital settings.
- In July 2025, Kontakt.io expanded its Staff Safe solution to include outdoor coverage for hospital campuses. The enhancement extended staff protection capabilities beyond indoor environments, providing coverage across a one-mile radius around healthcare facilities.
- In June 2026, Litum highlighted hazardous-area RTLS applications for ATEX Zone 1 and Zone 2 environments. The company showcased its ATEX Gateway and ATEX Dualis Tag solutions for use in classified areas where conventional electronic devices may not be permitted.
Key Players in the Worker Location Beacon Market
Enterprise RTLS and identity platform suppliers
- Zebra Technologies
- HID Global
- Quuppa
- AiRISTA
Bluetooth beacon and staff safety specialists
- Kontakt.io
- Estimote
Industrial tracking and UWB specialists
- Sewio
- Litum
- Ubisense
- KINEXON
Worker Location Beacon Market - Report Scope
| Coverage field | Report scope |
|---|---|
| Market breakdown | Worker Location Beacon Market Breakdown By Technology, Application, End Use, Form Factor, Sales Model, and Region |
| Market Definition | Worker location beacons are wearable or assigned wireless devices that transmit worker location for safety, evacuation and workflow visibility across controlled worksites. |
| Regions Covered | North America, Latin America, Europe, East Asia, South Asia and Pacific, Middle East and Africa |
| Countries Covered | United States, China, India, Germany, United Kingdom, Japan, South Korea and 30+ countries |
| Key Companies Profiled | Zebra Technologies, HID Global, Quuppa, AiRISTA, Kontakt.io, Estimote, Sewio, Litum, Ubisense, KINEXON |
| Forecast Period | 2026 to 2036 |
| Approach | Hybrid bottom-up and top-down methodology using tag adoption rates, site safety workflows, country-level injury reporting, integrator coverage and supplier portfolio depth |
Source: Future Market Insights - analysis driven by proprietary forecasting models and primary research
Worker Location Beacon Market - Research Methodology
| Method | Approach |
|---|---|
| Primary Research | FMI analysts gathered input from manufacturers, service providers, technology developers, distributors, end users, sourcing teams, and subject-matter experts. Interviews examined purchasing decisions, product or service evaluation, adoption barriers, approval requirements, pricing considerations, and expectations for technical or commercial support. Respondents were also asked what evidence is required before a trial, pilot, or initial order develops into regular purchasing. |
| Desk Research | Desk research covered government statistics, regulatory publications, trade data, industry associations, technical literature, standards, company filings, product information, and official corporate announcements. Sources were reviewed for relevance, publication date, geographic coverage, and consistency with the defined market scope. Claims relating to performance, applications, approvals, capacity, investment, and commercial activity were retained only when supported by credible public evidence. |
| Market Sizing and Forecasting | The market model combined the baseline value with historical performance, segment structure, pricing and volume indicators, adoption levels, company participation, and country-level demand conditions. Forecast assumptions considered economic activity, investment trends, regulatory developments, technology adoption, purchasing cycles, supply availability, and barriers to wider market use. Segment and regional estimates were reconciled before the final market total was calculated. |
| Data Validation | Estimates were checked against multiple independent indicators, including public data, company activity, trade patterns, industry developments, and findings from primary interviews. Validation also tested whether products, services, applications, and company revenues fell within the defined market boundaries. Adjacent categories, unsupported claims, overlapping revenues, and activities without direct market relevance were excluded to reduce double counting and maintain consistency across segments and countries. |
Source: Future Market Insights (FMI) analysis, based on proprietary forecasting model and primary research
Worker Location Beacon Market by Segments
Worker Location Beacon Market segmented by Technology:
- Bluetooth LE beacons
- UWB beacons
- RFID / RTLS tags
- GPS / hybrid beacons
Worker Location Beacon Market segmented by Application:
- Worker safety
- Evacuation tracking
- Restricted zone alerts
- Productivity / workflow
Worker Location Beacon Market segmented by End Use:
- Construction
- Mining
- Oil and gas
- Manufacturing / warehousing
Worker Location Beacon Market segmented by Form Factor:
- Wearable tags
- Helmet-mounted devices
- Badge / clip-on devices
- Vehicle / asset beacons
Worker Location Beacon Market segmented by Sales Model:
- Hardware sale
- SaaS / subscription
- Managed service
Worker Location Beacon Market by Region:
- North America
- United States
- Canada
- Latin America
- Brazil
- Mexico
- Argentina
- Europe
- Germany
- United Kingdom
- France
- Italy
- Spain
- East Asia
- China
- Japan
- South Korea
- South Asia and Pacific
- India
- Australia
- ASEAN
- Middle East and Africa
- GCC countries
- South Africa
- Türkiye
Research Sources and Bibliography
- Bureau of Labor Statistics. (2026, February). National Census of Fatal Occupational Injuries in 2024. USA Department of Labor.
- Occupational Safety and Health Administration. (2025, May). 2024 Annual Report of Injuries and Illnesses. USA Department of Labor.
- Occupational Safety and Health Administration. (2026, May). 2024 Annual Report of Work-Related Severe Injuries and Illnesses Reported from Employers Covered by Federal OSHA. USA Department of Labor.
- National Bureau of Statistics of China. (2026, February). Statistical Communiqué of the People’s Republic of China on the 2025 National Economic and Social Development. National Bureau of Statistics of China.
- Press Information Bureau. (2025, November). Occupational Safety, Health and Working Conditions (OSH) Code, 2020. Government of India.
- German Social Accident Insurance. (2025, July). Accident occurrence. DGUV.
- Health and Safety Executive. (2025, July). Work-related fatal injuries in Great Britain. HSE.
- Ministry of Health, Labour and Welfare. (2025, April). Working Conditions/Labour Relations. MHLW.
- Korea Occupational Safety and Health Agency. (2025, June). KOSHA News Vol. 135 June 2025. KOSHA.
- International Labour Organization. (2025, April). The right to occupational safety and health: Still unrealized. ILOSTAT.
- Zebra Technologies. (2025, August). Indianapolis Colts Team Up with Zebra Technologies for Real-Time Player Performance Insights. Zebra Technologies.
- HID Global. (2025, August). HID Acquires Intelligent Observation to Strengthen Its Healthcare RTLS Portfolio. HID Global.
- Kontakt.io. (2025, July). Kontakt.io Extends Hospital Staff Safe Protection to Outdoor Areas. Kontakt.io.
- Quuppa. (2024, April). Astor Mission Critical and Quuppa Announce Strategic Partnership to Introduce RTLS to the Polish Market. Quuppa.
- Quuppa. (2025, June). Quuppa and InPlay Announce Collaboration for Angle-of-Arrival Positioning. Quuppa.
- Sewio. (2025, September). RTLS Studio - all in one software package. Sewio.
- Litum. (2026, June). Hazardous Area RTLS: ATEX Zone 1 & Zone 2 Use Cases. Litum.
This bibliography is provided for reader reference and uses primary government, standards-body, official trade body, and company sources.
This Report Answers
- What are the estimated worker location beacon market values in 2026 and 2036?
- What CAGR is forecast for the worker location beacon market from 2026 to 2036?
- Which technology, application, end use, form factor and sales model segments shape demand?
- Which safety and workflow pressures support worker location beacon purchase activity?
- How do country CAGRs differ across the United States, China, India and other profiled markets?
- Which companies compete across beacon relevance, workflow fit and service capability?
- How does FMI validate forecasts using hybrid bottom-up and top-down methodology?
- What should EHS managers and procurement leaders address before wider site rollout?
- How do safety documentation, privacy review and accuracy proof affect vendor selection?
Frequently Asked Questions
What is driving growth in the Worker Location Beacon Market?
Growth is being driven by emergency mustering, duress alerts and contractor accountability pressure. EHS teams are adding beacons where manual headcounts cannot support reliable incident records during site pressure.
Who are the key players in the Worker Location Beacon Market?
Key players include Zebra Technologies and HID Global; Quuppa and AiRISTA; Kontakt.io and Estimote; Sewio and Litum; Ubisense and KINEXON. Competition centers on RTLS ownership, accuracy proof and local support reach.
What is a significant restraint in the Worker Location Beacon Market?
A significant restraint is uncertain accuracy under live site pressure and weak integration ownership. Buyers delay rollout when vendors cannot document limits, service response and alert handoff.
Why should executives track the Worker Location Beacon Market?
Executives should track this category due to its direct link to emergency response evidence and contractor accountability. Beacon systems also influence how sites document evacuation performance and worker movement during incidents.
What business problem does the Worker Location Beacon Market address?
The market addresses weak visibility into worker location across construction, industrial and hazardous environments. Beacons help EHS teams replace manual headcounts with live location and alert records during drills and emergency investigations.
What should procurement leaders evaluate before selecting suppliers?
Procurement leaders should evaluate tag durability and indoor accuracy before selecting suppliers for industrial worker safety programs. Gateway coverage and integration ownership should be checked before site-wide rollout across multi-site industrial accounts.
What limits return on investment for operations teams?
Return on investment is likely to narrow if site surveys are weak or alert workflows remain unclear. Adoption also slows in teams that receive location data without response rules during emergency planning reviews.
How should suppliers build long-term account confidence?
Suppliers should provide accuracy testing, battery-life evidence and clear support handover before account expansion. Account confidence improves if pilots connect beacon alerts to actual emergency drills and incident review records.
Preview the report firsthand - request a free sample
Get SampleGet the brochure for pricing and purchase details.
Get PDFTable of Content
- Key Takeaways
- Market Size and CAGR
- Top Growth Driver
- Fastest Growing Segment
- Leading Region
- Key Companies
- Emerging Opportunities
- Executive Summary
- Global Market Outlook
- Demand-side Trends
- Supply-side Trends
- Technology Roadmap Analysis
- Analysis and Recommendations
- Analyst Perspective (What is happening? Why now? What should investors know?)
- Key Questions Answered
- How large is the market?
- What is the CAGR?
- What are key trends?
- Which region dominates?
- Who are the leaders?
- Market Overview
- Market Coverage / Taxonomy
- Market Definition / Scope / Limitations
- Research Methodology
- Chapter Orientation
- Analytical Lens and Working Hypotheses
- Market Structure, Signals, and Trend Drivers
- Benchmarking and Cross-market Comparability
- Market Sizing, Forecasting, and Opportunity Mapping
- Research Design and Evidence Framework
- Desk Research Programme (Secondary Evidence)
- Expert Input and Fieldwork (Primary Evidence)
- Tooling, Models, and Reference Databases
- Data Engineering and Model Build
- Quality Assurance and Audit Trail
- Market Background
- Market Dynamics (Drivers, Restraints, Opportunity, Trends)
- Scenario Forecast (Optimistic, Likely, Conservative)
- Impact Analysis
- AI Impact
- Sustainability Impact
- Regulatory Impact
- Technology Impact
- Consumer / Buyer Analysis
- Purchase Drivers
- Adoption Barriers
- Buyer Journey
- Opportunity Map Analysis
- Product Life Cycle Analysis
- Supply Chain Analysis
- Investment Feasibility Matrix
- Value Chain Analysis
- PESTLE and Porter's Analysis
- Regulatory Landscape
- Regional Parent Market Outlook
- Production and Consumption Statistics
- Import and Export Statistics
- Global Market Analysis and Forecast, 2021 to 2036
- Historical Market Size Value (USD Mn) Analysis, 2021 to 2025
- Current and Future Market Size Value (USD Mn) Projections, 2026 to 2036
- Y-o-Y Growth Trend Analysis
- Absolute $ Opportunity Analysis
- Global Market Pricing Analysis, 2021 to 2036
- Global Market Analysis and Forecast, By Technology, 2021 to 2036
- Introduction / Key Findings
- Historical Market Size Value (USD Mn) Analysis By Technology, 2021 to 2025
- Current and Future Market Size Value (USD Mn) Analysis and Forecast By Technology, 2026 to 2036
- bluetooth LE beacons
- UWB beacons
- RFID / RTLS tags
- GPS / hybrid beacons
- bluetooth LE beacons
- Y-o-Y Growth Trend Analysis By Technology, 2021 to 2025
- Absolute $ Opportunity Analysis By Technology, 2026 to 2036
- Global Market Analysis and Forecast, By Application, 2021 to 2036
- Introduction / Key Findings
- Historical Market Size Value (USD Mn) Analysis By Application, 2021 to 2025
- Current and Future Market Size Value (USD Mn) Analysis and Forecast By Application, 2026 to 2036
- worker safety
- evacuation tracking
- restricted zone alerts
- productivity / workflow
- worker safety
- Y-o-Y Growth Trend Analysis By Application, 2021 to 2025
- Absolute $ Opportunity Analysis By Application, 2026 to 2036
- Global Market Analysis and Forecast, By End Use, 2021 to 2036
- Introduction / Key Findings
- Historical Market Size Value (USD Mn) Analysis By End Use, 2021 to 2025
- Current and Future Market Size Value (USD Mn) Analysis and Forecast By End Use, 2026 to 2036
- construction
- mining
- oil and gas
- manufacturing / warehousing
- construction
- Y-o-Y Growth Trend Analysis By End Use, 2021 to 2025
- Absolute $ Opportunity Analysis By End Use, 2026 to 2036
- Global Market Analysis and Forecast, By Form Factor, 2021 to 2036
- Introduction / Key Findings
- Historical Market Size Value (USD Mn) Analysis By Form Factor, 2021 to 2025
- Current and Future Market Size Value (USD Mn) Analysis and Forecast By Form Factor, 2026 to 2036
- wearable tags
- helmet-mounted devices
- badge / clip-on devices
- vehicle / asset beacons
- wearable tags
- Y-o-Y Growth Trend Analysis By Form Factor, 2021 to 2025
- Absolute $ Opportunity Analysis By Form Factor, 2026 to 2036
- Global Market Analysis and Forecast, By Sales Model, 2021 to 2036
- Introduction / Key Findings
- Historical Market Size Value (USD Mn) Analysis By Sales Model, 2021 to 2025
- Current and Future Market Size Value (USD Mn) Analysis and Forecast By Sales Model, 2026 to 2036
- hardware sale
- SaaS / subscription
- managed service
- hardware sale
- Y-o-Y Growth Trend Analysis By Sales Model, 2021 to 2025
- Absolute $ Opportunity Analysis By Sales Model, 2026 to 2036
- Global Market Analysis and Forecast, By Region, 2021 to 2036
- Introduction
- Historical Market Size Value (USD Mn) Analysis By Region, 2021 to 2025
- Current Market Size Value (USD Mn) Analysis and Forecast By Region, 2026 to 2036
- North America
- Latin America
- Western Europe
- Eastern Europe
- East Asia
- South Asia and Pacific
- Middle East & Africa
- Market Attractiveness Analysis By Region
- North America Market Analysis and Forecast, By Country, 2021 to 2036
- Historical Market Size Value (USD Mn) Trend Analysis By Market Taxonomy, 2021 to 2025
- Market Size Value (USD Mn) Forecast By Market Taxonomy, 2026 to 2036
- By Country
- USA
- Canada
- By Technology
- By Application
- By End Use
- By Form Factor
- By Sales Model
- By Country
- Market Attractiveness Analysis
- By Country
- By Technology
- By Application
- By End Use
- By Form Factor
- By Sales Model
- Key Takeaways
- Latin America Market Analysis and Forecast, By Country
- Historical Market Size Value (USD Mn) Trend Analysis By Market Taxonomy, 2021 to 2025
- Market Size Value (USD Mn) Forecast By Market Taxonomy, 2026 to 2036
- By Country
- Brazil
- Mexico
- Chile
- Rest of Latin America
- By Technology
- By Application
- By End Use
- By Form Factor
- By Sales Model
- By Country
- Market Attractiveness Analysis
- By Country
- By Technology
- By Application
- By End Use
- By Form Factor
- By Sales Model
- Key Takeaways
- Western Europe Market Analysis and Forecast, By Country
- Historical Market Size Value (USD Mn) Trend Analysis By Market Taxonomy, 2021 to 2025
- Market Size Value (USD Mn) Forecast By Market Taxonomy, 2026 to 2036
- By Country
- Germany
- UK
- Italy
- Spain
- France
- Nordic
- BENELUX
- Rest of Western Europe
- By Technology
- By Application
- By End Use
- By Form Factor
- By Sales Model
- By Country
- Market Attractiveness Analysis
- By Country
- By Technology
- By Application
- By End Use
- By Form Factor
- By Sales Model
- Key Takeaways
- Eastern Europe Market Analysis and Forecast, By Country
- Historical Market Size Value (USD Mn) Trend Analysis By Market Taxonomy, 2021 to 2025
- Market Size Value (USD Mn) Forecast By Market Taxonomy, 2026 to 2036
- By Country
- Russia
- Poland
- Hungary
- Balkan & Baltic
- Rest of Eastern Europe
- By Technology
- By Application
- By End Use
- By Form Factor
- By Sales Model
- By Country
- Market Attractiveness Analysis
- By Country
- By Technology
- By Application
- By End Use
- By Form Factor
- By Sales Model
- Key Takeaways
- East Asia Market Analysis and Forecast, By Country
- Historical Market Size Value (USD Mn) Trend Analysis By Market Taxonomy, 2021 to 2025
- Market Size Value (USD Mn) Forecast By Market Taxonomy, 2026 to 2036
- By Country
- China
- Japan
- South Korea
- By Technology
- By Application
- By End Use
- By Form Factor
- By Sales Model
- By Country
- Market Attractiveness Analysis
- By Country
- By Technology
- By Application
- By End Use
- By Form Factor
- By Sales Model
- Key Takeaways
- South Asia and Pacific Market Analysis and Forecast, By Country
- Historical Market Size Value (USD Mn) Trend Analysis By Market Taxonomy, 2021 to 2025
- Market Size Value (USD Mn) Forecast By Market Taxonomy, 2026 to 2036
- By Country
- India
- ASEAN
- Australia & New Zealand
- Rest of South Asia and Pacific
- By Technology
- By Application
- By End Use
- By Form Factor
- By Sales Model
- By Country
- Market Attractiveness Analysis
- By Country
- By Technology
- By Application
- By End Use
- By Form Factor
- By Sales Model
- Key Takeaways
- Middle East & Africa Market Analysis and Forecast, By Country
- Historical Market Size Value (USD Mn) Trend Analysis By Market Taxonomy, 2021 to 2025
- Market Size Value (USD Mn) Forecast By Market Taxonomy, 2026 to 2036
- By Country
- Kingdom of Saudi Arabia
- Other GCC Countries
- Türkiye
- South Africa
- Other African Union
- Rest of Middle East & Africa
- By Technology
- By Application
- By End Use
- By Form Factor
- By Sales Model
- By Country
- Market Attractiveness Analysis
- By Country
- By Technology
- By Application
- By End Use
- By Form Factor
- By Sales Model
- Key Takeaways
- Key Countries Market Analysis
- USA
- Pricing Analysis
- Market Share Analysis, 2025
- By Technology
- By Application
- By End Use
- By Form Factor
- By Sales Model
- Canada
- Pricing Analysis
- Market Share Analysis, 2025
- By Technology
- By Application
- By End Use
- By Form Factor
- By Sales Model
- Mexico
- Pricing Analysis
- Market Share Analysis, 2025
- By Technology
- By Application
- By End Use
- By Form Factor
- By Sales Model
- Brazil
- Pricing Analysis
- Market Share Analysis, 2025
- By Technology
- By Application
- By End Use
- By Form Factor
- By Sales Model
- Chile
- Pricing Analysis
- Market Share Analysis, 2025
- By Technology
- By Application
- By End Use
- By Form Factor
- By Sales Model
- Germany
- Pricing Analysis
- Market Share Analysis, 2025
- By Technology
- By Application
- By End Use
- By Form Factor
- By Sales Model
- UK
- Pricing Analysis
- Market Share Analysis, 2025
- By Technology
- By Application
- By End Use
- By Form Factor
- By Sales Model
- Italy
- Pricing Analysis
- Market Share Analysis, 2025
- By Technology
- By Application
- By End Use
- By Form Factor
- By Sales Model
- Spain
- Pricing Analysis
- Market Share Analysis, 2025
- By Technology
- By Application
- By End Use
- By Form Factor
- By Sales Model
- France
- Pricing Analysis
- Market Share Analysis, 2025
- By Technology
- By Application
- By End Use
- By Form Factor
- By Sales Model
- India
- Pricing Analysis
- Market Share Analysis, 2025
- By Technology
- By Application
- By End Use
- By Form Factor
- By Sales Model
- ASEAN
- Pricing Analysis
- Market Share Analysis, 2025
- By Technology
- By Application
- By End Use
- By Form Factor
- By Sales Model
- Australia & New Zealand
- Pricing Analysis
- Market Share Analysis, 2025
- By Technology
- By Application
- By End Use
- By Form Factor
- By Sales Model
- China
- Pricing Analysis
- Market Share Analysis, 2025
- By Technology
- By Application
- By End Use
- By Form Factor
- By Sales Model
- Japan
- Pricing Analysis
- Market Share Analysis, 2025
- By Technology
- By Application
- By End Use
- By Form Factor
- By Sales Model
- South Korea
- Pricing Analysis
- Market Share Analysis, 2025
- By Technology
- By Application
- By End Use
- By Form Factor
- By Sales Model
- Russia
- Pricing Analysis
- Market Share Analysis, 2025
- By Technology
- By Application
- By End Use
- By Form Factor
- By Sales Model
- Poland
- Pricing Analysis
- Market Share Analysis, 2025
- By Technology
- By Application
- By End Use
- By Form Factor
- By Sales Model
- Hungary
- Pricing Analysis
- Market Share Analysis, 2025
- By Technology
- By Application
- By End Use
- By Form Factor
- By Sales Model
- Kingdom of Saudi Arabia
- Pricing Analysis
- Market Share Analysis, 2025
- By Technology
- By Application
- By End Use
- By Form Factor
- By Sales Model
- Türkiye
- Pricing Analysis
- Market Share Analysis, 2025
- By Technology
- By Application
- By End Use
- By Form Factor
- By Sales Model
- South Africa
- Pricing Analysis
- Market Share Analysis, 2025
- By Technology
- By Application
- By End Use
- By Form Factor
- By Sales Model
- USA
- Market Structure Analysis
- Competition Dashboard
- Competition Benchmarking
- Market Share Analysis of Top Players
- By Regional
- By Technology
- By Application
- By End Use
- By Form Factor
- By Sales Model
- Emerging Startups
- Innovation Benchmarking
- Competition Analysis
- Competition Deep Dive
- Zebra Technologies
- Overview
- Product Portfolio
- Profitability by Market Segments
- Sales Footprint
- Strategy Overview
- Marketing Strategy
- Product Strategy
- Channel Strategy
- HID Global
- Quuppa
- AiRISTA
- Kontakt.io
- Estimote
- Sewio
- Litum
- Ubisense
- KINEXON
- Zebra Technologies
- Case Studies
- Success Stories
- Recent Developments
- Competition Deep Dive
- Assumptions & Acronyms Used


