Construction Site Surveillance Robots Market Forecast and Outlook 2025-2035

The construction site surveillance robots market is projected to grow from USD 968.3 million in 2025 to approximately USD 1330.5 million by 2035, recording an absolute increase of USD 362.2 million over the forecast period. This translates into a total growth of 37.4%, with the market forecast to expand at a compound annual growth rate (CAGR) of 3.2% between 2025 and 2035. The overall market size is expected to grow by nearly 1.37X during the same period, supported by the rising adoption of autonomous surveillance technologies and increasing demand for enhanced security measures at construction sites following rising theft incidents and safety regulations.
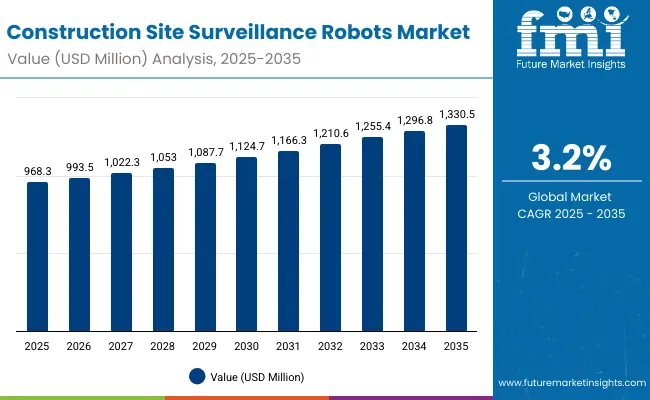
Quick Stats for Construction Site Surveillance Robots Market

  • Construction Site Surveillance Robots Market Value (2025): USD 968.3 million
  • Construction Site Surveillance Robots Market Forecast Value (2035): USD 1,330.5 million
  • Construction Site Surveillance Robots Market Forecast CAGR: 3.2%
  • Leading Mobility Type in Construction Site Surveillance Robots Market: Wheeled UGV (45.0%)
  • Key Growth Regions in Construction Site Surveillance Robots Market: North America, Asia Pacific, and Europe
  • Top Key Players in Construction Site Surveillance Robots Market: Boston Dynamics, SMP Robotics, Knightscope Inc., Cobalt Robotics, Ava Robotics, Nightingale Security, DJI Enterprise, Parrot Professional, Autel Robotics

Construction Site Surveillance Robots Market

Metric Value
Industry Size (2025E) USD 968.3 million
Industry Value (2035F) USD 1,330.5 million
CAGR (2025 to 2035) 3.2%

Between 2025 and 2030, the Construction Site Surveillance Robots market is projected to expand from USD 968.3 million to USD 1130.2 million, resulting in a value increase of USD 161.9 million, which represents 44.7% of the total forecast growth for the decade. This phase of growth will be shaped by rising construction activity in emerging markets, increasing awareness of workplace security risks, and growing insurance requirements for enhanced site monitoring. Service providers are expanding their robot deployment capabilities to address the growing complexity of modern construction security requirements and compliance standards.

From 2030 to 2035, the market is forecast to grow from USD 1,130.2 million to USD 1,330.5 million, adding another USD 200.3 million, which constitutes 55.3% of the overall ten-year expansion. This period is expected to be characterized by expansion of AI-powered surveillance capabilities, integration of advanced analytics platforms, and development of standardized security protocols across different construction environments. The growing adoption of autonomous construction equipment will drive demand for integrated surveillance systems and specialized monitoring technologies.

Between 2020 and 2025, the Construction Site Surveillance Robots market experienced steady expansion, driven by increasing construction site theft incidents and growing awareness of security requirements following high-profile equipment losses. The market developed as construction companies recognized the need for continuous monitoring systems to protect valuable equipment and materials. Insurance companies and regulatory bodies began emphasizing proper surveillance implementation to maintain coverage and compliance with safety standards.

Why is the Construction Site Surveillance Robots Market Growing?

Market expansion is being supported by the significant increase in construction site theft incidents worldwide and the corresponding need for automated surveillance systems that can operate continuously without human intervention. Modern construction sites contain expensive equipment, materials, and tools that require comprehensive monitoring to prevent unauthorized access and theft. Even temporary lapses in surveillance can result in substantial financial losses, making continuous robotic monitoring systems essential for maintaining site security and operational continuity.

The growing complexity of construction security challenges and increasing liability concerns are driving demand for professional surveillance robots from certified providers with appropriate technology and expertise. Insurance companies are increasingly requiring proper surveillance documentation following incidents to maintain coverage and ensure site security compliance. OSHA requirements and construction industry safety standards are establishing standardized security procedures that require specialized monitoring systems and trained security protocols.

Segmental Analysis

The market is segmented by mobility type, use case, end user, technology type, and region. By mobility type, the market is divided into wheeled UGV, tracked UGV, and other configurations. Based on use case, the market is categorized into security patrol, security inspection, progress monitoring, and hazard detection. In terms of end user, the market is segmented into residential construction, commercial construction, industrial construction, and infrastructure projects. By technology type, the market is classified into autonomous navigation, remote control, and hybrid systems. Regionally, the market is divided into North America, Europe, East Asia, South Asia & Pacific, Latin America, and Middle East & Africa.
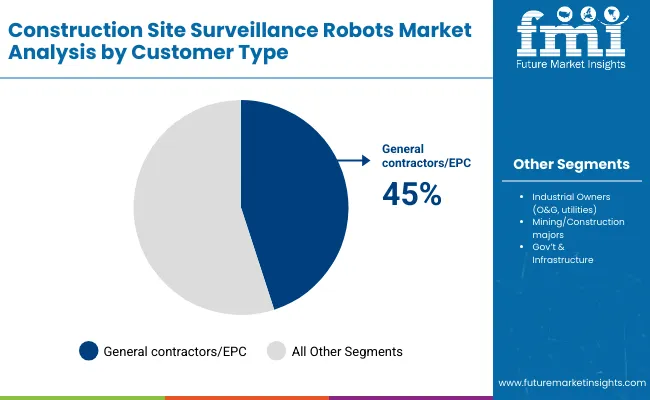
By Mobility Type, Wheeled UGV Segment Accounts for 45% Market Share

Construction Site Surveillance Robots Market By Customer

The wheeled unmanned ground vehicle (UGV) segment is projected to account for a commanding 45% share of the construction site surveillance robots market in 2025. This dominance stems from the segment’s ability to deliver a compelling combination of versatility, cost-efficiency, and adaptability to the challenging but relatively predictable terrain conditions found in most construction environments.

Wheeled robots provide an optimal balance between speed, payload capacity, and energy efficiency, making them particularly well suited for continuous patrol operations across large-scale sites. Unlike tracked or legged systems that may excel in highly uneven or hostile terrains but come with higher costs and maintenance demands, wheeled UGVs are simple to deploy, easier to maintain, and benefit from well-established mechanical design standards. Their lower power consumption also extends operational endurance, reducing the need for frequent recharging or battery swaps an important factor for surveillance applications that demand near-continuous uptime.

From a deployment perspective, wheeled UGVs are supported by a mature manufacturing ecosystem. Multiple suppliers across North America, Europe, and Asia already have the production lines, integration expertise, and distribution networks to scale wheeled platforms quickly. This availability not only lowers acquisition costs but also accelerates procurement cycles for construction companies seeking immediate surveillance upgrades. Moreover, the platforms readily integrate with advanced technologies such as LiDAR, thermal imaging, and AI-drivenanalytics, enabling seamless incorporation into existing security frameworks without extensive customization.

Construction firms increasingly favor wheeled UGVs because they offer a pragmatic solution to balancing cost and functionality. The segment’s wide adoption reflects not just its suitability for current site conditions but also its role as a proven, low-risk option for companies that prioritize reliable surveillance coverage while keeping capital expenditure and operating costs manageable. As technology advances, wheeled UGVs are likely to retain their lead, though competition from tracked and hybrid mobility platforms will intensify as projects move into more rugged or highly automated environments.
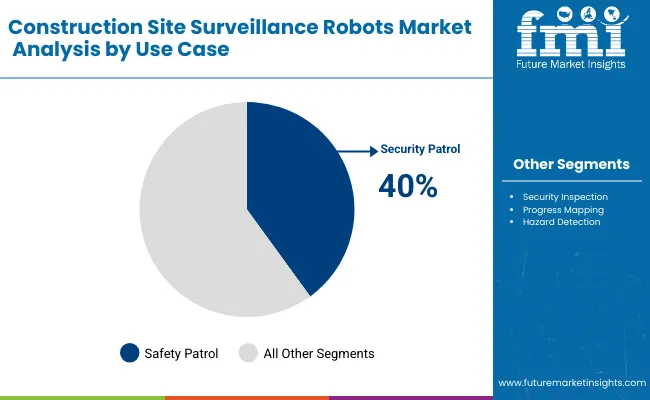
By Use Case, Security Patrol Segment Accounts for 40% Market Share

Construction Site Surveillance Robots Market By Use Case

The security patrol use case is projected to represent 40% of construction site surveillance robot demand in 2025, underscoring its position as the core driver of adoption in this market. Construction sites, particularly those located in urban and semi-urban environments, face persistent risks of theft, vandalism, and unauthorized intrusions, all of which can lead to costly project delays. Robots configured for perimeter patrol provide a visible deterrent presence, reducing the likelihood of such incidents while also ensuring 24/7 monitoring coverage that human guards alone cannot consistently deliver.

Modern patrol robots are equipped with autonomous route-following capabilities, GPS-based mapping, and real-time alerting systems that allow them to identify anomalies such as unauthorized entry, tampering with equipment, or even fire and environmental hazards. Beyond active deterrence, these robots create digital documentation trails archived video feeds, incident logs, and AI-generated alerts that strengthen compliance with insurance requirements and provide clear evidence in the event of disputes.

The growing emphasis on insurance mandates and regulatory requirements for comprehensive monitoring is accelerating adoption. In many jurisdictions, insurers now incentivize or require the deployment of technology-enabled surveillance for high-value projects. As a result, security patrol robots are no longer seen as optional tools but as baseline infrastructure for risk management, reinforcing their dominant role in market demand.

By End User, Commercial Construction Segment Accounts for 35% Market Share

The commercial construction sector is projected to contribute 35% of the construction site surveillance robots market in 2025, reflecting its demand for high-intensity, large-scale security solutions. Projects such as office complexes, shopping malls, healthcare facilities, and large mixed-use developments typically involve multi-million-dollar equipment inventories spread over vast sites, often in densely populated urban areas where the risk of unauthorized access and theft is amplified.

Unlike smaller residential projects, commercial construction sites also feature longer project timelines that make manual security staffing costly and inconsistent. Surveillance robots fill this gap by providing continuous, predictable, and scalable monitoring that can cover expansive perimeters without fatigue. Their ability to integrate with central command centers, building information models (BIM), and cloud-based monitoring platforms ensures that developers can track security status in real time and respond proactively to incidents.

Economies of scale also work in favor of robotic adoption in this segment. The upfront investment in surveillance robots though significant becomes cost-effective when spread across high-value projects with large budgets and when weighed against potential insurance savings. Developers and insurers alike increasingly view robotic surveillance as an operational necessity rather than an experimental add-on, solidifying the segment’s 35% contribution.
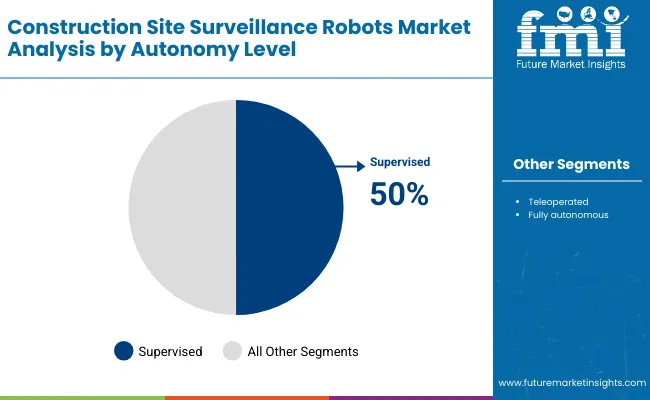
By Technology Type, Autonomous Navigation Segment Accounts for 50% Market Share

Construction Site Surveillance Robots Market By Autonomy

The autonomous navigation technology segment is estimated to command a 50% share of the market in 2025, illustrating the shift toward hands-free, intelligent surveillance operations. Unlike semi-autonomous or remotely operated systems that require human oversight, autonomous robots are designed to operate independently along dynamic or preprogrammed routes, adapting to site changes in real time. This capability is particularly valuable for construction sites, where terrain layouts and obstruction patterns change frequently as projects progress.

Advancements in LiDAR, computer vision, and AI-driven pathfinding algorithms are enabling surveillance robots to navigate with greater precision and safety. These systems can detect and avoid obstacles, adjust patrol patterns based on site activity, and even collaborate with other robots or drones to create a layered security net. For construction firms, this means a significant reduction in labor costs, as fewer remote operators or on-site supervisors are needed to manage the fleet.

Customer preference is increasingly skewed toward solutions that minimize human intervention while maximizing uptime and consistency. By providing operational efficiency, scalability, and cost-effectiveness, autonomous navigation technology is not only dominating current adoption but also shaping future expectations for what a "standard" construction site surveillance robot should deliver. Over time, as AI-driven autonomy becomes more reliable, this segment is likely to expand even further, reinforcing its role as the technological backbone of the market.

Drivers, Restraints, and Key Trends of the Construction Site Surveillance Robots Market

The construction site surveillance robots market is advancing steadily as the industry grapples with rising security risks, tightening insurance mandates, and increasing pressure to protect valuable assets on job sites. A growing number of developers and contractors are recognizing the benefits of autonomous monitoring systems, which combine round-the-clock patrol capabilities with intelligent threat detection. These technologies are becoming more attractive as labor shortages in the security industry push companies toward automation. However, the market’s growth trajectory is shaped not only by these adoption drivers but also by persistent barriers, such as the high upfront investment in robotic platforms, the need for frequent software and hardware upgrades, and the difficulty of deploying uniform solutions across highly varied construction environments.

Key Drivers

  • Rising Security Threats and Loss Prevention Needs Construction sites are increasingly vulnerable to theft of materials, machinery, and tools, as well as vandalism. Traditional guard-based security often proves inconsistent, especially on large or multi-site projects. Surveillance robots address this challenge by providing consistent, fatigue-free monitoring, deterring unauthorized entry, and capturing digital evidence to support insurance claims and liability disputes.

  • Insurance and Regulatory Pressures Insurance providers are imposing stricter risk-management requirements, and in some cases incentivizing contractors who deploy technology-driven surveillance systems. Robots, with their ability to provide continuous and auditable coverage, meet these requirements more effectively than conventional methods. This trend directly accelerates market adoption by making robotic surveillance not just a cost-saving tool but a compliance necessity.
  • Operational Efficiency and Labor Optimization Security staffing remains expensive and inconsistent, especially for projects requiring 24/7 coverage. Surveillance robots reduce dependency on human guards, cut overtime costs, and can be redeployed flexibly as project conditions change. They also deliver real-time insights through integration with central monitoring systems, improving site-wide operational efficiency.

Key Restraints

  • High Initial Equipment Costs The upfront cost of surveillance robots covering hardware, AI software licenses, and integration services remains prohibitive for small and medium-sized contractors. While larger firms can justify investments through economies of scale, smaller operators often find the ROI horizon too long.
  • Need for Continuous Technology Updates Rapid advances in AI, sensors, and navigation systems mean robots can become outdated within a few years. This creates ongoing upgrade and maintenance costs that discourage some companies from making large-scale commitments.
  • Deployment Complexity Across Diverse Environments Construction sites differ widely in terrain, size, and security requirements. A solution optimized for an urban high-rise project may not be effective for a remote infrastructure build. The lack of standardized deployment protocols and the need for site-specific customization remain hurdles to broad-based adoption.

Key Trends

Expansion of AI-Powered Analytics and Threat Detection

AI integration is redefining the role of surveillance robots from passive observers to active security agents. By leveraging machine learning algorithms, robots can identify suspicious behavior, detect anomalies in movement patterns, and distinguish between authorized workers and potential intruders. They also generate automated incident reports with time-stamped evidence, improving accountability and reducing the burden on site managers. For large projects where scaling security personnel is impractical, AI-enabled robots deliver predictive alerts and faster response times, positioning them as indispensable tools for modern construction security.

Integration of Multi-Sensor Platforms and Environmental Monitoring

Construction sites are adopting robots that do more than just guard perimeters. Multi-sensor integration including thermal cameras, acoustic sensors, gas detectors, and air quality monitors is transforming these platforms into multi-functional site management tools. Beyond surveillance, they can track worker safety conditions, monitor environmental compliance (e.g., dust, noise, emissions), and provide data for regulatory reporting. This convergence of security and environmental monitoring is attractive to developers who want to consolidate functions and maximize ROI from their robotic investments.

Standardization and Workforce Training Initiatives

Industry bodies and technology vendors are gradually moving toward standards for robot deployment, data handling, and AI-based threat analysis, which will reduce operational friction for end users. Alongside, new training programs are emerging to familiarize site managers and security teams with robotic operations, ensuring smoother adoption. These efforts are critical to moving the market from fragmented pilot deployments to scalable, mainstream adoption.
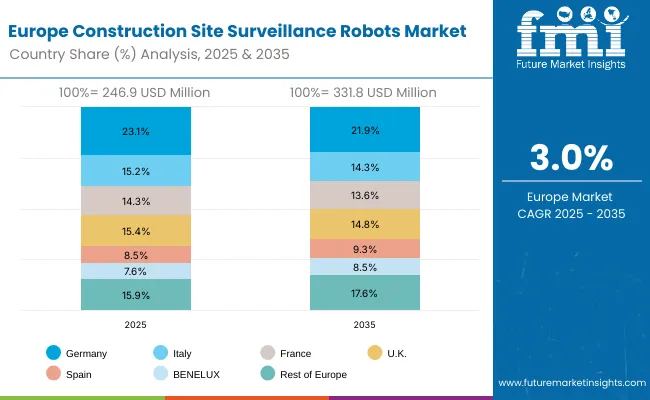
Europe Market Split by Country

Construction Site Surveillance Robots Market Europe

The Construction Site Surveillance Robots market in Europe is projected to grow from USD 241.3 million in 2025 to USD 319.1 million by 2035, registering a CAGR of 2.8% over the forecast period. Germany is expected to maintain its leadership despite a slight reduction in share from 24.2% in 2025 to 23.1% by 2035, supported by its extensive construction industry and advanced automation adoption rates.

The Rest of Europe region is projected to gain ground, expanding its share from 16.3% to 18.1%, attributed to rising security automation adoption in Eastern European construction markets and Nordic infrastructure projects. France and the UK will also see moderate gains, while Italy and Spain show marginal declines, likely due to mature construction markets and slower adoption of autonomous surveillance technologies.
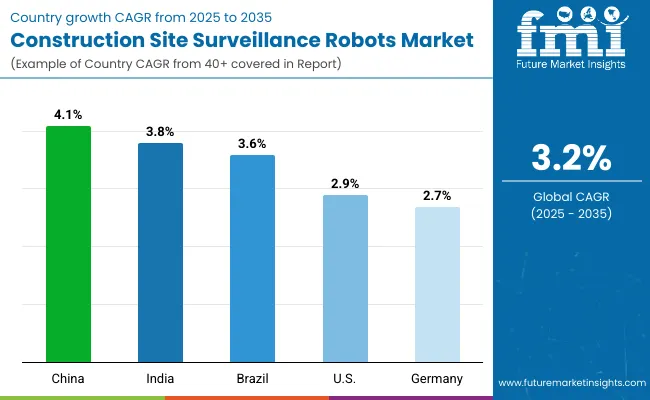
Analysis of Construction Site Surveillance Robots Market by Key Country

Construction Site Surveillance Robots Market By Country

Countries CAGR (2025 to 2035)
China 4.1%
India 3.8%
Brazil 3.6%
USA 2.9%
Germany 2.7%

The construction site surveillance robots market is growing rapidly, with China leading at a 4.1% CAGR through 2035, driven by massive infrastructure development, smart city initiatives, and expanding construction automation adoption. India follows at 3.8%, supported by growing construction sector investments and increasing security awareness in urban development projects. Brazil grows steadily at 3.6%, integrating surveillance robots into established construction operations. The USA records 2.9%, emphasizing regulatory compliance and insurance-driven security requirements. Germany shows the most modest growth at 2.7%, focusing on precision technology and integration with existing construction management systems.

The report covers an in-depth analysis of 40+ countries; five top-performing countries are highlighted below.

China Leads Global Market Growth with Smart City Integration

Revenue from construction site surveillance robots in China is projected to exhibit the highest growth rate with a CAGR of 4.1% through 2035, driven by massive infrastructure development programs and government initiatives promoting construction automation technologies. The country's expanding smart city projects and digital technology integration in urban planning are creating significant demand for advanced surveillance systems. Major construction companies and government agencies are establishing comprehensive surveillance networks to support the growing scale of construction projects across urban and industrial developments.

Government technology advancement programs are supporting development of specialized surveillance capabilities and training programs that enhance service quality and technical expertise across construction networks. Construction industry modernization initiatives are facilitating adoption of automated surveillance technologies that support comprehensive security management and regulatory compliance requirements. Professional development programs are creating technical expertise among security providers, enabling specialized surveillance services that meet evolving construction technology requirements.

India Demonstrates Strong Market Potential with Infrastructure Expansion

Revenue from construction site surveillance robots in India is expanding at a CAGR of 3.8%, supported by increasing infrastructure investments and growing awareness of construction site security requirements. The country's expanding construction sector and rising urban development projects are driving demand for professional surveillance services that can support large-scale construction activities. Government infrastructure programs and private construction companies are gradually establishing capabilities to deploy advanced surveillance technologies.

Construction industry growth and infrastructure development programs are creating opportunities for specialized surveillance service providers that can support diverse construction technologies and project requirements. Professional training and technology adoption programs are developing technical expertise among security providers, enabling comprehensive surveillance services that meet international quality and safety standards for major construction projects.

Brazil Maintains Steady Growth with Construction Sector Integration

Revenue from construction site surveillance robots in Brazil is growing at a CAGR of 3.6%, driven by integration of surveillance technologies into established construction operations and growing recognition of security automation benefits. The country's construction industry is gradually adopting advanced surveillance capabilities to address security challenges and regulatory requirements. Construction companies and security providers are investing in surveillance technologies and training to enhance project security management.

Construction sector modernization programs are facilitating adoption of surveillance automation technologies that support comprehensive security management across residential and commercial construction projects. Professional service development initiatives are enhancing technical capabilities among security providers, enabling specialized surveillance services that meet evolving construction security requirements and regulatory standards.
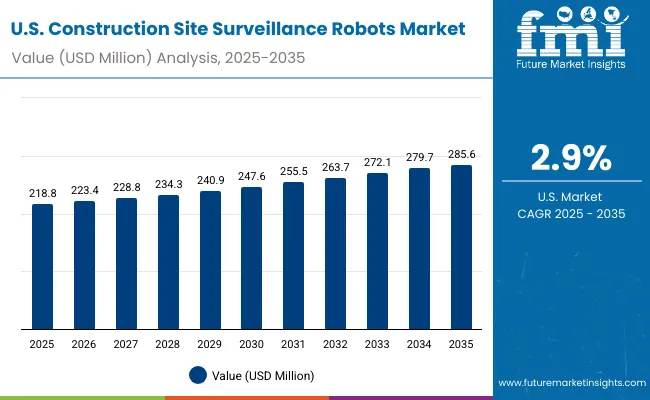
United States Emphasizes Regulatory Compliance and Insurance Requirements

Construction Site Surveillance Robots Market Usa

Demand for construction site surveillance robots in the USA is projected to grow at a CAGR of 2.9%, supported by stringent regulatory compliance requirements and insurance industry mandates for enhanced site security. American construction companies are implementing comprehensive surveillance systems to meet liability requirements and maintain insurance coverage. The market is characterized by focus on integration with existing construction management systems and compliance with occupational safety regulations.

Construction industry regulatory requirements are prioritizing surveillance technologies that demonstrate superior compliance monitoring and safety management while meeting American construction quality and insurance standards. Professional certification programs are ensuring comprehensive technical expertise among security providers, enabling specialized surveillance services that support diverse construction projects and regulatory compliance requirements.

Germany Focuses on Precision Technology and System Integration

Demand for construction site surveillance robots in Germany is expanding at a CAGR of 2.7%, driven by the country's emphasis on precision engineering and advanced technology integration in construction operations. German construction companies are implementing surveillance systems that meet stringent quality standards and demonstrate exceptional reliability and integration capabilities. The market is characterized by focus on technical excellence, advanced sensor integration, and compliance with comprehensive construction safety regulations.

Construction technology industry investments are prioritizing surveillance systems that demonstrate superior precision and integration capabilities while meeting German construction quality and safety standards. Professional development programs are ensuring comprehensive technical expertise among service providers, enabling specialized surveillance capabilities that support diverse construction technologies and regulatory compliance requirements.

Europe Market Split by Segment

Wheeled UGV Systems Lead European Deployment with 42% Market Share

In Europe, the construction site surveillance robots market is predominantly driven by wheeled UGV platforms, which account for 42% of total deployment in 2025. The preference for wheeled systems reflects the diverse terrain conditions across European construction sites and the established infrastructure for ground-based surveillance operations. These platforms provide optimal balance between mobility, sensor capacity, and operational endurance for European construction environments. Advanced navigation systems and sensor integration make wheeled platforms suitable for complex urban construction sites common throughout major European markets.

Wheeled surveillance robots benefit from established maintenance networks and technical support infrastructure across European markets. The integration of advanced AI capabilities and multi-sensor platforms enhances detection accuracy and operational efficiency in diverse construction environments. European construction companies increasingly rely on wheeled surveillance systems for comprehensive site monitoring and regulatory compliance documentation.

Security Patrol Applications Dominate European Operations with 38% Share

Security patrol represents the primary application for construction surveillance robots in Europe, holding 38% of market deployment in 2025. European construction sites utilize patrol robots for perimeter monitoring, access control, and deterrent presence during non-operational hours. The emphasis on continuous site security reflects stringent insurance requirements and regulatory compliance standards common across European construction markets. Patrol robots provide cost-effective security coverage that reduces reliance on human guards while maintaining comprehensive monitoring capabilities.

European security patrol implementations focus on integration with existing construction management systems and compliance documentation requirements. Advanced patrol robots incorporate environmental monitoring capabilities that support occupational safety compliance while maintaining primary security functions. The growing adoption of autonomous patrol systems reflects European construction industry emphasis on operational efficiency and regulatory compliance.
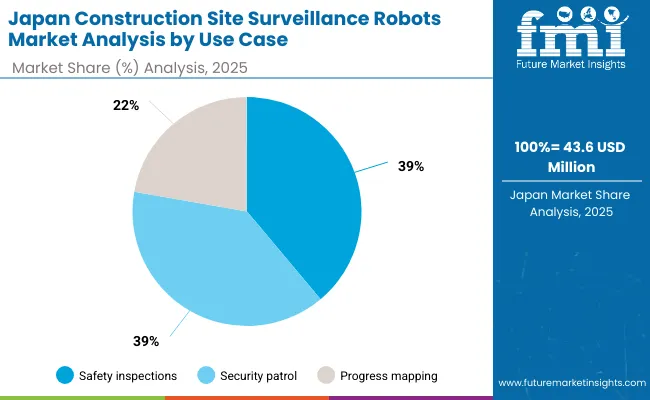
Japan Market Split by Segment

Construction Site Surveillance Robots Market Japan

Commercial Construction Projects Drive 48% of Japanese Surveillance Robot Demand

In Japan, the construction site surveillance robots market is largely driven by commercial construction projects, which account for 48% of total robot deployment in 2025. The high concentration of commercial construction activity in urban areas and the stringent security requirements for large-scale projects are key contributing factors. Japanese commercial construction emphasizes precision scheduling and asset protection, making continuous surveillance critical for project success. Advanced robotics integration reflects Japan's leadership in automation technology and construction industry innovation.

Commercial construction surveillance robots in Japan incorporate sophisticated AI analytics and predictive maintenance capabilities that enhance operational efficiency. The integration of surveillance systems with construction management platforms enables comprehensive project monitoring and security documentation. Japanese construction companies increasingly rely on autonomous surveillance technologies to maintain competitive advantages in complex urban construction environments.

Autonomous Navigation Systems Account for 52% of Japanese Market Share

Autonomous navigation technology represents the dominant technical approach for construction surveillance robots in Japan, holding 52% of market share in 2025. Japanese construction companies prioritize autonomous systems that require minimal human intervention while providing consistent monitoring performance. The emphasis on autonomous operation reflects Japan's advanced robotics capabilities and construction industry focus on operational efficiency. Sophisticated navigation systems enable effective operation in complex construction environments common in dense urban areas.

Japanese autonomous surveillance implementations emphasize integration with broader construction automation ecosystems and quality management systems. Advanced navigation capabilities support precise patrol routes and consistent monitoring coverage that meets stringent Japanese construction quality standards. The growing adoption of fully autonomous systems reflects Japanese construction industry leadership in advanced automation technologies and operational optimization.
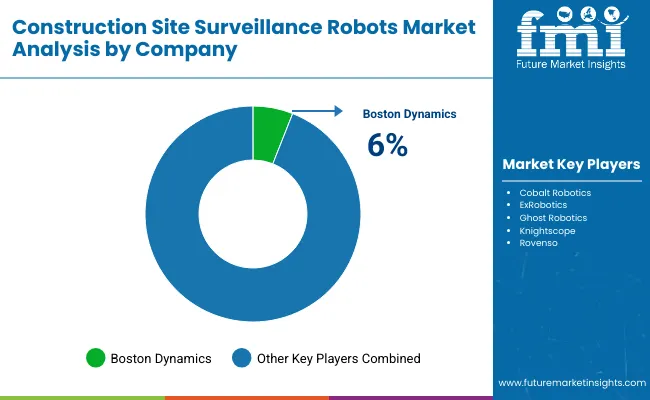
Competitive Landscape of Construction Site Surveillance Robots Market Construction Site Surveillance Robots Market by Segments

Construction Site Surveillance Robots Market By Company

The construction site surveillance robots market is highly competitive, shaped by robotics manufacturers, security service providers, and construction technology firms that are racing to differentiate on mobility, autonomy, and multi-sensor intelligence. At one end of the spectrum, companies such as Boston Dynamics are pushing the frontier of sophisticated mobility platforms, bringing quadruped robots with payload flexibility into rugged, dynamic construction environments. At the other, providers like SMP Robotics and Knightscope are focusing on scalable wheeled UGVs and visible deterrent systems that combine AI-powered analytics with continuous patrol capabilities. This creates a bifurcated market premium innovators commanding attention with high-performance systems, and practical suppliers capturing share through cost-effective, outdoor-ready patrol robots.

Another layer of competition comes from firms emphasizing integrated security ecosystems rather than standalone hardware. Cobalt Robotics and Ava Robotics highlight the convergence of surveillance with human-robot collaboration and telepresence monitoring, targeting indoor facilities, staging areas, and remote management use cases. Drone-focused players such as Nightingale Security, DJI Enterprise, Parrot Professional, and Autel Robotics bring aerial coverage and rapid response capabilities, complementing ground patrols with wide-area visibility. Together, these approaches reveal an industry that is no longer about robots alone, but about comprehensive monitoring platforms that blend ground, aerial, and remote oversight into unified site-management systems.

Overall, the market is moving toward service-driven competition where innovation extends beyond hardware to include AI-driven threat detection, insurance-aligned reporting, and environmental monitoring compliance. Partnerships between robot OEMs, insurers, and construction technology vendors are emerging as decisive differentiators, since end users increasingly demand solutions that deliver cost efficiency, compliance assurance, and multi-functional value. In this landscape, success depends less on being the most advanced in mobility and more on being the most integrated into the workflows, budgets, and risk frameworks of modern construction projects.

Key Players in the Construction Site Surveillance Robots Market

  • Boston Dynamics
  • SMP Robotics
  • Knightscope Inc.
  • Cobalt Robotics
  • Ava Robotics
  • Nightingale Security
  • DJI Enterprise
  • Parrot Professional
  • Autel Robotics

Scope of the Report

Item Value
Quantitative Units USD Million
Mobility Type Wheeled UGV, Tracked UGV, and Other Configurations
Use Case Security Patrol, Security Inspection, Progress Monitoring, and Hazard Detection
End User Residential Construction, Commercial Construction, Industrial Construction, and Infrastructure Projects
Technology Type Autonomous Navigation, Remote Control, and Hybrid Systems
Regions Covered North America, Europe, East Asia, South Asia & Pacific, Latin America, Middle East & Africa
Country Covered United States, Germany, India, China, United Kingdom, Japan, Brazil
Key Companies Profiled Boston Dynamics, SMP Robotics, Knightscope Inc., Cobalt Robotics, Ava Robotics, Nightingale Security, DJI Enterprise, Parrot Professional, Autel Robotics
Additional Attributes Revenue analysis by mobility type, use case, and end user segments, regional demand trends across North America, Europe, and Asia-Pacific, competitive landscape assessment with established players and emerging technology providers, adoption patterns for autonomous versus remote-controlled systems, integration capabilities with existing construction management platforms, innovations in AI-powered analytics and multi-sensor surveillance technologies, and deployment strategies for various construction environments including urban, industrial, and infrastructure project applications.

Construction Site Surveillance Robots Market by Segments

By Mobility Type:

  • Wheeled UGV
  • Tracked UGV
  • Other Configurations

By Use Case:

  • Security Patrol
  • Security Inspection
  • Progress Monitoring
  • Hazard Detection

By End User:

  • Residential Construction
  • Commercial Construction
  • Industrial Construction
  • Infrastructure Projects

By Technology Type:

  • Autonomous Navigation
  • Remote Control
  • Hybrid Systems

By Region:

  • North America
  • United States
  • Canada
  • Mexico
  • Europe
  • Germany
  • United Kingdom
  • France
  • Italy
  • Spain
  • Nordic
  • BENELUX
  • Rest of Europe
  • East Asia
  • China
  • Japan
  • South Korea
  • South Asia & Pacific
  • India
  • ASEAN
  • Australia & New Zealand
  • Rest of South Asia & Pacific
  • Latin America
  • Brazil
  • Chile
  • Rest of Latin America
  • Middle East & Africa
  • Kingdom of Saudi Arabia
  • Other GCC Countries
  • Turkiye
  • South Africa
  • Other African Union
  • Rest of Middle East & Africa

Table of Content

  1. Executive Summary
    • Global Market Outlook
    • Demand-side Trends
    • Supply-side Trends
    • Technology Roadmap Analysis
    • Analysis and Recommendations
  2. Market Overview
    • Market Coverage / Taxonomy
    • Market Definition / Scope / Limitations
  3. Market Background
    • Market Dynamics
      • Drivers
      • Restraints
      • Opportunity
      • Trends
    • Scenario Forecast
      • Demand in Optimistic Scenario
      • Demand in Likely Scenario
      • Demand in Conservative Scenario
    • Opportunity Map Analysis
    • Product Life Cycle Analysis
    • Supply Chain Analysis
      • Supply Side Participants and their Roles
        • Producers
        • Mid-Level Participants (Traders/ Agents/ Brokers)
        • Wholesalers and Distributors
      • Value Added and Value Created at Node in the Supply Chain
      • List of Raw Material Suppliers
      • List of Existing and Potential Buyer's
    • Investment Feasibility Matrix
    • Value Chain Analysis
      • Profit Margin Analysis
      • Wholesalers and Distributors
      • Retailers
    • PESTLE and Porter's Analysis
    • Regulatory Landscape
      • By Key Regions
      • By Key Countries
    • Regional Parent Market Outlook
    • Production and Consumption Statistics
    • Cross-Border Data Residency & Procurement Patterns
  4. Global Market Analysis 2020 to 2024 and Forecast, 2025 to 2035
    • Historical Market Size Value (USD Billion) & Volume (Units) Analysis, 2020 to 2024
    • Current and Future Market Size Value (USD Billion) & Volume (Units) Projections, 2025 to 2035
      • Y-o-Y Growth Trend Analysis
      • Absolute $ Opportunity Analysis
  5. Global Market Analysis 2020 to 2024 and Forecast 2025 to 2035, By Company
    • Introduction / Key Findings
    • Historical Market Size Value (USD Billion) & Volume (Units) Analysis By Company, 2020 to 2024
    • Current and Future Market Size Value (USD Billion) & Volume (Units) Analysis and Forecast By Company, 2025 to 2035
      • ANYbotics
      • Ascento Robotics
      • Boston Dynamics
      • Cobalt Robotics
      • ExRobotics
      • Ghost Robotics
      • Knightscope
      • Rovenso
      • SMP Robotics
      • Unitree Robotics
    • Y-o-Y Growth Trend Analysis By Company, 2020 to 2024
    • Absolute $ Opportunity Analysis By Company, 2025 to 2035
  6. Global Market Analysis 2020 to 2024 and Forecast 2025 to 2035, By Mobility Type
    • Introduction / Key Findings
    • Historical Market Size Value (USD Billion) & Volume (Units) Analysis By Mobility Type, 2020 to 2024
    • Current and Future Market Size Value (USD Billion) & Volume (Units) Analysis and Forecast By Mobility Type, 2025 to 2035
      • Wheeled UGV
      • Quadruped
      • Tracked UGV
      • Other
    • Y-o-Y Growth Trend Analysis By Mobility Type, 2020 to 2024
    • Absolute $ Opportunity Analysis By Mobility Type, 2025 to 2035
  7. Global Market Analysis 2020 to 2024 and Forecast 2025 to 2035, By Use Case
    • Introduction / Key Findings
    • Historical Market Size Value (USD Billion) & Volume (Units) Analysis By Use Case, 2020 to 2024
    • Current and Future Market Size Value (USD Billion) & Volume (Units) Analysis and Forecast By Use Case, 2025 to 2035
      • Security patrol/intrusion
      • Progress monitoring/mapping
      • HSE/safety inspections
      • Thermal/gas hazard detection
    • Y-o-Y Growth Trend Analysis By Use Case, 2020 to 2024
    • Absolute $ Opportunity Analysis By Use Case, 2025 to 2035
  8. Global Market Analysis 2020 to 2024 and Forecast 2025 to 2035, By Autonomy Level
    • Introduction / Key Findings
    • Historical Market Size Value (USD Billion) & Volume (Units) Analysis By Autonomy Level, 2020 to 2024
    • Current and Future Market Size Value (USD Billion) & Volume (Units) Analysis and Forecast By Autonomy Level, 2025 to 2035
      • Supervised autonomy
      • Teleoperated
      • Fully autonomous
    • Y-o-Y Growth Trend Analysis By Autonomy Level, 2020 to 2024
    • Absolute $ Opportunity Analysis By Autonomy Level, 2025 to 2035
  9. Global Market Analysis 2020 to 2024 and Forecast 2025 to 2035, By Customer Type
    • Introduction / Key Findings
    • Historical Market Size Value (USD Billion) & Volume (Units) Analysis By Customer Type, 2020 to 2024
    • Current and Future Market Size Value (USD Billion) & Volume (Units) Analysis and Forecast By Customer Type, 2025 to 2035
      • General contractors/EPC
      • Industrial owners (O&G, utilities)
      • Mining/construction majors
      • Gov't & infrastructure
    • Y-o-Y Growth Trend Analysis By Customer Type, 2020 to 2024
    • Absolute $ Opportunity Analysis By Customer Type, 2025 to 2035
  10. Global Market Analysis 2020 to 2024 and Forecast 2025 to 2035, By Region
    • Introduction
    • Historical Market Size Value (USD Billion) & Volume (Units) Analysis By Region, 2020 to 2024
    • Current Market Size Value (USD Billion) & Volume (Units) Analysis and Forecast By Region, 2025 to 2035
      • North America
      • Latin America
      • East Asia
      • South Asia & Pacific
      • Western Europe
      • Eastern Europe
      • Middle East & Africa
    • Market Attractiveness Analysis By Region
  11. North America Market Analysis 2020 to 2024 and Forecast 2025 to 2035, By Country
    • Historical Market Size Value (USD Billion) & Volume (Units) Trend Analysis By Market Taxonomy, 2020 to 2024
    • Market Size Value (USD Billion) & Volume (Units) Forecast By Market Taxonomy, 2025 to 2035
      • By Country
        • USA
        • Canada
        • Mexico
      • By Company
      • By Mobility Type
      • By Use Case
      • By Autonomy Level
      • By Customer Type
    • Market Attractiveness Analysis
      • By Country
      • By Company
      • By Mobility Type
      • By Use Case
      • By Autonomy Level
      • By Customer Type
    • Key Takeaways
  12. Latin America Market Analysis 2020 to 2024 and Forecast 2025 to 2035, By Country
    • Historical Market Size Value (USD Billion) & Volume (Units) Trend Analysis By Market Taxonomy, 2020 to 2024
    • Market Size Value (USD Billion) & Volume (Units) Forecast By Market Taxonomy, 2025 to 2035
      • By Country
        • Brazil
        • Argentina
        • Rest of Latin America
      • By Company
      • By Mobility Type
      • By Use Case
      • By Autonomy Level
      • By Customer Type
    • Market Attractiveness Analysis
      • By Country
      • By Company
      • By Mobility Type
      • By Use Case
      • By Autonomy Level
      • By Customer Type
    • Key Takeaways
  13. East Asia Market Analysis 2020 to 2024 and Forecast 2025 to 2035, By Country
    • Historical Market Size Value (USD Billion) & Volume (Units) Trend Analysis By Market Taxonomy, 2020 to 2024
    • Market Size Value (USD Billion) & Volume (Units) Forecast By Market Taxonomy, 2025 to 2035
      • By Country
        • China
        • Japan
        • South Korea
      • By Company
      • By Mobility Type
      • By Use Case
      • By Autonomy Level
      • By Customer Type
    • Market Attractiveness Analysis
      • By Country
      • By Company
      • By Mobility Type
      • By Use Case
      • By Autonomy Level
      • By Customer Type
    • Key Takeaways
  14. South Asia & Pacific Market Analysis 2020 to 2024 and Forecast 2025 to 2035, By Country
    • Historical Market Size Value (USD Billion) & Volume (Units) Trend Analysis By Market Taxonomy, 2020 to 2024
    • Market Size Value (USD Billion) & Volume (Units) Forecast By Market Taxonomy, 2025 to 2035
      • By Country
        • India
        • ASEAN Countries
        • Australia & New Zealand
        • Rest of South Asia
      • By Company
      • By Mobility Type
      • By Use Case
      • By Autonomy Level
      • By Customer Type
    • Market Attractiveness Analysis
      • By Country
      • By Company
      • By Mobility Type
      • By Use Case
      • By Autonomy Level
      • By Customer Type
    • Key Takeaways
  15. Western Europe Market Analysis 2020 to 2024 and Forecast 2025 to 2035, By Country
    • Historical Market Size Value (USD Billion) & Volume (Units) Trend Analysis By Market Taxonomy, 2020 to 2024
    • Market Size Value (USD Billion) & Volume (Units) Forecast By Market Taxonomy, 2025 to 2035
      • By Country
        • Germany
        • UK
        • France
        • Italy
        • Spain
        • BENELUX
        • Nordic Countries
        • Rest of Western Europe
      • By Company
      • By Mobility Type
      • By Use Case
      • By Autonomy Level
      • By Customer Type
    • Market Attractiveness Analysis
      • By Country
      • By Company
      • By Mobility Type
      • By Use Case
      • By Autonomy Level
      • By Customer Type
    • Key Takeaways
  16. Eastern Europe Market Analysis 2020 to 2024 and Forecast 2025 to 2035, By Country
    • Historical Market Size Value (USD Billion) & Volume (Units) Trend Analysis By Market Taxonomy, 2020 to 2024
    • Market Size Value (USD Billion) & Volume (Units) Forecast By Market Taxonomy, 2025 to 2035
      • By Country
        • Russia
        • Hungary
        • Poland
        • Rest of Eastern Europe
      • By Company
      • By Mobility Type
      • By Use Case
      • By Autonomy Level
      • By Customer Type
    • Market Attractiveness Analysis
      • By Country
      • By Company
      • By Mobility Type
      • By Use Case
      • By Autonomy Level
      • By Customer Type
    • Key Takeaways
  17. Middle East & Africa Market Analysis 2020 to 2024 and Forecast 2025 to 2035, By Country
    • Historical Market Size Value (USD Billion) & Volume (Units) Trend Analysis By Market Taxonomy, 2020 to 2024
    • Market Size Value (USD Billion) & Volume (Units) Forecast By Market Taxonomy, 2025 to 2035
      • By Country
        • Saudi Arabia
        • Türkiye
        • South Africa
        • Other African Union
        • Rest of Middle East & Africa
      • By Company
      • By Mobility Type
      • By Use Case
      • By Autonomy Level
      • By Customer Type
    • Market Attractiveness Analysis
      • By Country
      • By Company
      • By Mobility Type
      • By Use Case
      • By Autonomy Level
      • By Customer Type
    • Key Takeaways
  18. Key Countries Market Analysis
    • USA
      • Pricing Analysis
      • Market Share Analysis, 2024
        • By Company
        • By Mobility Type
        • By Use Case
        • By Autonomy Level
        • By Customer Type
    • Brazil
      • Pricing Analysis
      • Market Share Analysis, 2024
        • By Company
        • By Mobility Type
        • By Use Case
        • By Autonomy Level
        • By Customer Type
    • China
      • Pricing Analysis
      • Market Share Analysis, 2024
        • By Company
        • By Mobility Type
        • By Use Case
        • By Autonomy Level
        • By Customer Type
    • India
      • Pricing Analysis
      • Market Share Analysis, 2024
        • By Company
        • By Mobility Type
        • By Use Case
        • By Autonomy Level
        • By Customer Type
    • Europe
      • Pricing Analysis
      • Market Share Analysis, 2024
        • By Company
        • By Mobility Type
        • By Use Case
        • By Autonomy Level
        • By Customer Type
    • Germany
      • Pricing Analysis
      • Market Share Analysis, 2024
        • By Company
        • By Mobility Type
        • By Use Case
        • By Autonomy Level
        • By Customer Type
    • France
      • Pricing Analysis
      • Market Share Analysis, 2024
        • By Company
        • By Mobility Type
        • By Use Case
        • By Autonomy Level
        • By Customer Type
    • UK
      • Pricing Analysis
      • Market Share Analysis, 2024
        • By Company
        • By Mobility Type
        • By Use Case
        • By Autonomy Level
        • By Customer Type
  19. Market Structure Analysis
    • Competition Dashboard
    • Competition Benchmarking
    • Market Share Analysis of Top Players
      • By Regional
      • By Company
      • By Mobility Type
      • By Use Case
      • By Autonomy Level
      • By Customer Type
  20. Competition Analysis
    • Competition Deep Dive
      • ANYbotics
        • Overview
        • Product Portfolio
        • Profitability by Market Segments (Product/Age/Sales Channel/Region)
        • Sales Footprint
        • Strategy Overview
          • Marketing Strategy
          • Product Strategy
          • Channel Strategy
      • Ascento Robotics
        • Overview
        • Product Portfolio
        • Profitability by Market Segments (Product/Age/Sales Channel/Region)
        • Sales Footprint
        • Strategy Overview
          • Marketing Strategy
          • Product Strategy
          • Channel Strategy
      • Boston Dynamics
        • Overview
        • Product Portfolio
        • Profitability by Market Segments (Product/Age/Sales Channel/Region)
        • Sales Footprint
        • Strategy Overview
          • Marketing Strategy
          • Product Strategy
          • Channel Strategy
      • Cobalt Robotics
        • Overview
        • Product Portfolio
        • Profitability by Market Segments (Product/Age/Sales Channel/Region)
        • Sales Footprint
        • Strategy Overview
          • Marketing Strategy
          • Product Strategy
          • Channel Strategy
      • ExRobotics
        • Overview
        • Product Portfolio
        • Profitability by Market Segments (Product/Age/Sales Channel/Region)
        • Sales Footprint
        • Strategy Overview
          • Marketing Strategy
          • Product Strategy
          • Channel Strategy
      • Ghost Robotics
        • Overview
        • Product Portfolio
        • Profitability by Market Segments (Product/Age/Sales Channel/Region)
        • Sales Footprint
        • Strategy Overview
          • Marketing Strategy
          • Product Strategy
          • Channel Strategy
      • Knightscope
        • Overview
        • Product Portfolio
        • Profitability by Market Segments (Product/Age/Sales Channel/Region)
        • Sales Footprint
        • Strategy Overview
          • Marketing Strategy
          • Product Strategy
          • Channel Strategy
      • Rovenso
        • Overview
        • Product Portfolio
        • Profitability by Market Segments (Product/Age/Sales Channel/Region)
        • Sales Footprint
        • Strategy Overview
          • Marketing Strategy
          • Product Strategy
          • Channel Strategy
      • SMP Robotics
        • Overview
        • Product Portfolio
        • Profitability by Market Segments (Product/Age/Sales Channel/Region)
        • Sales Footprint
        • Strategy Overview
          • Marketing Strategy
          • Product Strategy
          • Channel Strategy
      • Unitree Robotics
        • Overview
        • Product Portfolio
        • Profitability by Market Segments (Product/Age/Sales Channel/Region)
        • Sales Footprint
        • Strategy Overview
          • Marketing Strategy
          • Product Strategy
          • Channel Strategy
  21. Assumptions & Acronyms Used
  22. Research Methodology

List of Tables

  • Table 1: Global Market Value (USD Billion) Forecast by Region, 2020-2035
  • Table 2: Global Market Volume (Units) Forecast by Region, 2020-2035
  • Table 3: Global Market Value (USD Billion) Forecast by Company, 2020-2035
  • Table 4: Global Market Volume (Units) Forecast by Company, 2020-2035
  • Table 5: Global Market Value (USD Billion) Forecast by Mobility Type, 2020-2035
  • Table 6: Global Market Volume (Units) Forecast by Mobility Type, 2020-2035
  • Table 7: Global Market Value (USD Billion) Forecast by Use Case, 2020-2035
  • Table 8: Global Market Volume (Units) Forecast by Use Case, 2020-2035
  • Table 9: Global Market Value (USD Billion) Forecast by Autonomy Level, 2020-2035
  • Table 10: Global Market Volume (Units) Forecast by Autonomy Level, 2020-2035
  • Table 11: Global Market Value (USD Billion) Forecast by Customer Type, 2020-2035
  • Table 12: Global Market Volume (Units) Forecast by Customer Type, 2020-2035
  • Table 13: North America Market Value (USD Billion) Forecast by Country, 2020-2035
  • Table 14: North America Market Volume (Units) Forecast by Country, 2020-2035
  • Table 15: North America Market Value (USD Billion) Forecast by Company, 2020-2035
  • Table 16: North America Market Volume (Units) Forecast by Company, 2020-2035
  • Table 17: North America Market Value (USD Billion) Forecast by Mobility Type, 2020-2035
  • Table 18: North America Market Volume (Units) Forecast by Mobility Type, 2020-2035
  • Table 19: North America Market Value (USD Billion) Forecast by Use Case, 2020-2035
  • Table 20: North America Market Volume (Units) Forecast by Use Case, 2020-2035
  • Table 21: North America Market Value (USD Billion) Forecast by Autonomy Level, 2020-2035
  • Table 22: North America Market Volume (Units) Forecast by Autonomy Level, 2020-2035
  • Table 23: North America Market Value (USD Billion) Forecast by Customer Type, 2020-2035
  • Table 24: North America Market Volume (Units) Forecast by Customer Type, 2020-2035
  • Table 25: Latin America Market Value (USD Billion) Forecast by Country, 2020-2035
  • Table 26: Latin America Market Volume (Units) Forecast by Country, 2020-2035
  • Table 27: Latin America Market Value (USD Billion) Forecast by Company, 2020-2035
  • Table 28: Latin America Market Volume (Units) Forecast by Company, 2020-2035
  • Table 29: Latin America Market Value (USD Billion) Forecast by Mobility Type, 2020-2035
  • Table 30: Latin America Market Volume (Units) Forecast by Mobility Type, 2020-2035
  • Table 31: Latin America Market Value (USD Billion) Forecast by Use Case, 2020-2035
  • Table 32: Latin America Market Volume (Units) Forecast by Use Case, 2020-2035
  • Table 33: Latin America Market Value (USD Billion) Forecast by Autonomy Level, 2020-2035
  • Table 34: Latin America Market Volume (Units) Forecast by Autonomy Level, 2020-2035
  • Table 35: Latin America Market Value (USD Billion) Forecast by Customer Type, 2020-2035
  • Table 36: Latin America Market Volume (Units) Forecast by Customer Type, 2020-2035
  • Table 37: East Asia Market Value (USD Billion) Forecast by Country, 2020-2035
  • Table 38: East Asia Market Volume (Units) Forecast by Country, 2020-2035
  • Table 39: East Asia Market Value (USD Billion) Forecast by Company, 2020-2035
  • Table 40: East Asia Market Volume (Units) Forecast by Company, 2020-2035
  • Table 41: East Asia Market Value (USD Billion) Forecast by Mobility Type, 2020-2035
  • Table 42: East Asia Market Volume (Units) Forecast by Mobility Type, 2020-2035
  • Table 43: East Asia Market Value (USD Billion) Forecast by Use Case, 2020-2035
  • Table 44: East Asia Market Volume (Units) Forecast by Use Case, 2020-2035
  • Table 45: East Asia Market Value (USD Billion) Forecast by Autonomy Level, 2020-2035
  • Table 46: East Asia Market Volume (Units) Forecast by Autonomy Level, 2020-2035
  • Table 47: East Asia Market Value (USD Billion) Forecast by Customer Type, 2020-2035
  • Table 48: East Asia Market Volume (Units) Forecast by Customer Type, 2020-2035
  • Table 49: South Asia & Pacific Market Value (USD Billion) Forecast by Country, 2020-2035
  • Table 50: South Asia & Pacific Market Volume (Units) Forecast by Country, 2020-2035
  • Table 51: South Asia & Pacific Market Value (USD Billion) Forecast by Company, 2020-2035
  • Table 52: South Asia & Pacific Market Volume (Units) Forecast by Company, 2020-2035
  • Table 53: South Asia & Pacific Market Value (USD Billion) Forecast by Mobility Type, 2020-2035
  • Table 54: South Asia & Pacific Market Volume (Units) Forecast by Mobility Type, 2020-2035
  • Table 55: South Asia & Pacific Market Value (USD Billion) Forecast by Use Case, 2020-2035
  • Table 56: South Asia & Pacific Market Volume (Units) Forecast by Use Case, 2020-2035
  • Table 57: South Asia & Pacific Market Value (USD Billion) Forecast by Autonomy Level, 2020-2035
  • Table 58: South Asia & Pacific Market Volume (Units) Forecast by Autonomy Level, 2020-2035
  • Table 59: South Asia & Pacific Market Value (USD Billion) Forecast by Customer Type, 2020-2035
  • Table 60: South Asia & Pacific Market Volume (Units) Forecast by Customer Type, 2020-2035
  • Table 61: Western Europe Market Value (USD Billion) Forecast by Country, 2020-2035
  • Table 62: Western Europe Market Volume (Units) Forecast by Country, 2020-2035
  • Table 63: Western Europe Market Value (USD Billion) Forecast by Company, 2020-2035
  • Table 64: Western Europe Market Volume (Units) Forecast by Company, 2020-2035
  • Table 65: Western Europe Market Value (USD Billion) Forecast by Mobility Type, 2020-2035
  • Table 66: Western Europe Market Volume (Units) Forecast by Mobility Type, 2020-2035
  • Table 67: Western Europe Market Value (USD Billion) Forecast by Use Case, 2020-2035
  • Table 68: Western Europe Market Volume (Units) Forecast by Use Case, 2020-2035
  • Table 69: Western Europe Market Value (USD Billion) Forecast by Autonomy Level, 2020-2035
  • Table 70: Western Europe Market Volume (Units) Forecast by Autonomy Level, 2020-2035
  • Table 71: Western Europe Market Value (USD Billion) Forecast by Customer Type, 2020-2035
  • Table 72: Western Europe Market Volume (Units) Forecast by Customer Type, 2020-2035
  • Table 73: Eastern Europe Market Value (USD Billion) Forecast by Country, 2020-2035
  • Table 74: Eastern Europe Market Volume (Units) Forecast by Country, 2020-2035
  • Table 75: Eastern Europe Market Value (USD Billion) Forecast by Company, 2020-2035
  • Table 76: Eastern Europe Market Volume (Units) Forecast by Company, 2020-2035
  • Table 77: Eastern Europe Market Value (USD Billion) Forecast by Mobility Type, 2020-2035
  • Table 78: Eastern Europe Market Volume (Units) Forecast by Mobility Type, 2020-2035
  • Table 79: Eastern Europe Market Value (USD Billion) Forecast by Use Case, 2020-2035
  • Table 80: Eastern Europe Market Volume (Units) Forecast by Use Case, 2020-2035
  • Table 81: Eastern Europe Market Value (USD Billion) Forecast by Autonomy Level, 2020-2035
  • Table 82: Eastern Europe Market Volume (Units) Forecast by Autonomy Level, 2020-2035
  • Table 83: Eastern Europe Market Value (USD Billion) Forecast by Customer Type, 2020-2035
  • Table 84: Eastern Europe Market Volume (Units) Forecast by Customer Type, 2020-2035
  • Table 85: Middle East & Africa Market Value (USD Billion) Forecast by Country, 2020-2035
  • Table 86: Middle East & Africa Market Volume (Units) Forecast by Country, 2020-2035
  • Table 87: Middle East & Africa Market Value (USD Billion) Forecast by Company, 2020-2035
  • Table 88: Middle East & Africa Market Volume (Units) Forecast by Company, 2020-2035
  • Table 89: Middle East & Africa Market Value (USD Billion) Forecast by Mobility Type, 2020-2035
  • Table 90: Middle East & Africa Market Volume (Units) Forecast by Mobility Type, 2020-2035
  • Table 91: Middle East & Africa Market Value (USD Billion) Forecast by Use Case, 2020-2035
  • Table 92: Middle East & Africa Market Volume (Units) Forecast by Use Case, 2020-2035
  • Table 93: Middle East & Africa Market Value (USD Billion) Forecast by Autonomy Level, 2020-2035
  • Table 94: Middle East & Africa Market Volume (Units) Forecast by Autonomy Level, 2020-2035
  • Table 95: Middle East & Africa Market Value (USD Billion) Forecast by Customer Type, 2020-2035
  • Table 96: Middle East & Africa Market Volume (Units) Forecast by Customer Type, 2020-2035

List of Figures

  • Figure 1: Global Market Value (USD Billion) by Company, 2025-2035
  • Figure 2: Global Market Value (USD Billion) by Mobility Type, 2025-2035
  • Figure 3: Global Market Value (USD Billion) by Use Case, 2025-2035
  • Figure 4: Global Market Value (USD Billion) by Autonomy Level, 2025-2035
  • Figure 5: Global Market Value (USD Billion) by Customer Type, 2025-2035
  • Figure 6: Global Market Value (USD Billion) by Region, 2025-2035
  • Figure 7: Global Market Value (USD Billion) Analysis by Region, 2020-2035
  • Figure 8: Global Market Volume (Units) Analysis by Region, 2020-2035
  • Figure 9: Global Market Value Share (%) and BPS Analysis by Region, 2025-2035
  • Figure 10: Global Market Y-o-Y Growth (%) Projections by Region, 2025-2035
  • Figure 11: Global Market Value (USD Billion) Analysis by Company, 2020-2035
  • Figure 12: Global Market Volume (Units) Analysis by Company, 2020-2035
  • Figure 13: Global Market Value Share (%) and BPS Analysis by Company, 2025-2035
  • Figure 14: Global Market Y-o-Y Growth (%) Projections by Company, 2025-2035
  • Figure 15: Global Market Value (USD Billion) Analysis by Mobility Type, 2020-2035
  • Figure 16: Global Market Volume (Units) Analysis by Mobility Type, 2020-2035
  • Figure 17: Global Market Value Share (%) and BPS Analysis by Mobility Type, 2025-2035
  • Figure 18: Global Market Y-o-Y Growth (%) Projections by Mobility Type, 2025-2035
  • Figure 19: Global Market Value (USD Billion) Analysis by Use Case, 2020-2035
  • Figure 20: Global Market Volume (Units) Analysis by Use Case, 2020-2035
  • Figure 21: Global Market Value Share (%) and BPS Analysis by Use Case, 2025-2035
  • Figure 22: Global Market Y-o-Y Growth (%) Projections by Use Case, 2025-2035
  • Figure 23: Global Market Value (USD Billion) Analysis by Autonomy Level, 2020-2035
  • Figure 24: Global Market Volume (Units) Analysis by Autonomy Level, 2020-2035
  • Figure 25: Global Market Value Share (%) and BPS Analysis by Autonomy Level, 2025-2035
  • Figure 26: Global Market Y-o-Y Growth (%) Projections by Autonomy Level, 2025-2035
  • Figure 27: Global Market Value (USD Billion) Analysis by Customer Type, 2020-2035
  • Figure 28: Global Market Volume (Units) Analysis by Customer Type, 2020-2035
  • Figure 29: Global Market Value Share (%) and BPS Analysis by Customer Type, 2025-2035
  • Figure 30: Global Market Y-o-Y Growth (%) Projections by Customer Type, 2025-2035
  • Figure 31: Global Market Attractiveness by Company, 2025-2035
  • Figure 32: Global Market Attractiveness by Mobility Type, 2025-2035
  • Figure 33: Global Market Attractiveness by Use Case, 2025-2035
  • Figure 34: Global Market Attractiveness by Autonomy Level, 2025-2035
  • Figure 35: Global Market Attractiveness by Customer Type, 2025-2035
  • Figure 36: Global Market Attractiveness by Region, 2025-2035
  • Figure 37: North America Market Value (USD Billion) by Company, 2025-2035
  • Figure 38: North America Market Value (USD Billion) by Mobility Type, 2025-2035
  • Figure 39: North America Market Value (USD Billion) by Use Case, 2025-2035
  • Figure 40: North America Market Value (USD Billion) by Autonomy Level, 2025-2035
  • Figure 41: North America Market Value (USD Billion) by Customer Type, 2025-2035
  • Figure 42: North America Market Value (USD Billion) by Country, 2025-2035
  • Figure 43: North America Market Value (USD Billion) Analysis by Country, 2020-2035
  • Figure 44: North America Market Volume (Units) Analysis by Country, 2020-2035
  • Figure 45: North America Market Value Share (%) and BPS Analysis by Country, 2025-2035
  • Figure 46: North America Market Y-o-Y Growth (%) Projections by Country, 2025-2035
  • Figure 47: North America Market Value (USD Billion) Analysis by Company, 2020-2035
  • Figure 48: North America Market Volume (Units) Analysis by Company, 2020-2035
  • Figure 49: North America Market Value Share (%) and BPS Analysis by Company, 2025-2035
  • Figure 50: North America Market Y-o-Y Growth (%) Projections by Company, 2025-2035
  • Figure 51: North America Market Value (USD Billion) Analysis by Mobility Type, 2020-2035
  • Figure 52: North America Market Volume (Units) Analysis by Mobility Type, 2020-2035
  • Figure 53: North America Market Value Share (%) and BPS Analysis by Mobility Type, 2025-2035
  • Figure 54: North America Market Y-o-Y Growth (%) Projections by Mobility Type, 2025-2035
  • Figure 55: North America Market Value (USD Billion) Analysis by Use Case, 2020-2035
  • Figure 56: North America Market Volume (Units) Analysis by Use Case, 2020-2035
  • Figure 57: North America Market Value Share (%) and BPS Analysis by Use Case, 2025-2035
  • Figure 58: North America Market Y-o-Y Growth (%) Projections by Use Case, 2025-2035
  • Figure 59: North America Market Value (USD Billion) Analysis by Autonomy Level, 2020-2035
  • Figure 60: North America Market Volume (Units) Analysis by Autonomy Level, 2020-2035
  • Figure 61: North America Market Value Share (%) and BPS Analysis by Autonomy Level, 2025-2035
  • Figure 62: North America Market Y-o-Y Growth (%) Projections by Autonomy Level, 2025-2035
  • Figure 63: North America Market Value (USD Billion) Analysis by Customer Type, 2020-2035
  • Figure 64: North America Market Volume (Units) Analysis by Customer Type, 2020-2035
  • Figure 65: North America Market Value Share (%) and BPS Analysis by Customer Type, 2025-2035
  • Figure 66: North America Market Y-o-Y Growth (%) Projections by Customer Type, 2025-2035
  • Figure 67: North America Market Attractiveness by Company, 2025-2035
  • Figure 68: North America Market Attractiveness by Mobility Type, 2025-2035
  • Figure 69: North America Market Attractiveness by Use Case, 2025-2035
  • Figure 70: North America Market Attractiveness by Autonomy Level, 2025-2035
  • Figure 71: North America Market Attractiveness by Customer Type, 2025-2035
  • Figure 72: North America Market Attractiveness by Country, 2025-2035
  • Figure 73: Latin America Market Value (USD Billion) by Company, 2025-2035
  • Figure 74: Latin America Market Value (USD Billion) by Mobility Type, 2025-2035
  • Figure 75: Latin America Market Value (USD Billion) by Use Case, 2025-2035
  • Figure 76: Latin America Market Value (USD Billion) by Autonomy Level, 2025-2035
  • Figure 77: Latin America Market Value (USD Billion) by Customer Type, 2025-2035
  • Figure 78: Latin America Market Value (USD Billion) by Country, 2025-2035
  • Figure 79: Latin America Market Value (USD Billion) Analysis by Country, 2020-2035
  • Figure 80: Latin America Market Volume (Units) Analysis by Country, 2020-2035
  • Figure 81: Latin America Market Value Share (%) and BPS Analysis by Country, 2025-2035
  • Figure 82: Latin America Market Y-o-Y Growth (%) Projections by Country, 2025-2035
  • Figure 83: Latin America Market Value (USD Billion) Analysis by Company, 2020-2035
  • Figure 84: Latin America Market Volume (Units) Analysis by Company, 2020-2035
  • Figure 85: Latin America Market Value Share (%) and BPS Analysis by Company, 2025-2035
  • Figure 86: Latin America Market Y-o-Y Growth (%) Projections by Company, 2025-2035
  • Figure 87: Latin America Market Value (USD Billion) Analysis by Mobility Type, 2020-2035
  • Figure 88: Latin America Market Volume (Units) Analysis by Mobility Type, 2020-2035
  • Figure 89: Latin America Market Value Share (%) and BPS Analysis by Mobility Type, 2025-2035
  • Figure 90: Latin America Market Y-o-Y Growth (%) Projections by Mobility Type, 2025-2035
  • Figure 91: Latin America Market Value (USD Billion) Analysis by Use Case, 2020-2035
  • Figure 92: Latin America Market Volume (Units) Analysis by Use Case, 2020-2035
  • Figure 93: Latin America Market Value Share (%) and BPS Analysis by Use Case, 2025-2035
  • Figure 94: Latin America Market Y-o-Y Growth (%) Projections by Use Case, 2025-2035
  • Figure 95: Latin America Market Value (USD Billion) Analysis by Autonomy Level, 2020-2035
  • Figure 96: Latin America Market Volume (Units) Analysis by Autonomy Level, 2020-2035
  • Figure 97: Latin America Market Value Share (%) and BPS Analysis by Autonomy Level, 2025-2035
  • Figure 98: Latin America Market Y-o-Y Growth (%) Projections by Autonomy Level, 2025-2035
  • Figure 99: Latin America Market Value (USD Billion) Analysis by Customer Type, 2020-2035
  • Figure 100: Latin America Market Volume (Units) Analysis by Customer Type, 2020-2035
  • Figure 101: Latin America Market Value Share (%) and BPS Analysis by Customer Type, 2025-2035
  • Figure 102: Latin America Market Y-o-Y Growth (%) Projections by Customer Type, 2025-2035
  • Figure 103: Latin America Market Attractiveness by Company, 2025-2035
  • Figure 104: Latin America Market Attractiveness by Mobility Type, 2025-2035
  • Figure 105: Latin America Market Attractiveness by Use Case, 2025-2035
  • Figure 106: Latin America Market Attractiveness by Autonomy Level, 2025-2035
  • Figure 107: Latin America Market Attractiveness by Customer Type, 2025-2035
  • Figure 108: Latin America Market Attractiveness by Country, 2025-2035
  • Figure 109: East Asia Market Value (USD Billion) by Company, 2025-2035
  • Figure 110: East Asia Market Value (USD Billion) by Mobility Type, 2025-2035
  • Figure 111: East Asia Market Value (USD Billion) by Use Case, 2025-2035
  • Figure 112: East Asia Market Value (USD Billion) by Autonomy Level, 2025-2035
  • Figure 113: East Asia Market Value (USD Billion) by Customer Type, 2025-2035
  • Figure 114: East Asia Market Value (USD Billion) by Country, 2025-2035
  • Figure 115: East Asia Market Value (USD Billion) Analysis by Country, 2020-2035
  • Figure 116: East Asia Market Volume (Units) Analysis by Country, 2020-2035
  • Figure 117: East Asia Market Value Share (%) and BPS Analysis by Country, 2025-2035
  • Figure 118: East Asia Market Y-o-Y Growth (%) Projections by Country, 2025-2035
  • Figure 119: East Asia Market Value (USD Billion) Analysis by Company, 2020-2035
  • Figure 120: East Asia Market Volume (Units) Analysis by Company, 2020-2035
  • Figure 121: East Asia Market Value Share (%) and BPS Analysis by Company, 2025-2035
  • Figure 122: East Asia Market Y-o-Y Growth (%) Projections by Company, 2025-2035
  • Figure 123: East Asia Market Value (USD Billion) Analysis by Mobility Type, 2020-2035
  • Figure 124: East Asia Market Volume (Units) Analysis by Mobility Type, 2020-2035
  • Figure 125: East Asia Market Value Share (%) and BPS Analysis by Mobility Type, 2025-2035
  • Figure 126: East Asia Market Y-o-Y Growth (%) Projections by Mobility Type, 2025-2035
  • Figure 127: East Asia Market Value (USD Billion) Analysis by Use Case, 2020-2035
  • Figure 128: East Asia Market Volume (Units) Analysis by Use Case, 2020-2035
  • Figure 129: East Asia Market Value Share (%) and BPS Analysis by Use Case, 2025-2035
  • Figure 130: East Asia Market Y-o-Y Growth (%) Projections by Use Case, 2025-2035
  • Figure 131: East Asia Market Value (USD Billion) Analysis by Autonomy Level, 2020-2035
  • Figure 132: East Asia Market Volume (Units) Analysis by Autonomy Level, 2020-2035
  • Figure 133: East Asia Market Value Share (%) and BPS Analysis by Autonomy Level, 2025-2035
  • Figure 134: East Asia Market Y-o-Y Growth (%) Projections by Autonomy Level, 2025-2035
  • Figure 135: East Asia Market Value (USD Billion) Analysis by Customer Type, 2020-2035
  • Figure 136: East Asia Market Volume (Units) Analysis by Customer Type, 2020-2035
  • Figure 137: East Asia Market Value Share (%) and BPS Analysis by Customer Type, 2025-2035
  • Figure 138: East Asia Market Y-o-Y Growth (%) Projections by Customer Type, 2025-2035
  • Figure 139: East Asia Market Attractiveness by Company, 2025-2035
  • Figure 140: East Asia Market Attractiveness by Mobility Type, 2025-2035
  • Figure 141: East Asia Market Attractiveness by Use Case, 2025-2035
  • Figure 142: East Asia Market Attractiveness by Autonomy Level, 2025-2035
  • Figure 143: East Asia Market Attractiveness by Customer Type, 2025-2035
  • Figure 144: East Asia Market Attractiveness by Country, 2025-2035
  • Figure 145: South Asia & Pacific Market Value (USD Billion) by Company, 2025-2035
  • Figure 146: South Asia & Pacific Market Value (USD Billion) by Mobility Type, 2025-2035
  • Figure 147: South Asia & Pacific Market Value (USD Billion) by Use Case, 2025-2035
  • Figure 148: South Asia & Pacific Market Value (USD Billion) by Autonomy Level, 2025-2035
  • Figure 149: South Asia & Pacific Market Value (USD Billion) by Customer Type, 2025-2035
  • Figure 150: South Asia & Pacific Market Value (USD Billion) by Country, 2025-2035
  • Figure 151: South Asia & Pacific Market Value (USD Billion) Analysis by Country, 2020-2035
  • Figure 152: South Asia & Pacific Market Volume (Units) Analysis by Country, 2020-2035
  • Figure 153: South Asia & Pacific Market Value Share (%) and BPS Analysis by Country, 2025-2035
  • Figure 154: South Asia & Pacific Market Y-o-Y Growth (%) Projections by Country, 2025-2035
  • Figure 155: South Asia & Pacific Market Value (USD Billion) Analysis by Company, 2020-2035
  • Figure 156: South Asia & Pacific Market Volume (Units) Analysis by Company, 2020-2035
  • Figure 157: South Asia & Pacific Market Value Share (%) and BPS Analysis by Company, 2025-2035
  • Figure 158: South Asia & Pacific Market Y-o-Y Growth (%) Projections by Company, 2025-2035
  • Figure 159: South Asia & Pacific Market Value (USD Billion) Analysis by Mobility Type, 2020-2035
  • Figure 160: South Asia & Pacific Market Volume (Units) Analysis by Mobility Type, 2020-2035
  • Figure 161: South Asia & Pacific Market Value Share (%) and BPS Analysis by Mobility Type, 2025-2035
  • Figure 162: South Asia & Pacific Market Y-o-Y Growth (%) Projections by Mobility Type, 2025-2035
  • Figure 163: South Asia & Pacific Market Value (USD Billion) Analysis by Use Case, 2020-2035
  • Figure 164: South Asia & Pacific Market Volume (Units) Analysis by Use Case, 2020-2035
  • Figure 165: South Asia & Pacific Market Value Share (%) and BPS Analysis by Use Case, 2025-2035
  • Figure 166: South Asia & Pacific Market Y-o-Y Growth (%) Projections by Use Case, 2025-2035
  • Figure 167: South Asia & Pacific Market Value (USD Billion) Analysis by Autonomy Level, 2020-2035
  • Figure 168: South Asia & Pacific Market Volume (Units) Analysis by Autonomy Level, 2020-2035
  • Figure 169: South Asia & Pacific Market Value Share (%) and BPS Analysis by Autonomy Level, 2025-2035
  • Figure 170: South Asia & Pacific Market Y-o-Y Growth (%) Projections by Autonomy Level, 2025-2035
  • Figure 171: South Asia & Pacific Market Value (USD Billion) Analysis by Customer Type, 2020-2035
  • Figure 172: South Asia & Pacific Market Volume (Units) Analysis by Customer Type, 2020-2035
  • Figure 173: South Asia & Pacific Market Value Share (%) and BPS Analysis by Customer Type, 2025-2035
  • Figure 174: South Asia & Pacific Market Y-o-Y Growth (%) Projections by Customer Type, 2025-2035
  • Figure 175: South Asia & Pacific Market Attractiveness by Company, 2025-2035
  • Figure 176: South Asia & Pacific Market Attractiveness by Mobility Type, 2025-2035
  • Figure 177: South Asia & Pacific Market Attractiveness by Use Case, 2025-2035
  • Figure 178: South Asia & Pacific Market Attractiveness by Autonomy Level, 2025-2035
  • Figure 179: South Asia & Pacific Market Attractiveness by Customer Type, 2025-2035
  • Figure 180: South Asia & Pacific Market Attractiveness by Country, 2025-2035
  • Figure 181: Western Europe Market Value (USD Billion) by Company, 2025-2035
  • Figure 182: Western Europe Market Value (USD Billion) by Mobility Type, 2025-2035
  • Figure 183: Western Europe Market Value (USD Billion) by Use Case, 2025-2035
  • Figure 184: Western Europe Market Value (USD Billion) by Autonomy Level, 2025-2035
  • Figure 185: Western Europe Market Value (USD Billion) by Customer Type, 2025-2035
  • Figure 186: Western Europe Market Value (USD Billion) by Country, 2025-2035
  • Figure 187: Western Europe Market Value (USD Billion) Analysis by Country, 2020-2035
  • Figure 188: Western Europe Market Volume (Units) Analysis by Country, 2020-2035
  • Figure 189: Western Europe Market Value Share (%) and BPS Analysis by Country, 2025-2035
  • Figure 190: Western Europe Market Y-o-Y Growth (%) Projections by Country, 2025-2035
  • Figure 191: Western Europe Market Value (USD Billion) Analysis by Company, 2020-2035
  • Figure 192: Western Europe Market Volume (Units) Analysis by Company, 2020-2035
  • Figure 193: Western Europe Market Value Share (%) and BPS Analysis by Company, 2025-2035
  • Figure 194: Western Europe Market Y-o-Y Growth (%) Projections by Company, 2025-2035
  • Figure 195: Western Europe Market Value (USD Billion) Analysis by Mobility Type, 2020-2035
  • Figure 196: Western Europe Market Volume (Units) Analysis by Mobility Type, 2020-2035
  • Figure 197: Western Europe Market Value Share (%) and BPS Analysis by Mobility Type, 2025-2035
  • Figure 198: Western Europe Market Y-o-Y Growth (%) Projections by Mobility Type, 2025-2035
  • Figure 199: Western Europe Market Value (USD Billion) Analysis by Use Case, 2020-2035
  • Figure 200: Western Europe Market Volume (Units) Analysis by Use Case, 2020-2035
  • Figure 201: Western Europe Market Value Share (%) and BPS Analysis by Use Case, 2025-2035
  • Figure 202: Western Europe Market Y-o-Y Growth (%) Projections by Use Case, 2025-2035
  • Figure 203: Western Europe Market Value (USD Billion) Analysis by Autonomy Level, 2020-2035
  • Figure 204: Western Europe Market Volume (Units) Analysis by Autonomy Level, 2020-2035
  • Figure 205: Western Europe Market Value Share (%) and BPS Analysis by Autonomy Level, 2025-2035
  • Figure 206: Western Europe Market Y-o-Y Growth (%) Projections by Autonomy Level, 2025-2035
  • Figure 207: Western Europe Market Value (USD Billion) Analysis by Customer Type, 2020-2035
  • Figure 208: Western Europe Market Volume (Units) Analysis by Customer Type, 2020-2035
  • Figure 209: Western Europe Market Value Share (%) and BPS Analysis by Customer Type, 2025-2035
  • Figure 210: Western Europe Market Y-o-Y Growth (%) Projections by Customer Type, 2025-2035
  • Figure 211: Western Europe Market Attractiveness by Company, 2025-2035
  • Figure 212: Western Europe Market Attractiveness by Mobility Type, 2025-2035
  • Figure 213: Western Europe Market Attractiveness by Use Case, 2025-2035
  • Figure 214: Western Europe Market Attractiveness by Autonomy Level, 2025-2035
  • Figure 215: Western Europe Market Attractiveness by Customer Type, 2025-2035
  • Figure 216: Western Europe Market Attractiveness by Country, 2025-2035
  • Figure 217: Eastern Europe Market Value (USD Billion) by Company, 2025-2035
  • Figure 218: Eastern Europe Market Value (USD Billion) by Mobility Type, 2025-2035
  • Figure 219: Eastern Europe Market Value (USD Billion) by Use Case, 2025-2035
  • Figure 220: Eastern Europe Market Value (USD Billion) by Autonomy Level, 2025-2035
  • Figure 221: Eastern Europe Market Value (USD Billion) by Customer Type, 2025-2035
  • Figure 222: Eastern Europe Market Value (USD Billion) by Country, 2025-2035
  • Figure 223: Eastern Europe Market Value (USD Billion) Analysis by Country, 2020-2035
  • Figure 224: Eastern Europe Market Volume (Units) Analysis by Country, 2020-2035
  • Figure 225: Eastern Europe Market Value Share (%) and BPS Analysis by Country, 2025-2035
  • Figure 226: Eastern Europe Market Y-o-Y Growth (%) Projections by Country, 2025-2035
  • Figure 227: Eastern Europe Market Value (USD Billion) Analysis by Company, 2020-2035
  • Figure 228: Eastern Europe Market Volume (Units) Analysis by Company, 2020-2035
  • Figure 229: Eastern Europe Market Value Share (%) and BPS Analysis by Company, 2025-2035
  • Figure 230: Eastern Europe Market Y-o-Y Growth (%) Projections by Company, 2025-2035
  • Figure 231: Eastern Europe Market Value (USD Billion) Analysis by Mobility Type, 2020-2035
  • Figure 232: Eastern Europe Market Volume (Units) Analysis by Mobility Type, 2020-2035
  • Figure 233: Eastern Europe Market Value Share (%) and BPS Analysis by Mobility Type, 2025-2035
  • Figure 234: Eastern Europe Market Y-o-Y Growth (%) Projections by Mobility Type, 2025-2035
  • Figure 235: Eastern Europe Market Value (USD Billion) Analysis by Use Case, 2020-2035
  • Figure 236: Eastern Europe Market Volume (Units) Analysis by Use Case, 2020-2035
  • Figure 237: Eastern Europe Market Value Share (%) and BPS Analysis by Use Case, 2025-2035
  • Figure 238: Eastern Europe Market Y-o-Y Growth (%) Projections by Use Case, 2025-2035
  • Figure 239: Eastern Europe Market Value (USD Billion) Analysis by Autonomy Level, 2020-2035
  • Figure 240: Eastern Europe Market Volume (Units) Analysis by Autonomy Level, 2020-2035
  • Figure 241: Eastern Europe Market Value Share (%) and BPS Analysis by Autonomy Level, 2025-2035
  • Figure 242: Eastern Europe Market Y-o-Y Growth (%) Projections by Autonomy Level, 2025-2035
  • Figure 243: Eastern Europe Market Value (USD Billion) Analysis by Customer Type, 2020-2035
  • Figure 244: Eastern Europe Market Volume (Units) Analysis by Customer Type, 2020-2035
  • Figure 245: Eastern Europe Market Value Share (%) and BPS Analysis by Customer Type, 2025-2035
  • Figure 246: Eastern Europe Market Y-o-Y Growth (%) Projections by Customer Type, 2025-2035
  • Figure 247: Eastern Europe Market Attractiveness by Company, 2025-2035
  • Figure 248: Eastern Europe Market Attractiveness by Mobility Type, 2025-2035
  • Figure 249: Eastern Europe Market Attractiveness by Use Case, 2025-2035
  • Figure 250: Eastern Europe Market Attractiveness by Autonomy Level, 2025-2035
  • Figure 251: Eastern Europe Market Attractiveness by Customer Type, 2025-2035
  • Figure 252: Eastern Europe Market Attractiveness by Country, 2025-2035
  • Figure 253: Middle East & Africa Market Value (USD Billion) by Company, 2025-2035
  • Figure 254: Middle East & Africa Market Value (USD Billion) by Mobility Type, 2025-2035
  • Figure 255: Middle East & Africa Market Value (USD Billion) by Use Case, 2025-2035
  • Figure 256: Middle East & Africa Market Value (USD Billion) by Autonomy Level, 2025-2035
  • Figure 257: Middle East & Africa Market Value (USD Billion) by Customer Type, 2025-2035
  • Figure 258: Middle East & Africa Market Value (USD Billion) by Country, 2025-2035
  • Figure 259: Middle East & Africa Market Value (USD Billion) Analysis by Country, 2020-2035
  • Figure 260: Middle East & Africa Market Volume (Units) Analysis by Country, 2020-2035
  • Figure 261: Middle East & Africa Market Value Share (%) and BPS Analysis by Country, 2025-2035
  • Figure 262: Middle East & Africa Market Y-o-Y Growth (%) Projections by Country, 2025-2035
  • Figure 263: Middle East & Africa Market Value (USD Billion) Analysis by Company, 2020-2035
  • Figure 264: Middle East & Africa Market Volume (Units) Analysis by Company, 2020-2035
  • Figure 265: Middle East & Africa Market Value Share (%) and BPS Analysis by Company, 2025-2035
  • Figure 266: Middle East & Africa Market Y-o-Y Growth (%) Projections by Company, 2025-2035
  • Figure 267: Middle East & Africa Market Value (USD Billion) Analysis by Mobility Type, 2020-2035
  • Figure 268: Middle East & Africa Market Volume (Units) Analysis by Mobility Type, 2020-2035
  • Figure 269: Middle East & Africa Market Value Share (%) and BPS Analysis by Mobility Type, 2025-2035
  • Figure 270: Middle East & Africa Market Y-o-Y Growth (%) Projections by Mobility Type, 2025-2035
  • Figure 271: Middle East & Africa Market Value (USD Billion) Analysis by Use Case, 2020-2035
  • Figure 272: Middle East & Africa Market Volume (Units) Analysis by Use Case, 2020-2035
  • Figure 273: Middle East & Africa Market Value Share (%) and BPS Analysis by Use Case, 2025-2035
  • Figure 274: Middle East & Africa Market Y-o-Y Growth (%) Projections by Use Case, 2025-2035
  • Figure 275: Middle East & Africa Market Value (USD Billion) Analysis by Autonomy Level, 2020-2035
  • Figure 276: Middle East & Africa Market Volume (Units) Analysis by Autonomy Level, 2020-2035
  • Figure 277: Middle East & Africa Market Value Share (%) and BPS Analysis by Autonomy Level, 2025-2035
  • Figure 278: Middle East & Africa Market Y-o-Y Growth (%) Projections by Autonomy Level, 2025-2035
  • Figure 279: Middle East & Africa Market Value (USD Billion) Analysis by Customer Type, 2020-2035
  • Figure 280: Middle East & Africa Market Volume (Units) Analysis by Customer Type, 2020-2035
  • Figure 281: Middle East & Africa Market Value Share (%) and BPS Analysis by Customer Type, 2025-2035
  • Figure 282: Middle East & Africa Market Y-o-Y Growth (%) Projections by Customer Type, 2025-2035
  • Figure 283: Middle East & Africa Market Attractiveness by Company, 2025-2035
  • Figure 284: Middle East & Africa Market Attractiveness by Mobility Type, 2025-2035
  • Figure 285: Middle East & Africa Market Attractiveness by Use Case, 2025-2035
  • Figure 286: Middle East & Africa Market Attractiveness by Autonomy Level, 2025-2035
  • Figure 287: Middle East & Africa Market Attractiveness by Customer Type, 2025-2035
  • Figure 288: Middle East & Africa Market Attractiveness by Country, 2025-2035

Frequently Asked Questions

How big is the construction site surveillance robots market in 2025?

The global construction site surveillance robots market is valued at USD 968.3 million in 2025.

What will be the size of construction site surveillance robots market in 2035?

The size for the construction site surveillance robots market is projected to reach USD 1,330.5 million by 2035.

How much will be the construction site surveillance robots market growth between 2025 and 2035?

The construction site surveillance robots market is expected to grow at a 3.2% CAGR between 2025 and 2035.

What are the key mobility type segments in the construction site surveillance robots market?

The key mobility type segments in the construction site surveillance robots market are wheeled UGV, tracked UGV, and other configurations.

Which use case segment is expected to contribute significant share in the construction site surveillance robots market in 2025?

In terms of use case, security patrol segment is set to command 40.0% share in the construction site surveillance robots market in 2025.

Explore Similar Insights

Future Market Insights

Construction Site Surveillance Robots Market

Chat With

MaRIA

Hi There, I am MaRIA, Your Market Research Intelligence Assistant. How may I help you?